Bitcoin Live Chart BTCUSD M15Here is my view for BTCUSD on M15. The price should go down, you can put a pending order on the Order block. Trade Safe!
Btcusdidea

Bitcoin- I'm starting to doubt 46kI was bullish Bitcoin and expected it to rise towards 46k resistance.
My bullishness, however, has started to diminish with the price hovering around 42500 support and bulls looking very weak
The last attempt to rise above 44k was met with selling pressure giving us a lower high in rapport with the previous 45k
As I said, 42500 is support and fail from bulls to keep the price above opens the door for a new visit of 40k important figure
I'm looking to sell rallies from this point on

Bitcoin Live Chart BTCUSD H1Here is my view for BTCUSD on H1. The price should go down, you can put a pending order on the Order block or find an entry on LTF within OB Zone. Trade Safe!

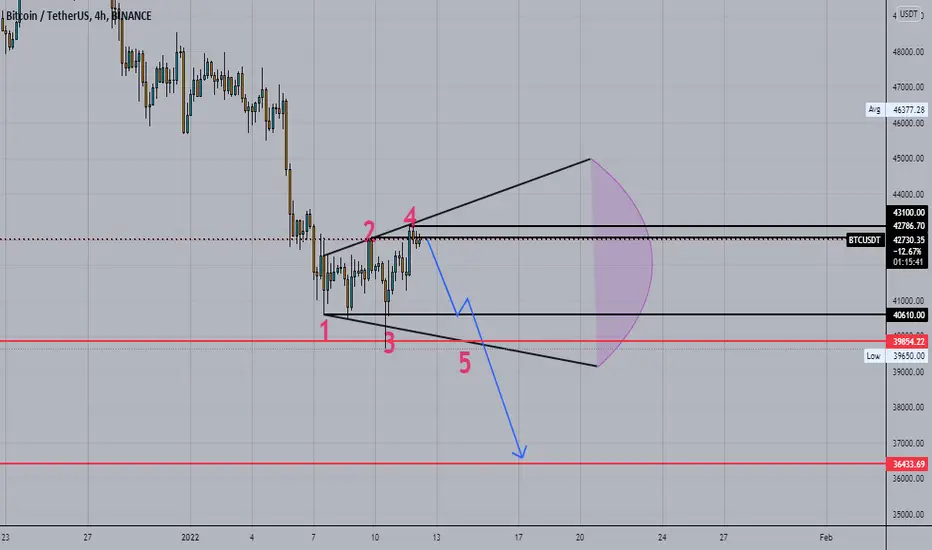
BTC still looking for a final wave 5 impulse.BTC has been trading in this range for more than a year now. It is still looking for that final wave 5 impulse move. However, the wave 4 correction is not complete and breaking down from here opens up the possibility of going down to 30K where it will find strong support. If you're in too deep, you should unwind you positions to a comfortable as we start to move up in the next few days.
BULL CASE
100K!
BEAR CASE
30K

BTCUSDT Upside PotentialIf B corrective wave is finished we could expect upside C wave to the 47500 level resistance zone.

btc try some risky long Situation is not very clear but still im in favour of long now I see some significant inflows to exchnages so someone will be selling good chunk of BTC now around 6000BTC
its still less as 2 days ago outflow at 24000 so I expect some down move to 40770 which is support and last fib uptrend line from recent uptrend
if you really want as last chance we can try 39650 few days ago there was strong bounce from this level and it was also spetember low after which we had mega nice bull run
so 2 entries 40700 39650 SL 500usd TP at 43900 when reach 43900 close half trade and rest trailing with 2000usd SL
its always good to react and update based on situation

Bitcoin- New leg up coming?As I said yesterday, although we are in a downtrend since November's top, at this moment Bitcoin can take a pause and correct some of the drop.
Also, I've mentioned 42500 as a support zone and that the cryptocurrency needs to stay above this zone in order to maintain this scenario intact.
At this moment we are exactly in this support and there is a high probability for a new leg up that can reach the former support now resistance at 46k
A buy here can also have a very good R:R, while a daily close under 42k would signal that the correction is over.

BTCUSD Ascending Channel Pattern#BTCUSD Hello trader, I hope are good and safe. Today I opened the chart of #BTCUSD for 1 Hour and analyzed it then I see that this chart has made a ASCENDING CHANNEL PATTERN, So I hope #BTCUDT will go downside,
If the market does not break support & resistance line then the market will go up.
Now Nice opportunity for short& long..
If you have any query then leave a COMMENT, LIKE and FOLLOW.
Keep Supporting And Thank You..

Bitcoin- Bulls need to maintain 42500 intactAlthough I'm holding a buy position at this moment on BtcUsd, one thing is clear in my mind, I speculate on a correction to the overall trend, which is down.
Yesterday, as expected, Bitcoin has broken above 42500 resistance and looks like it wants to challenge 46k important one.
As long as 42500 is intact I will maintain my bullish bias and speculators can search to buy on weakness.
On the other hand, a daily close under 42500 zone will signal that the correction is over and Bitcoin can dive even under 40k this time

BTC to 52K in 20 DAYZ!!!!!!!!!!!!!!Well some chart here some chart there , the risk reward looks pretty good to hit it so lets see how it pans out!
and on TODAY's NEWS
FED'S POWELL: STABLECOINS COULD CO-EXIST WITH A CENTRAL BANK DIGITAL CURRENCY that's bullish for crypto and also I think there is plenty of volume..

btc/usdt is in a very sensitive place or corrects to lower suppbtc/usdt is in a very sensitive place or corrects to lower support levels. It moves to the next ceiling, which can be a cow trap, and then falls again.

BTC May rise to 45,521 but be careful Downtrend PrevailsBTC may rise to $45,521, but this is just a normal Pull-back, and again we are still in a strong down-trend and can drop further more to $36,400 or even lower in coming weeks.

BTCUSD end of downtrend?BTCUSD might just ended 5th Elliot wave and broke old resistance trendline.
Is this downtrend is over? If the price won't go under the trendline, some upside action might happen with C counter trend wave.

BTCUSD Wait for the Trigger 🔥🔥Hello Traders , Welcome to this analysis, we are looking at the BTCUSD, the 1-hour timeframe.
My trading strategy is based on the simplicity .
Please don't forget to FOLLOW , LIKE and COMMENT .
If you like my analysis.
Thank you and Good Luck!

Btcusdt naking a Bearish Megaphone Pattern on 4 H timeframe Btcusdt making a Bearish Megaphone Pattern on 4 H timeframe .if it break down i am sure btc ll touch 36k in couple of hours
be care full
it is not a finacial advice
Bitcoin- Correction time?In yesterday's comment, I said that the selling pressure for Bitcoin evaporated and a relief rally could follow.
At this moment this scenario is more and more probable with the cryptocurrency breaking above the last range's resistance.
For continuation, bulls need the price above 43k and in this instance, the read is pretty clear to 46k strong resistance.
Bitcoin back in the previous range would delay this scenario and a negation comes if we have a break under 40k.
I'm bullish for now.

BITCOIN - BTC/USD - CHART ANALYSISBTC Looks Strong Bearish.
Right Now Price is at Demand Zone. But This DZ is looking Weak Now.
Although Market did BOS to downside.
Below are also some Supply Zone that still need to Mitigated.
I mentioned 2 Directional Arrows Movement.
You can easily understand what's my point of view.
Please mentioned what you are thinking about this.
Thanks.

Bitcoin Cryptocurrency 4H ForecastBitcoin (BTCUSD)-
BTCUSD has formed a double bottom around $39500 and shown a minor pullback. The pair has regained above $40000 after a sell-off of nearly $30000. It hits a low of $39558 at the time of writing and is currently trading around $41460.
CCI (50) below zero line and Woodies CCI- above zero line in the 4-hour chart.
DISCLAIMER: ((trade based on your own decision ))
<>

Bitcoin- Respiro moment for bears?Since Friday's last week's low, Bitcoin is trading in a range, and neither bulls nor bears managed to take control.
However, yesterday's spike and strong reversal from under 40.500 can be an indication that a short squeeze could follow soon.
I will look to buy dips against yesterday's low and if BtcUsd manages to break above 42.500 I expect acceleration to the upside.
My target for this correction is 46k zone

BTCUSD Ascending Triangle Pattern#BTCUSD Hello trader, I hope are good and safe. Today I opened the chart of #BTCUSD for 15 Min and analyzed it then I see that this chart has made a #AESCENDING TRAINGLE, So I hope BTCUSD will go up,
When price retest the resistance line then Nice opportunity for Buying.
If you have any query then leave a COMMENRT, LIKE & FOLLOW.
Keep Supporting And Thank You..

BTC HAVE BIG GOALS AT 100KHi all,
BTC = 100K
There have been a lot of changes in the past two weeks, the Crypto market has also received a lot of good news
recently, combined with OnChain analysis and market techniques including " Market Cap ", I think a Another
big wave is coming to the Crypto market in general, BTC has confirmed a " Cup And Handle " pattern
and is fighting the last resistance levels above.
The two directions I suggest for BTC are two different ways at the resistance area but in general the end target is
still the 100k area, the most necessary thing to be more certain now is to have good news such as some
large fund suddenly buying Bitcoin and then suddenly the volume appears.
Overall I quite agree with the market will continue to increase until the end of January 2022, maybe the market will
change direction if the Fed's financial tightening measures are introduced.
This is a very strange time in general, this has been a rather turbulent market in the nearly decade I have been
involved in investing.
I will try to update this case regularly even though my work is overwhelming, thank to reading me...

BTC Chart AnalysisBitcoin (BTCUSDT) needs some correction in the upcoming days then according to RSI tools BTC bullish more than ever in past records

BTCUSDBitcoin fell again last week for the second consecutive week, finally breaking below the key support level at $42,651 which now looks like it has flipped cleanly to become new resistance. Bitcoin has just made its lowest weekly close since July 2021. These are clearly bearish signs, but I see the nearest support level at $38,728 as likely to be very important. If this support level breaks down, I can see the price continuing lower to reach the base at about $32k which was formed last summer.
If we get a bullish daily candlestick bouncing off $38,728 that could be a long-shot long trade entry with a good potential reward to risk ratio. Alternatively, a daily close in BTC/USD below $38,728 could be a good short trade entry signal targeting $32k.
