BTCUSD Bitcoin Next Possible MovePair : BTCUSD ( Bitcoin / U.S Dollar )
Description :
Bullish Channel in Long Time Frame as an Corrective Pattern
Consolidation Phase
S / R Level
Break of Structure
Completed " 1234 " Impulsive Wave
RSI - Divergence
Btcusdidea

BTC - A Tale of a Ten Year Old Support Trend LineLads please pay attention! This 10 year old support trendline turned into a resistance in November 2022. Approach with extreme care! But bare in mind that this is crypto and it could get blasted through with vengeance.

Bitcoin Next Possible MovePair : BTCUSD ( Bitcoin / U.S Dollar )
Description :
Bearish Channel in STF as an Corrective Pattern
Divergence - RSI
Completed " ABC " Corrective Wave
Consolidation Phase
Break of Structure
Fibonacci Levels
S / R Level

BTCUSD 4June2023BTC medium term looks bullish. currently it could still be in the wave 2 period. although last week BTC managed to get out of the sideway area, but the range for prices to make corrections is still very wide.
looking at the fibo retracement area, there is a SnD area right at the 0.236 level (the price has dropped 76% from the last bullish swing) in my opinion this area is quite dominant, although in the medium term BTC looks bullish but it is likely that wave 2 is still not complete and it could be that the price is heading towards the SnD area.

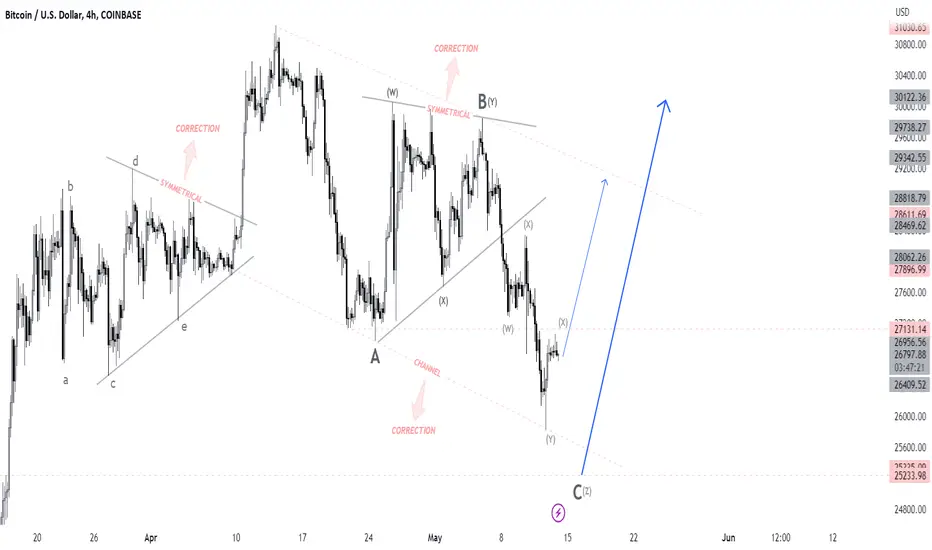
Bitcoin Next Week Possible MovePair : BTCUSD ( Bitcoin / U.S Dollar )
Description :
Completed " ABC " Correction
Impulse Correction Impulse
Symmetrical Triangle
SMC - CHOCH
Break of Structure
Bearish Channel as an Corrective Pattern in Long Time Frame and Rejection from the Lower Trend Line
Impulsive " wxyx " Wave will Completed its " z " at Daily S / R Level
BTC REPEATING HISTORY noting but ask your self that, Isn't looking very similar ??? if you have answer please comment your answer Thanks...!

BTC ROAD TO 11Kthere are lot of conformations now that we are going to 11k and also we can say this that was the amazing bull trap now the big guys are selling their bitcoins dont be trap with moon boy fuds etc

BTC: Continue to go long, pay attention to 23K
Last week, the economic data released by the United States was mixed, and the US dollar entered a period of volatile pullback. The monthly rate of durable goods orders in January recorded -4.5%, worse than the expected -4%, the largest decline since April 2020. The February ISM manufacturing PMI recorded 47.7, lower than the expected 48; However, the ISM service index recorded 55.1, stronger than the expected 54.5. Both PMIs suggest that US inflation may be more sticky than expected, which may support the future prospects of the US dollar's trend, but in fact, the US dollar index recorded a drop of nearly 0.7% last week.
Although from the perspective of the US dollar and risk appetite, the price trend of Bitcoin (BTC) should have been boosted last week, unfortunately, there was negative news in the crypto circle last week. According to reports, the cryptocurrency bank Silvergate announced that it will delay the submission of its annual 10-K report for the 2022 fiscal year. Silvergate stated that "the company is currently analyzing certain regulatory inquiries and investigations related to the company." Immediately afterwards, many cryptocurrency companies and cryptocurrency trading platforms such as Coinbase, Circle, and Tether urgently announced the termination of business dealings with it. The news caused panic in the crypto circle and put pressure on the price trend of Bitcoin.
The daily chart shows that the price of Bitcoin (BTC) fell sharply last Friday, breaking through the range of 23,000 to 24,000. It is currently holding steady near the upward support line of 22,000, which started on January 18, and there may be an opportunity for rebound correction in the trend. If it goes up, the initial resistance will focus on 23,000, and further up, the resistance will focus on the 20-day moving average range of 23,600 to 24,000. Continuing to break through will win the opportunity to challenge 25,000 again.
Personal trading strategy: Enter the long position at 22,000-22,400, with the first target at 23,000 and the second target at 23,600.
However, if it effectively falls below 22,000, it may usher in greater downside space, further down to 21,500 and 20,000. Therefore, it is necessary to set stop-loss strictly, and stop-loss promptly when breaking through the support. I will also continue to pay attention to changes in the market and give the latest strategies, please continue to pay attention.

BITCOIN BTC Bearish Possibility, Not Much To See Here!Has BTC exhausted its recent rally? Top has rounded and formed, Making lower lows and lower highs, Hitting key resistance, Has failed to sustain 50K, Momentum indicators divergent, and could be following my wave analysis for a pullback.
Still need to see price break 46.5k, 42k and 37k in my humble opinion. After that not much stopping it other than 23k and 16.5k
Just a simple idea analysis. Not much to see here.
Always be ready for any scenario!

Bitcoin BTC Next MovePair : Bitcoin BTC
Description :
Consolidation Phase in LTF if Breaks the Upper Trend Line then BUY and If Reject then SELL
Divergence
Completed " 12345 " Impulsive Wave and " ABC " Corrective Wave
Break of Structure
Falling Wedge as an Corrective Pattern in Short Time Frame as an Correction in Short Time Frame with the Breakout of the UTL

Bitcoin BTCUSD next MovePair : BTCUSD ( Bitcoin / U.S Dollar )
Description :
Break of Structure
Divergence
Symmetrical Triangle
Bullish Channel in LTF as an Corrective Pattern
Completed " 1234 " Impulsive Wave
Breakout the S / R Level

Higher Low RSI Set Up on BTCHigher Low RSI Set Up on BTC .
We have to visit an area that we climbed too fast. I believe it will occur at RSI when we will visit.
Rsi going lower when price going higher is a bullish set-up.
Price can move up without putting any lower low when this happens.
I believe 27.500 then 29000 will come.


BTC/USDTBitcoin should have gone down because it had a divergence in rsi and had filled sell orders at 25k and also encountered heavy resistance.
On the other hand, it was very good that the cme chat was also filled.
If he can close today's close candle above the ma 100 curve, he can hope for a rise in the short term, otherwise he can go down to the purple box that I specified.
At the moment, a full 5-wave Elliott pattern has also been observed, but the length of the 5th wave can change.

#Bitcoin - thoughts out loud #1.Good afternoon, dear colleagues!
I want to continue my opinion and vision of the current situation on the cryptocurrency market on the example of this instrument.
In the New Year, we see positive dynamics, but this is not enough to index this movement as "successful". Therefore, in order to update local highs, we have to go even lower to gain positions at more favorable prices for ourselves (price range 15555-16666). Scenarios of possible development of the situation №1,№2 are relevant, but the market will settle everything by itself.
If we consider the picture on the smaller time frames for a more detailed assessment of the market strength.
Dear colleagues, on the 4H time frame, we see how the price was artificially held by professional operators. Pay attention to the first two processes (marked with a circle), we have a great volume, a great result in relation to each other, but the progress does not suit us, okay, we can ignore the progress.
We go further and on the 3rd process there is a sign of local force on increased volumes, everything suits us perfectly. And the fourth, extreme situation (blue rectangle) highlighted bars and volumes, the question is why we observe an abnormal volume on the narrowing spread?
My assessment of this situation is "WEAKNESS" but on the news background we can observe a false breakout of the highs and further depreciation of the instrument.
Thank you all for your attention, I wish you success, and remember:
Sometimes you win/sometimes you learn.

BTC:Wait for the turning point
Bitcoin is currently in its third consecutive week of decline and has fallen below the 22,000 support level. Given Federal Reserve Chairman Powell's suggestion that interest rates are likely to continue to rise in the foreseeable future, Bitcoin's price has broken below its previous resistance and hit a low of 21,598 US dollars.
As the semi-annual monetary policy statement continues to affect market sentiment, both fundamental and technical factors have contributed to the price trend of Bitcoin. Higher interest rates have a negative impact on risk assets, including major cryptocurrencies, because holding cryptocurrencies does not generate interest income.
As the commodity channel index (CCI) falls into negative territory, technical indicators suggest that Bitcoin may already be oversold. However, as Bitcoin's price lingers around the next psychological support level of 22,000, breaking below this level could further tilt the price downward. The 21,376 US dollar support level from February lows could become the next support level, but it may also be a new turning point. Nevertheless, it must be admitted that breaking this level could bring market attention back to the 20,000 US dollar level. Therefore, it is advisable to maintain a light position in trading.
I have in-depth research on futures products such as cryptocurrencies, foreign exchange, stocks, gold, and crude oil, and I also update some daily trading layouts. Thank you for your attention and likes. If you have any questions, feel free to leave me a message, and I will give you the most prudent advice. I hope I can help you.

Can BTC still go long?
After being blocked at 24K, BTC fell sharply, and this large-scale decline was expected. Therefore, it was mentioned around 24K that profit-taking operations were needed. Although the long-term view is bullish, the market indeed needs to adjust before restarting.
This decline actually provides a better entry point, and I will continue to establish long positions here.
Personal operational suggestions: Enter long positions near 22,400, with the first profit-taking position at 23,220 and the second profit-taking position at 24,000. Each of my layouts requires patience and a good trading mentality. Friends with small funds and poor mentality should not participate.
I have conducted in-depth research on futures products such as cryptocurrencies, foreign exchange, stocks, gold, and crude oil. I also update daily operational layouts. Thank you for your attention and likes. Friends with questions can leave me a message in a timely manner, and I will provide the most secure advice. I hope I can help you.

Bitcoin poops off unbelievablyUnfortunately, the great master of escape has run out of steam this time...
Already in August 2022 it should have become clear that Bitcoin is only a charade and is on a downward path.

#BTCUSDT Very Important Update.Welcome to this extensive analysis everyone.
We have been nailing every single Bitcoin Update this year.
Hope you are following me on all our social platforms.
Now, let's get to the chart!
Bitcoin is currently trading right below the 200 WMA.
This weekly closed right below it.
Probably you have seen this chart before but I just want you to understand that this is very important for BTC to break and close above this MA.
It has always been the Bear Market bottom indicator and currently, it's the resistance we need to break through.
If BTC wants to start the rally, It should break in in Q1 of 2023.
We just have a month left for that.
Meaning 4 more candles.
Unless that happens I won't be doing too much leverage trading and stay mostly in BTC and Stables.
Lower Support lies between $19.8k and $20.3k.
MY NEXT UPDATE WILL BE ABOUT TEH ALTCOINS.
Make sure you follow me to avoid missing the same!
What's your plan?
Have you decided yet?
Let me know in the comment section.
Also, Do hit the like button if you like it.
Thank you.
#PEACE

BTC USD UpdatePrice is still ranging since hitting the 25K region of resistance.
Today's move was a swing failure pattern taking out the liquidity that was building up since last week.
The fixed range volume gives us a good indication of where the important levels are located. If the price loses the POC, then we look for a test of 24250, which is the value area low.
For the bullish case, I would want to see a clean break of the value area high 25K and ideally flip this as support

BITCOIN MISSION TO 30K #BTC MOST WATCH!BINANCE:BTCUSDT
here are my honest ideas on btc .keep in mind anything can happen.
hopefully the market will tap 30k price or more by march.
no long talk all info are on the chat.......

BTC Bitcoin New Week MovePair : BTC ( Bitcoin )
Description :
Break of Structure and Making its Retracement till its Daily Resistance Level
Divergence
Completed " 123 " Impulsive Wave and making Correction for the " 4th " Impulsive Wave
Impulse Correction Impulse
It can Reject from the Current Level or it can Go till the Daily S / R Level

BTC - Nothing to see here... Move alongBTC still in that ascending broadening wedge we all know it's bearish right? Ain't that right? Right?
