BTC buying power is gradually increasing💎 Update Plan BTC at the beginning of the week (June 30)
Notable news about BTC:
Anthony Pompliano has merged Procap BTC with Columbus Circle Capital I, established Procap Financial - a Bitcoin warehouse company up to $ 1 billion. The company will deploy lending activities, derivatives ... in order to create a collection line from BTC, according to the similar model
Bitcoin price is stable at about $ 107.4K on June 27, before the expiry date of options worth up to US $ 40 billion, capable of causing strong fluctuations. At the same time, on June 29, BTC exceeded $ 108k, up ~ 0.68% compared to the previous day
In the past 7 days, BTC maintained around $ 104–107K despite tensions in the Middle East and the US economic data is not heterogeneous. Reduce slightly but receive support from organized cash flow and global trade progress.
Technical analysis angle
Overview of trends - many signs of increasing
Looking at the candle is signaling "Strong Buy" on many time frames, especially healthy momentum, the ability to breakout $ 116k if surpassed the $ 110k resistance
ETF liquidity and organizational capital flows are supporting the trend of increasing, strengthening the possibility of breakthrough.
Moving Averages:
Frame 1H: 64% Bullish signal (MA20 reversed), but there is a neutral signal from short -term ghosts
Daily/Weekly: Golden Cross (Golden Cross) between 50‑ and 200‑ MA, is a long -term trend increase signal
Oscillators:
RSI frame Daily ~ 55, showing neutral momentum, not too much purchased but there is a rise. Double Rounded Top model on the chart Daily, the current trend is neutral - Bearish if the breakdown supports Neckline ~ $ 106k; In contrast, strong recovery above $ 114k will invalid this model
Long -term / Swing Trade: Keep the position if the price is maintained> $ 106k, use $ 103–104K as a spare hole stop.
Short -term / Scalp Trade: can be in order when the test price is $ 106k–107k, small latches around $ 110k.
==> Comments for trend reference. Wishing investors successfully trading
Btcusdlong

BTC Efforts to break the trend to create a new ATHPlan BTC today: 30 June 2025
Related Information:!!!
As of Monday, Bitcoin (BTC) is trading around $108,500, approximately 3% below its all-time high. Ethereum (ETH) has closed above a key resistance level, indicating the potential for a sustained upward movement. Meanwhile, Ripple (XRP) is approaching a critical threshold; a confirmed breakout could strengthen bullish momentum in the near term.
Bitcoin approaches record highs
The price of Bitcoin surged by 7.32% last week, closing above the $108,000 mark. As of the latest update on Monday, it remains near $108,500.
Should the current upward trend persist, BTC may extend its rally toward the all-time high of $111,980 recorded on May 22. A decisive close above this level could pave the way for further gains, potentially establishing a new all-time high at $120,000."
personal opinion:!!!
BTC buying pressure is prevented by selling pressure according to H4 trendline, accumulating and soon surpassing ATH
Important price zone to consider :!!!
support zone : 107.000 ; 104.600
Sustainable trading to beat the market

#btc #btcusd #elliottwave long buy setup wave 5/3 30Jun25This count is based on my assumptions so anything can happen not a trading or financial advice just for educational purposes only kindly do your own ta thanks trade with care good luck.

BTC recovers, price range sideways trend line💎 Update Plan BTC (June 25)
Notable news about BTC:
🌐 Growth stimulus factor
Reducing geopolitical tensions: The ceasefire agreement between Iran and Israel has helped improve investor psychology, promote capital inflows into risky assets like Bitcoin.
The dollar weakened: The USD index dropped to the lowest level in a year due to concerns about the economic impact from President Trump's tax policies, making Bitcoin a more attractive choice for investors to search for replacement assets.
Expectations for monetary policy: The decision of the US Federal Reserve (Fed) on keeping interest rates stable and interest rate cutting capacity in July has motivated the cryptocurrency market.
Technical analysis angle
Bitcoin may increase to the highest level of all time
Bitcoin price reached the lowest level of $ 98,200 on Sunday but has recovered strongly 5% in the next two days, closed on the dynamic average line according to the 50 -day exponential jaw at $ 103,352. At the time of writing on Monday, the price continued to trade higher at about $ 106,500.
If BTC continues to increase, the price can expand the momentum to the highest level of all time is $ 111,980 on May 22.
The relative power index (RSI) on the daily chart is 54, higher than the neutral level of 50, showing the motivation for price increase. The average divergent divergence (MACD) is referring to the price intersection (the MACD is about to cut on the signal line), if completed, the purchase signal will be made.
==> Comments for trend reference. Wishing investors successfully trading

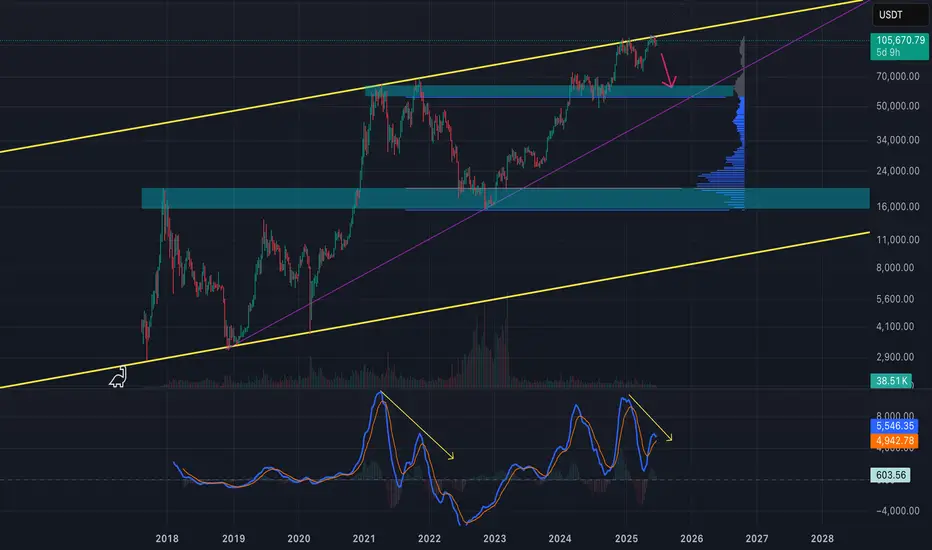
BTC - Getting 2021 Double Top/Bearish VibesLooking at the weekly chart for BTC, I'm seeing similar price action from when we double topped in 2021. We hit the top of the channel, corrected, and then had a slightly higher high before going down hard. Again we hit the top of the channel, had a strong correction, only to hit it again for a slightly higher high. But the signs of market weakness are showing in the indicators and price action. Not to mention war is looming between Israel and Iran. I'm taking a defensive posture here. I think if the bears take control, we could hit the $60k liquidity area that we missed on the last correction. We can reassess the market better at the time based on the price action and current events.
NEW BTC HIGHS?BTC just broke a previous resistance zone. Previous data indicates a more upward push.
This may even lead to new highs.
Current BTC Trend Analysis and Trading RecommendationsToday, U.S. markets are closed, leading to light trading activity and relatively limited overall market volatility. From a technical analysis perspective, the 4-hour K-line chart currently shows prices trading below the middle band of the Bollinger Bands, exhibiting a classic range-bound consolidation pattern. Bulls and bears are locked in a tug-of-war between key support and resistance levels, with K-line formations alternating between bullish and bearish patterns.
In terms of chart structure, the lower support zone has demonstrated strong buying conviction, while the upper resistance level has exerted clear restrictive force. Multiple failed upward breakouts have formed a short-term top. This box consolidation—characterized by resistance above and support below—is expected to sustain sideways trading through Friday.
Against the backdrop of no major positive catalysts, bearish momentum may gradually dominate if no substantial bullish triggers emerge. Maintain a trading strategy of selling into strength.
BTCUSD
105000-105500
tp:104000-103000
Investment itself is not the source of risk; it is only when investment behavior escapes rational control that risks lie in wait. In the trading process, always bear in mind that restraining impulsiveness is the primary criterion for success. I share trading signals daily, and all signals have been accurate without error for a full month. Regardless of your past profits or losses, with my assistance, you have the hope to achieve a breakthrough in your investment.

Current BTC Trend Analysis and Trading RecommendationsThe daily candlestick chart of BTC shows a three - day consecutive bearish retracement, having fallen back to the vicinity of the starting point of the previous pinbar rebound and currently remaining in a recent low - level sideways consolidation zone. However, the 4 - hour trend is pressured by the middle band of the Bollinger Bands, staying within a downward channel and forming a rebound - retracement wave pattern.
For short - term strategies, anticipate a further retracement first. Long positions should be initiated only after the support level is confirmed valid. This retracement represents a necessary consolidation phase before the bullish trend continues, and the current adjustment range does not pose a substantial threat of trend reversal to the overall uptrend. With the core upward trend intact and the direction remaining clear, BTC is expected to resume its upward momentum after a brief consolidation. The operational approach remains to go long on retracements.
BTCUSD
buy@103500-104000
tp:105500-106500
Investment itself is not the source of risk; it is only when investment behavior escapes rational control that risks lie in wait. In the trading process, always bear in mind that restraining impulsiveness is the primary criterion for success. I share trading signals daily, and all signals have been accurate without error for a full month. Regardless of your past profits or losses, with my assistance, you have the hope to achieve a breakthrough in your investment.

BTC Accumulated Over 104K💎 BTC PLAN UPDATE (June 16)
NOTABLE BITCOIN (BTC) NEWS:
At least four publicly listed U.S. companies announced plans on Tuesday to significantly increase their cryptocurrency exposure, committing a combined $844 million in new investments. The move reflects a growing corporate appetite for Bitcoin and other digital assets as alternative stores of value and growth opportunities.
The most substantial commitment came from Hong Kong-based ready-meal provider DDC Enterprise Ltd, which disclosed three separate purchase agreements totaling $528 million. The entire sum is earmarked for expanding the company’s Bitcoin reserves.
Technical analysis angle
DAY DAY: Bitcoin is united when uncertainty takes root
Bitcoin price moves widely at about $ 106,300 at the time of writing the article after failing to reach the $ 107,000 resistance threshold on Monday. Its technical structure, as observed from the daily chart below, shows the trend of price increases.
The dynamic convergence indicator (MACD) has maintained the signal to be confirmed on Thursday when the blue MACD line cut under the red signal line. This signal often encourages traders to consider reducing exposure to Bitcoin, thereby creating a dynamic motivation.
The relative power index (RSI) highlights the discount trend when it is sloping, approaching the middle line 50. The movement is below this important neutral level that can catalyze the downtrend, bringing the average exponent dynamic line of 50 days (EMA) at $ 103,064, the 100 -day EMA road at $ 98,783 and the 200 -day EMA road at $ 93,083 to become expected targets.
==> Comments for trend reference. Wishing investors successfully trading

Bitcoin - Inverse Head & Shoulders on 4h (Neckline broken)Looking forward to a new ATH shortly IF the neckline holds.
BITSTAMP:BTCUSD
BINANCE:BTCUSD
COINBASE:BTCUSD
CRYPTOCAP:TOTAL
CRYPTOCAP:OTHERS
BINANCE:ETHUSD
COINBASE:ETHUSD
BINANCE:SOLUSD
OANDA:XAUUSD
FX_IDC:XAUUSD

Current BTC Trend Analysis and Trading RecommendationsToday's overall BTC market rebounded after hitting a low of 102,614 in the early trading session, with Bitcoin's price maintaining a slow upward trend throughout the day. The intraday high reached 105,912 but encountered resistance. As the weekend approaches, historical market data shows limited volatility during weekends, so range-bound fluctuations are expected for the weekend.
From the current overall market rhythm, the price has rebounded slightly today after the previous decline. The hourly chart shows consecutive upward candles, though the price movement remains relatively slow. As time progresses, the price is expected to sustain an upward trend after pullbacks, and breaking through the short-term resistance level is only a matter of time. In terms of short-term structure and pattern, despite slight resistance and minor pullbacks, the downward momentum has weakened. We can still focus on long positions at lower levels, paying attention to the 106,000 resistance level.
BTCUSD
buy@104000-104500
tp:106000-107000
Investment itself is not the source of risk; it is only when investment behavior escapes rational control that risks lie in wait. In the trading process, always bear in mind that restraining impulsiveness is the primary criterion for success. I share trading signals daily, and all signals have been accurate without error for a full month. Regardless of your past profits or losses, with my assistance, you have the hope to achieve a breakthrough in your investment.

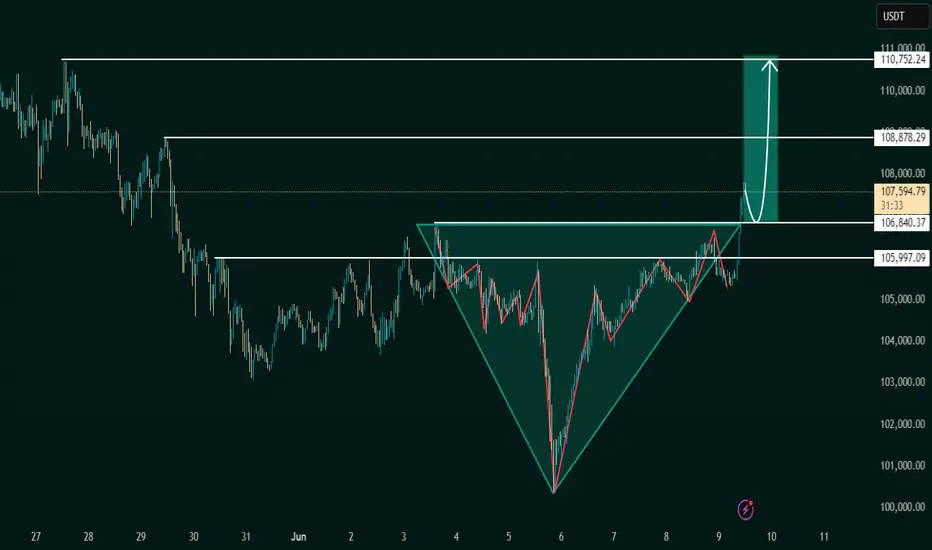
Inverse Head and Shoulders Breakout Signals BullishThe chart under review presents a classic Inverse Head and Shoulders pattern, a reliable and widely recognized bullish reversal formation in technical analysis. This structure typically forms after a downtrend, indicating a potential shift in market sentiment from bearish to bullish.
The pattern is composed of:
Left Shoulder: A modest price decline followed by a temporary upward correction.
Head: A deeper price decline forming the lowest point in the pattern.
Right Shoulder: A higher low that mirrors the left shoulder, followed by another upward movement.
The neckline, which acts as a critical resistance level, is clearly illustrated at approximately 106,840.37 USDT. A confirmed breakout above this neckline suggests the completion of the reversal pattern and validates the potential for a sustained bullish movement.
2. Breakout Confirmation
The current price action confirms a successful breakout above the neckline, with the market currently trading around 107,586.58 USDT. This breakout is a key signal for bullish continuation, provided it is supported by increased volume and follow-through price action.
From a technical standpoint, the breakout is reinforced by:
A clean violation of neckline resistance
Price consolidation near breakout zone before a strong upward thrust
Higher lows preceding the breakout, indicative of growing buying pressure
This confluence of technical signals strengthens the case for an upward price trajectory in the near term.
3. Projected Price Targets
Upon confirmation of the Inverse Head and Shoulders breakout, target levels can be derived using the measured move technique. This involves projecting the vertical distance from the head to the neckline upward from the breakout point.
Target 1 (Initial Resistance):
108,878.29 USDT – This level represents a potential short-term resistance where price may consolidate or retrace slightly before continuing.
Target 2 (Measured Move Completion):
110,752.24 USDT – This is the ultimate price target derived from the height of the head-to-neckline structure. Reaching this level would represent the full realization of the reversal pattern.
4. Key Support and Risk Levels
Risk management is a critical component of any trading strategy. The following support levels should be closely monitored:
106,840.37 USDT (Neckline Support):
Former resistance turned support. Holding above this level post-breakout is essential for sustaining bullish momentum.
105,997.09 USDT:
Acts as a secondary support level and potential stop-loss region for conservative traders.
If price fails to hold above the neckline and falls back below these levels, the breakout could be classified as a false breakout, warranting caution.
5. Strategic Implications for Traders
This setup provides a favorable risk-to-reward ratio for long entries, particularly for traders seeking to capitalize on momentum-based patterns. An optimal trading approach could involve:
Entry: Near the neckline breakout or on a minor retest of 106,840.37 USDT
Stop-Loss: Below 105,997.09 USDT or under the right shoulder to account for volatility
Take-Profit Zones: Partial profits near 108,878.29 USDT, with final target at 110,752.24 USDT
6. Final Remarks
This chart illustrates a textbook example of a bullish reversal pattern in play. While the technical outlook is favorable, traders should remain cautious of potential invalidation scenarios, especially in highly volatile or news-driven markets. Confirmation through volume analysis and supportive macro/fundamental conditions can further enhance confidence in the bullish thesis.
Overall, the current setup indicates a well-structured opportunity for upward price movement, with a clearly defined entry, risk, and reward framework.
Let me know if you'd like this tailored for a trading journal, client report, or automated strategy setup
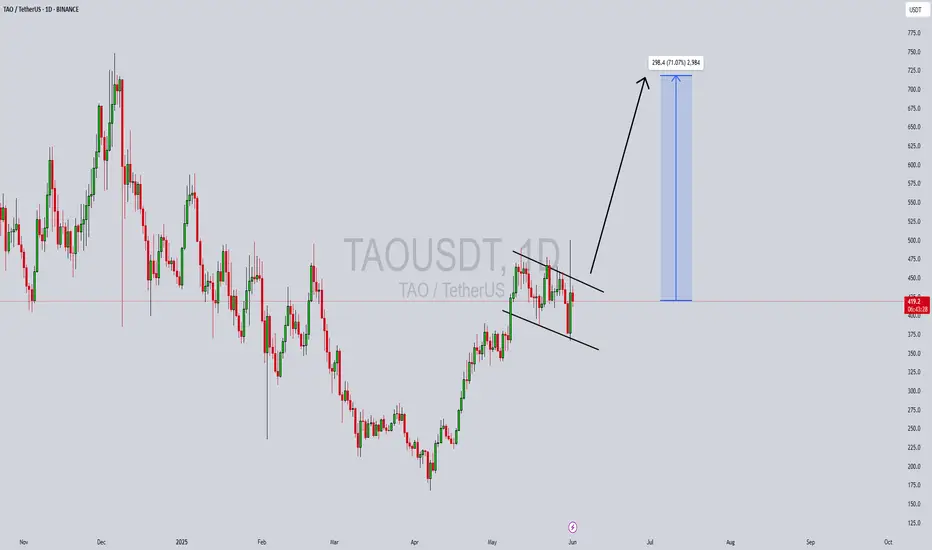
TAOUSDT Forming Bullish FlagTAOUSDT is currently showcasing a classic bullish flag pattern, signaling the possibility of a strong continuation to the upside. This pattern typically forms after a sharp upward movement, followed by a period of consolidation in a descending channel. In TAO’s case, the recent price behavior indicates healthy consolidation with diminishing volatility, and volume remains steady—hinting at accumulation before a potential breakout. If confirmed, this setup could lead to a projected gain of 60% to 70%+ from the breakout zone.
TAO (Tap Protocol) has been gaining attention in the blockchain and AI sectors due to its role in decentralized knowledge-sharing systems. The recent increase in investor interest is fueled by TAO’s integration into innovative use cases and partnerships that continue to evolve. As new narratives around decentralized AI and infrastructure gain traction, TAO appears to be well-positioned for both utility growth and speculative upside. This aligns with the observed price consolidation, forming a foundation for an impending move higher.
Technically, the bullish flag structure is forming just above key support levels, with short-term moving averages acting as dynamic support. A breakout above the flag’s resistance trendline with strong volume confirmation would be a key bullish trigger. Traders and investors are watching this level closely, as the breakout could rapidly accelerate price toward previous highs, supported by solid market structure.
Given the strong fundamentals, technical setup, and renewed attention from the trading community, TAOUSDT presents a compelling mid-term opportunity. This is one of the cleaner patterns on the charts right now, making it a favorable candidate for breakout traders seeking high-reward setups.
✅ Show your support by hitting the like button and
✅ Leaving a comment below! (What is You opinion about this Coin)
Your feedback and engagement keep me inspired to share more insightful market analysis with you!
SOLVUSDT Forming a Bullish waveSOLVUSDT is showing a strong bullish wave pattern after an extended downtrend, suggesting that it may have completed its accumulation phase. The chart clearly illustrates a double-wave reversal formation with higher lows, pointing toward a bullish continuation. The recent breakout candle combined with solid trading volume indicates renewed market interest and a possible start of a major uptrend. Based on the structure, a potential move of 90% to 100% from current levels seems realistic, as highlighted in the price projection zone.
Solv Protocol, the project behind SOLV, has been making strides in the decentralized financial instrument space, particularly around tokenized vouchers and structured assets. With increasing on-chain activity and protocol developments, investor sentiment appears to be turning positive again. SOLV’s listing on major exchanges like Binance further supports the legitimacy and growing traction of the token. As crypto markets rotate capital into emerging sectors, tokens like SOLV are gaining more visibility.
From a technical perspective, SOLVUSDT has broken out from a significant descending channel, forming a base with strong upward momentum. Each retracement is being bought up quickly, confirming bullish strength. If the price holds above key support zones, the upside continuation may play out rapidly as traders and algorithms begin to follow the breakout signal.
With bullish market structure, increasing investor attention, and favorable tokenomics, SOLVUSDT looks poised for a powerful upward run. This is one of the more promising setups for traders looking to ride a fresh wave with high risk-reward potential.
✅ Show your support by hitting the like button and
✅ Leaving a comment below! (What is You opinion about this Coin)
Your feedback and engagement keep me inspired to share more insightful market analysis with you!

Bitcoin is nearing a critical breakout zone at $86,000Bitcoin is nearing a critical breakout zone at $86,000.
If this level breaks with strong momentum, we could see a rapid bullish continuation toward the major resistance area around $105,000. The ascending channel remains intact, and aggressive buying near support points to a strong upside setup.
From a fundamental view, Bitcoin is gaining strength as global uncertainty rises. The latest escalation of trade tariffs has disrupted traditional markets, pushing more investors toward alternative assets like Bitcoin. Historically, Bitcoin has performed strongly during times of economic instability.
Tightening monetary policies worldwide are fueling recession fears, making Bitcoin even more attractive as a hedge — the new "digital gold." With institutional interest growing, Bitcoin is well-positioned for a significant capital inflow.
Stay ready — the next big move is close! 🚀

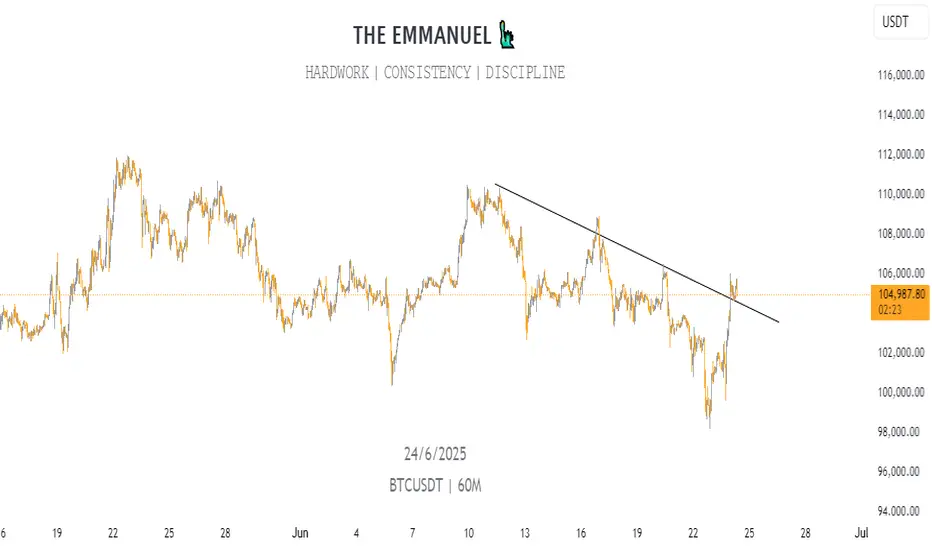
BTC/USD – Double Top Breakdown Signals Bearish Wave- 4H chart. 🧨
🔍 Chart Analysis:
🟢 Recent Price Action:
Bitcoin formed a double top pattern near the Recent All-Time High (ATH) 📈 — a strong bearish signal 🔔.
A trendline break occurred right after the second peak, confirming potential weakness ⚠️.
🟠 Supply Zone:
Price re-entered a previous supply zone (resistance area) and failed to hold above it 🧱 — indicating sellers are active again.
🔵 EMA 70 (Blue Line):
The price has dropped below the 70 EMA, signaling momentum shift from bullish to bearish 📉.
🔴 STOP LOSS ZONE:
Positioned above 110,555 🚫 — risk level for this short setup if bulls reclaim control.
🟡 Bearish Pathway (Expected Move):
Price may retest the broken zone 🔁.
Followed by a sharp drop to the 1st support near $101,503 🎯.
Confirmed by large bearish volume spikes 📊.
💥 Trade Idea:
Entry: Near 106,000 (on retest of supply zone).
Stop Loss: Above 110,555 🔺.
Target: $101,500 🎯.
Risk/Reward Ratio: 🔥 Favorable setup for swing short sellers!
📛 Pattern Breakdown:
⚠️ Double Top = Reversal Signal.
🔻 Trendline Break = Shift in Market Structure.
🧊 Supply Zone Rejection = Bearish Confirmation.

BTC/USD Long-Term Channel Targeting 120,721 – 136,849Bitcoin continues to trade within a well-defined ascending channel on the weekly timeframe. After a healthy corrective phase, price action is rebounding strongly off the channel’s lower boundary, aligning with the ongoing long-term bullish trend.
🔹 Wave Structure and Fibonacci Extensions:
The corrective structure suggests a completed ABC pattern, with the current move potentially initiating a new bullish impulse.
Key Fibonacci extension levels:
161.8% at 120,721
200% at 130,246
224% at 136,849
These levels correspond to the upper channel boundary, providing potential long-term upside targets.
🔹 Oscillator Confirmation:
The DTOsc indicator is rebounding from oversold territory, suggesting renewed bullish momentum.
📌 Trade Idea:
Long-term bias: Bullish, targeting upper Fibonacci levels within the channel
Invalidation: A weekly close below the channel’s lower boundary (~85,000) would challenge this scenario
This chart supports a patient, long-term bullish view for BTC/USD, with significant upside targets over the coming months.

Bitcoin is expected to rise in a volatile upward trend.The Bitcoin market has demonstrated extremely eye-catching performance, with prices strongly breaking through key resistance levels and hitting new all-time highs. It has successfully surged past the $110,000 threshold, and Bitcoin's total market capitalization has exceeded $2.1 trillion, rising to the fifth position in the global asset market capitalization ranking, trailing only gold, Microsoft, NVIDIA, and Apple. Since May, Bitcoin has accumulated a nearly 16% gain, with a year-to-date (YTD) increase of approximately 17%, significantly outperforming U.S. equities and gold.
Most analysts believe that if Bitcoin can effectively breach the $109,000 resistance level, it is expected to test the $120,000-$150,000 range within this year. Institutions such as JPMorgan Chase and Standard Chartered Bank have provided target price forecasts of $120,000-$150,000, primarily based on factors including the current upward trend of Bitcoin, capital inflows, and market sentiment.
In the market, there are no absolutes, and neither upward nor downward trends are set in stone. Therefore, the ability to judge the balance between market gains and losses is your key to success. Let money become our loyal servant.

BTC/USD: Structural Breakout of Curved Resistance – Eyes on $116Technical Overview:
Bitcoin (BTC) has successfully completed a significant technical breakout after months of accumulation and resistance interaction. The chart highlights a precise market structure where price has moved from a phase of consolidation into a confirmed bullish breakout, with a clearly defined target and invalidation level.
1. SR Interchange Zone (Support-turned-Resistance):
From May to October 2024, BTC price action was trapped in a sideways range, marked by an extended accumulation phase between approximately $60,000 to $73,000. This zone acted as a historical resistance level during the downtrend, but was later flipped into support, forming a classic SR Interchange — a foundational concept in market structure analysis.
This area provided a strong base from which BTC launched its late 2024 rally.
2. Consolidation Below Curved Resistance (Dec 2024 – Apr 2025):
Following a steep bullish impulse, BTC entered a multi-month consolidation phase, forming a rounded top pattern — shown on the chart as the Black Mind Curve Resistance. This curved resistance represented a psychological and structural ceiling, suppressing bullish momentum and trapping liquidity.
Price action was tightly compressed under this dynamic resistance curve, with multiple failed breakout attempts. This period was marked by range-bound volatility and low directional commitment — classic behavior during a re-accumulation phase.
3. Breakout of Black Mind Curve Resistance (May 2025):
A major technical event occurred as BTC broke decisively above the Black Mind Curve Resistance, accompanied by a surge in bullish momentum. This move not only invalidated the prior rounding top structure but also confirmed a trend continuation breakout.
The breakout was clean, with strong follow-through volume and a higher high structure above the Major Horizontal Resistance Zone (~$105,000–$109,000) — now confirmed as flipped support.
4. Bullish Continuation & Price Target:
Following the breakout, BTC has established a higher low and continued its upward trajectory toward the marked target zone at $116,065. This zone coincides with:
Previous untested supply levels
Technical Fibonacci extension (1.272–1.618 zone)
Measured move from the curve structure base
With current momentum and structure intact, BTC remains bullishly biased until it either reaches the target zone or breaks below the invalidation level.
5. Invalidation & Risk Management:
A close below $102,005 — the defined SI (Support-Invalidation) level — would be considered structurally bearish. This level represents:
The most recent higher low
Base of the breakout structure
Re-entry into previous consolidation range
A breakdown below this level would invalidate the bullish thesis and may open the door for a deeper pullback toward $95,000 or even $88,000.
✅ Conclusion:
The breakout of the Black Mind Curve Resistance marks a significant technical shift in Bitcoin’s trend. With momentum in favor of the bulls and market structure supporting higher prices, BTC appears poised to test the $116,000 target zone in the short to mid-term — barring a breakdown below key support.
📌 Key Levels Recap:
Level Type Price
Target Zone $116,065
Current Price $110,902
Support / Invalidation (SI) $102,005
📈 Strategy Outlook:
Bias: Bullish
Entry Area: Retest of $107,000–$109,000 (if offered)
Target: $116,065
Stop-Loss: Below $102,005 (structural invalidation)
💬 Stay focused on structure, not emotions. The best trades are born from patience, not prediction.
Let me know if you'd like a summary version for use on social media or a custom signature block for your TradingView profile.

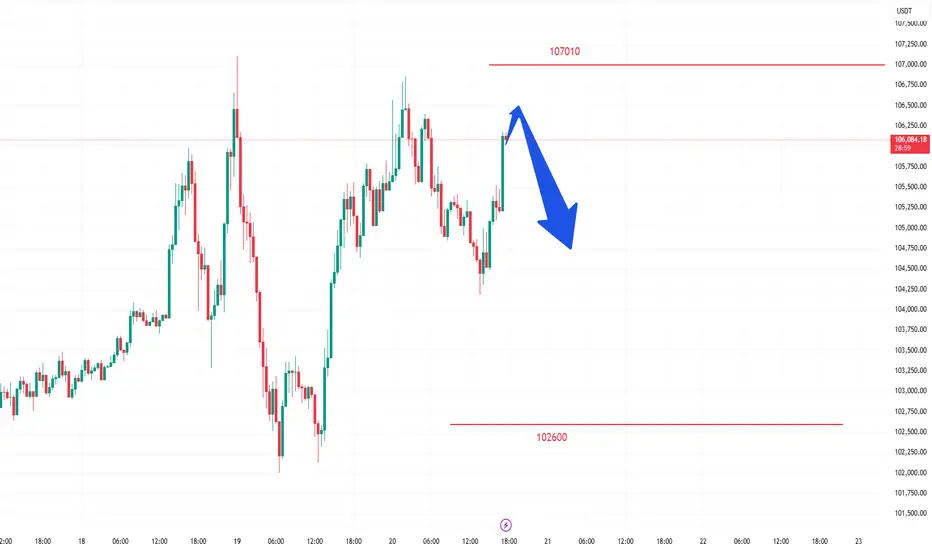
BTC - Short term playsAnalysis of today's BTC trend:
• Daily timeframe: Closed with a small bearish candle yesterday, showing a single bearish-bullish pattern. The price is consolidating at high levels, failing to sustain the breakout after news-driven highs, indicating a short-term range-bound oscillation.
• Hourly chart: The resistance at the high of 107,000 area (double top resistance), and the support at the low of 102,000 area (double bottom support), with an obvious range-bound pattern.
Short-term contract trading strategy:
1. Short position: Short at 105,800, stop loss at 106,300, target at 104,500.
2. Long position: Long at 104,500, stop loss at 104,000, target at 106,000.
In the market, there are no absolutes, and neither upward nor downward trends are set in stone. Therefore, the ability to judge the balance between market gains and losses is your key to success. Let money become our loyal servant.
Bitcoin (BTC/USDT) - Support Trendline & Zone Price Test - DailyBitcoin (BTC/USDT) price recently rejected down from $107000 on May 19th, 2025.
The yellow Support Trendline below is currently being tested ($103000 price level).
Several candle body closes below the Support Trendline could signal weakness in the daily price trend (potential rising wedge pattern).
The April inverse head-and-shoulders price pattern and targets have been completed (+12% and +24%).
note: Breaking news, government law changes, corporate announcements, and crypto crime could affect the Bitcoin price and charts.

BTCUSD - Bullish Breakout from Falling Wedge Pattern | Target Bitcoin has broken out of a Falling Wedge Pattern on the daily timeframe, signaling a bullish reversal that aligns with the broader market sentiment. Let’s examine this setup in detail, from pattern recognition to key support/resistance levels and trade planning.
🧠 Pattern Analysis – Falling Wedge Formation
The chart displays a textbook Falling Wedge, which is a bullish chart pattern that typically forms after a downtrend. It’s characterized by converging trendlines sloping downward, showing a slowdown in bearish momentum and a potential reversal point.
Formation Period: This wedge developed over a multi-week period (Feb–April 2025).
Structure: Each swing high and swing low forms lower highs and lower lows inside the wedge.
Breakout Confirmation: Price has decisively broken above the upper trendline of the wedge, validating a potential bullish continuation.
👉 Falling Wedge patterns are often seen near the end of a corrective move and suggest accumulation before a rally.
🔎 Key Technical Zones
🔸 Resistance Zone (~$103K–$105K)
This area has historically acted as a strong resistance zone.
Price is currently consolidating just below this region, indicating a possible breakout retest or a temporary pause before the next leg up.
🔸 Trendline Support
A new rising trendline has emerged post-breakout, acting as dynamic support.
Price has respected this trendline multiple times, forming higher highs and higher lows — a strong bullish signal.
🔸 SR Interchange Zone (~ GETTEX:92K –$94K)
Previously acted as resistance; now flipped to support.
This makes it a critical level where bulls may defend positions, and a good place for a stop-loss.
🔸 Support Zone (~$75K–$78K)
Major historical support area where the wedge bottom formed.
Buyers stepped in aggressively in this zone during the final leg of the wedge.
🎯 Trade Plan
This setup offers a clearly defined risk-reward profile based on breakout trading principles.
📌 Entry Idea:
Current consolidation near resistance offers two entry strategies:
Aggressive Entry: Near current price, anticipating breakout continuation.
Conservative Entry: On a confirmed breakout above $105K or a pullback to trendline support around GETTEX:98K –$100K.
✅ Target: $112,116
Measured by projecting the height of the wedge from the breakout point.
Also aligns with a previous key structural high, adding confluence to the target.
⛔ Stop Loss: $93,294
Strategically placed just below the SR interchange zone and rising trendline.
Protects against potential fakeouts or trendline breaks.
📉 Risk Management
Risk/Reward Ratio: ~2:1 or higher depending on entry point.
Always use proper position sizing.
Be prepared to cut the trade if price closes below trendline and SR zone on high volume.
🔮 Outlook and Strategy
This breakout suggests Bitcoin may be entering a renewed bullish phase. If macro conditions remain favorable and price sustains above key support zones, we could see continuation toward the $112K region.
However, it’s important to monitor:
Volume: Watch for rising volume on any breakout above the resistance zone.
Market Sentiment: External factors (e.g., news, ETF flows, regulatory updates) may influence the move.
Trendline behavior: A break and close below the rising support line may invalidate the setup.
💬 Final Thoughts
This is a technically clean setup combining a bullish pattern breakout, supportive structure (trendline & SR zones), and a logical target based on classical charting. If Bitcoin maintains current momentum, traders may see significant upside in the coming weeks.

$PENG Trade Setup (4H Chaat)NASDAQ:PENG Trade Setup (4H Chart)
- Entry: 0.0123 – 0.0125
- Stop Loss: 0.0110
- Target: 0.0168
Structure: Trendline bounce + bullish reaction
Bias: Bullish continuation
Clean bounce from ascending trendline support, watching for strong upside follow-through!
DYRO, NFA
