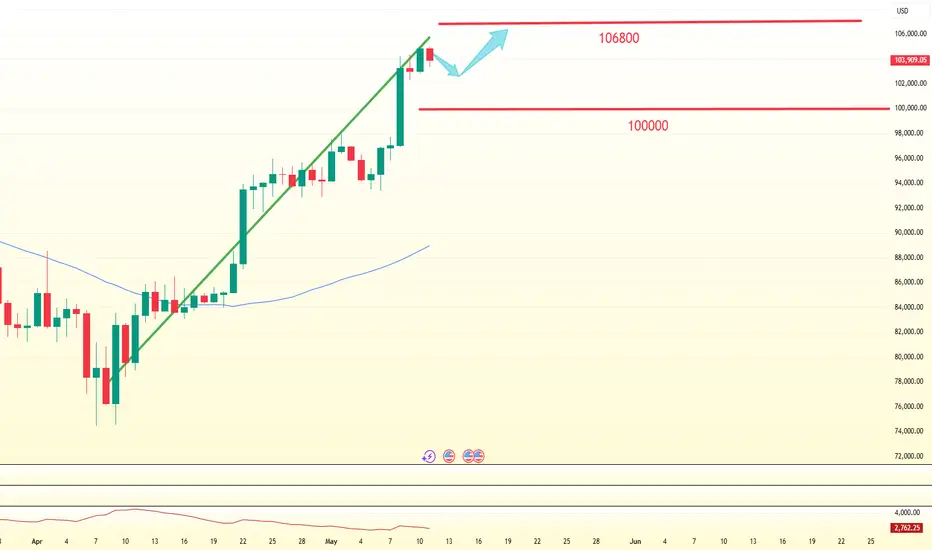
The latest Bitcoin analysis strategyThe price has rebounded above the 0.786 Fibonacci retracement support level at $102,400. The EMA trend indicators show upward divergence, with the EMA15 fast trend line continuing to act as support and extending higher, expected to provide underlying support for the candlesticks near $101,000. A bullish channel has formed on the Bollinger Bands, but the price is 受阻 (resisted) at the upper band pressure level of $106,300, increasing the probability of short-term sideways trading.
Candlestick patterns indicate the price has consistently traded at the top of the EMA trend indicators, with bullish momentum starting to contract and top-side pressure showing a clear downward shift. The MACD has continuously reduced trading volume while approaching the zero line, with DIF and DEA converging, signaling that a top divergence pattern has spread to the medium-term trend. During the Bollinger Bands' sideways phase, the upper band resistance is at $105,200, and the lower band support is at $101,800.
The latest U.S. inflation data came in below expectations, strengthening market expectations for Federal Reserve rate cuts—a factor typically boosting risk asset performance. Additionally, the initial progress in U.S.-China trade negotiations, where both sides agreed to reduce tariffs, has improved geopolitical conditions and provided further support for Bitcoin.
you are currently struggling with losses, or are unsure which of the numerous trading strategies to follow, at this moment, you can choose to observe the operations within our channel.
Btcusdlong

BTC Bullish Pennant Breakout – Eyeing $107K TargetBitcoin (BTC/USD) has recently demonstrated strong bullish structure following an extended consolidation phase. The current price action suggests a textbook bullish pennant breakout, which often indicates trend continuation in strong markets. This technical setup follows a period of accumulation and consolidation between March and April, with a well-defined pennant formation leading into the breakout in early May.
Technical Analysis:
Historical Context & Structure:
From mid-February to March, BTC experienced significant downward pressure, eventually finding major support in the $76,000–$78,000 zone, which is clearly outlined on the chart as a key support level.
This support zone initiated a reversal, forming the base of a new bullish leg that marked the beginning of the next trending phase.
Consolidation Phase – The Ellipse Region:
The price action within the elliptical region (mid-March to late April) reflects accumulation behavior, with multiple rejections on both upper and lower bounds, indicating balance between buyers and sellers.
This phase formed a foundational structure, setting up the stage for a breakout pattern.
Pennant Formation (Late April – Early May):
The price sharply rallied in late April, breaking out of the consolidation and moving into a tight triangular pennant pattern — a classic continuation formation.
This bullish pennant features converging trendlines, lower volume, and diminishing volatility as price consolidates — all typical characteristics.
Breakout and Retest:
The breakout from the pennant occurred on high momentum with strong bullish candles.
Post-breakout, the price approached the resistance zone (~$103,000–$105,000) and is currently attempting to establish support at this level.
This retest adds validity to the breakout and opens the door for further upside continuation.
Trade Parameters:
Entry Zone: Breakout above the pennant (~$99,000–$100,000), confirmed by momentum.
Resistance Zone: $103,000–$105,000 (currently being retested).
Target (Measured Move):
Using the height of the pennant pole (~$20,000 move from $80K to $100K), the projected target lies near $107,307, aligning with horizontal resistance.
Stop Loss:
Set at $93,344, just below the pennant’s lower boundary. This level also aligns with recent structural support and invalidation of the pattern.
Risk/Reward Ratio:
Approx. 1:2.5+, offering a favorable setup assuming trend continuation.
Additional Notes:
Volume:
Although not shown, breakouts from pennants are ideally confirmed by an increase in volume, indicating market conviction. Volume confirmation is highly recommended for trade confirmation.
Market Context:
This setup aligns with broader bullish sentiment in the crypto space and may be reinforced by macroeconomic or ETF-related developments. However, risk management remains key, especially around psychological levels and news-driven volatility.
Conclusion :
Bitcoin is currently in a strong technical position. The breakout from the bullish pennant pattern following prolonged consolidation signals continuation of the prevailing uptrend. Traders should watch for sustained price action above $103K for confirmation. A pullback or retest toward this level can present re-entry opportunities before a potential move toward $107K. Tight risk management is advised with stops below $93K.

Bitcoin is expected to maintain its upward trend throughout nextAgainst the backdrop of an unstable global macro and geopolitical environment, the resilience of Bitcoin will continue to be tested. The escalating geopolitical tensions between India and Pakistan pose a risk of evolving into a full-scale conflict. Meanwhile, the Federal Reserve finds itself in a dilemma between employment and inflation and has no immediate intention of cutting interest rates. Although the Trump administration's tough rhetoric on tariffs has somewhat softened, the market is still awaiting a clear direction for its trade policy. Based on these factors, it is expected that Bitcoin is likely to continue to fluctuate within the range of $70,000 to $109,000 in the coming two months.
you are currently struggling with losses, or are unsure which of the numerous trading strategies to follow, at this moment, you can choose to observe the operations within our channel.
BITCOIN ( Is this the final DIP ? )I bought the dip but it just keeps dipping!
it's time to put on my bear glasses and check this ponzi chart !! oh yeah
As you can see in these patterns the moments everyone ready for breakout, bitcoin dumps to another lower level and kills all hopium that moonboyz, frog army and GM gurus got
if you think that you are person who manage to buy the exact number at dip you are wrong too, like people who bought at 60k and had plan to sell at 90k
RSI looks bearish like the pattern , I start shorting at 17490 and not going to close it till 16950$
If you got crypto on Huobi and Gemini exchange watch out too
funds are NOT safu

Bullish Continuation SetupThe price of Bitcoin fluctuated sharply on May 7 and showed an upward trend, once approaching $98,000. The overall market is in a strong bullish state, but potential risks brought by a top divergence need to be watched out for. In terms of capital flow, although there is a lack of a large amount of new capital inflow, the increase in holdings by existing holders has driven the price up. If the price can hold firm at $96,000 and continue to rise, the bulls will keep pushing up, and there is hope for further upward space. If it fails to break through the pressure level of the middle band of the Bollinger Bands at $97,650, the bulls may consider taking profits, and the price is likely to return to the trading range for adjustment. The key support level below is in the range of $94,000 - $94,500. If this range is broken, there may be a further decline to $93,000 or even lower.
you are currently struggling with losses, or are unsure which of the numerous trading strategies to follow, at this moment, you can choose to observe the operations within our channel.

Analysis of the Latest SignalsThe advancement of the Bitcoin Reserve Bill in many US states, such as Arizona's plan to allocate 10% of state assets to BTC, combined with the discussion on the regulatory framework at the White House Crypto Summit, may make policy clarity a catalyst for future market conditions. The market is watching this week's FOMC decision. If the rate - cut expectation heats up, it may promote the recovery of Bitcoin liquidity.
you are currently struggling with losses, or are unsure which of the numerous trading strategies to follow, at this moment, you can choose to observe the operations within our channel.
Trading Strategy:
buy@93500-94000
TP:95500-96000

multiple positive factorsDriven by multiple positive factors, including institutional funds inflow, the halving cycle, and the development of the Middle East market, as well as a breakthrough in the technical aspects, Bitcoin has a relatively high probability of surging towards the $100,000 mark in May.
Trading Strategy:
buy@94500-95500
TP:97500-98500

Analysis of the Price Trend of BitcoinAnalysis of the Bitcoin Price Trend: The upward trend is derived from the Weekly Moving Average Convergence Divergence (MACD) indicator. When the yellow and white lines of the MACD return to the zero axis and simultaneously touch the 52-period Exponential Moving Average (EMA52) line, there is a high probability that there will be no problem for the price to reach 100,000 (currency unit).

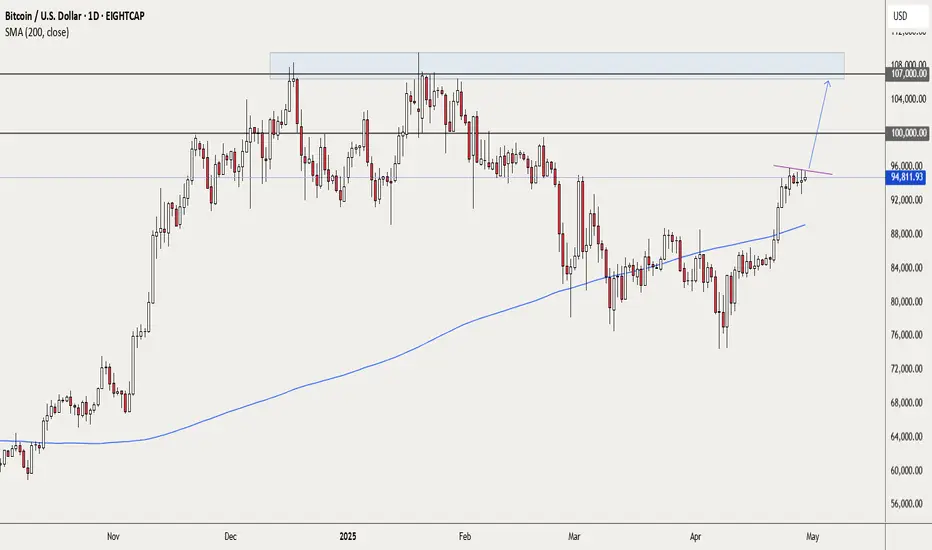
BTCUSD - best to wait a bit for a possible breakoutIf you are not already long on BTC, I would suggest exercising some patience. As my trendline indicates, we have had a few recent attempts to break higher. We have no idea if we will get that breakout or will price decline again. My approach would be to wait for a daily candle that closes above the trendline.
If that happens, I would place a pending long trade above the high of that breakout candle, stop placement below the recent swing low and 1st target at the round number 100,000.
Depending on the price action, a second target around 107,000 also looks possible.
This is not a trade recommendation; it’s merely my own analysis. Trading carries a high level of risk, so only trade with money you can afford to lose and carefully manage your capital and risk. If you like my idea, please give a “boost” and follow me to get even more. Please comment and share your thoughts too!!
It’s not whether you are right or wrong, but how much money you make when you are right and how much you lose when you are wrong – George Soros
BTCUSD 4 - Hour Chart Market AnalysisBTCUSD 4 - Hour Chart Market Analysis
I. Trends and Patterns 📈
Looking at the 4 - hour chart, the recent performance of BTCUSD has been characterized by complex fluctuations. In the earlier stage, there was a consolidation phase where the price oscillated within a relatively narrow range, forming a roughly rectangular consolidation pattern 📊. During this period, the forces of bulls and bears were relatively balanced 🤝, and the market was in a wait - and - see mode 🕵️. Subsequently, the price broke above this consolidation range and moved upward, indicating that the bulls had taken the upper hand 🐂, driving the price to gradually climb ⬆️.
Currently, the price is in an ascending wedge pattern, a common technical pattern. An ascending wedge is generally regarded as a reversal pattern. In an uptrend, although the price continues to reach new highs, the upward slope gradually flattens, suggesting that the bullish momentum is weakening while the bearish momentum is accumulating 🐻.
II. Key Support and Resistance Levels 📌
Support Levels
93000: This is a crucial support level, located near the lower trend - line of the ascending wedge and also a key low point during previous pullbacks. If the price moves downward, this level is likely to provide strong support. A break below this level may trigger further declines ⚠️.
91500: It is the upper edge of the previous consolidation range. If the price experiences a significant drop, this level may prevent the price from falling further sharply 🛑.
86000: It is the lower edge of the previous consolidation range. If the price continues to decline, this will be an important support line. A break below it may open up a larger downside space 📉.
Resistance Levels
96000: This is the resistance level near the upper trend - line of the current ascending wedge. The price has tested this area several times but failed to break through effectively, indicating strong selling pressure at this level 💥.
97500: It is a higher - level resistance target. If the price can strongly break through the 96000 resistance level and continue to rise, it may test this level 🎯.
⚡⚡⚡ BTCUSD ⚡⚡⚡
🚀 Sell@95000 - 94500
🚀 TP 93000 - 92000
🚀 Buy@92000 - 93000
🚀 TP 95000 - 96000
Accurate signals are updated every day 📈 If you encounter any problems during trading, these signals can serve as your reliable guide 🧭 Feel free to refer to them! I sincerely hope they'll be of great help to you 🌟

Choose your Side- i often compare TheKing with Nasdaq right now.
- Have a main reason :
- NAS100 (Nasdaq) have mostly "Top Tech Companies" acting as Thermometers in this index.
- SPX (SP500) have Tech Companies + traditional ones. Nasdaq Companies are also included in SPX, but 500 Companies start to be a lot.
- DJIA (Dow Jones Industrial Average) is a Mastodons, i don't use it much because this top 30 is too mixed ( coca cola, boeing, techs, big banks, nike.. etc).
- i mostly use very high TFs, i prefer look from far, less noise, more easy and less headaches.
- i use sometimes to trade with 1D, H12, H4 TFs but when we are bullish. In bearmarket, it's hard to find entries points in bearish mode.
- i don't short markets and accumulate more coins/tokens, so i just DCA, Dollar Cost Averaging is investing a fixed amount of money into a particular investment at regular intervals.
- so this chart is basically only about MACD :
- it's really interesting to see Nasdaq making another red columns in 3W TF, while the markets should recover slowly.
- if you take a look at BTC, columns stayed in Light Red Color and reducing size.
What could it means ?
- Keep in mind that BTC is not a STOCK.
- One of the most pivotal events on Bitcoin's blockchain is the halving, when the supply of new bitcoins is cut in half (2024).
- BTC have 21M Supplies and that's all. no more will be created.
- At any time BTC could stop to follow Nasdaq and do his way, TheKing used to do that before already.
- A small bounce in Nasdaq could be also a huge move for BTC.
- " Choose your side " and DCA the money you don't need for living.
Happy Tr4Ding !

The Road to The Mooni like to make some graphs like that when peoples are in Dispair mode.
- i used a modified ADX indicator with a Monthly Timeframe ( thanks to the creator by the way )
- Look at the Mountains and tell me when in past bullruns we stopped at 100 ? - Never -
- The Highest Point is 160+
That said my advice for now is : " You don't really care if TheKing will back to 20k, what you have to care is the Highest point TheKing will reach! "
- Don't Think it's the end of this bullrun
- Don't Listen Fuders
- Use indicators for the Long Term
- Believe in Trends and cycles movements
- Believe in the future of cryptos
- Believe in TheKing because Theking cannot die.
Happy Tr4Ding !

Gold vs. Bitcoin...Will History Repeat?The chart does majority of the talking here, there isn't too much I feel I have to write.
Both assets are following similar pricing models that we have seen in the markets before.
What do you think Bitcoin is going to do?

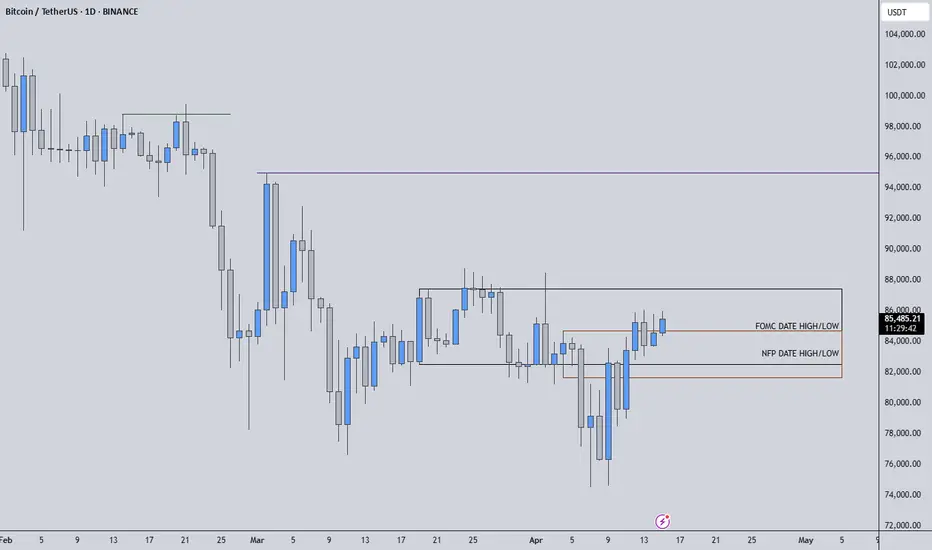
BTCUSDT | FOMC & NFP Highs and Lows as Critical Pivot LevelsThis current structure on Bitcoin is giving us a beautiful narrative rooted in macro timing: we've regained the NFP day levels, and now we’re trading right inside the highs and lows of the FOMC date—a zone that historically acts as a decision-making pivot for the market.
📍 Why These Levels Matter:
NFP and FOMC sessions are not just about volatility—they often define institutional positioning and sentiment shifts.
We’ve already regained NFP day's range, showing bullish resilience and strength.
Now all eyes are on the FOMC range: if we manage to break and retest the high of the FOMC candle, it can ignite momentum toward the monthly target.
🧠 How I’m Thinking About It:
I’m not jumping the gun. I’ll wait for lower time frame confirmations, ideally some clean breaks with supportive delta and CDV structure.
If we fail to hold these levels and fall back inside, I won’t insist on any long idea. I’ll flip short the moment downside momentum is confirmed.
💬 Final Thought: We don't randomly mark levels. These are deliberately chosen based on price behavior during major economic events—something most traders overlook. That’s what gives us the edge. If you're following me, you're not trading noise. You're learning to understand the story behind price action.
Watch these levels closely. They may be the starting point of something much bigger.
📌I keep my charts clean and simple because I believe clarity leads to better decisions.
📌My approach is built on years of experience and a solid track record. I don’t claim to know it all but I’m confident in my ability to spot high-probability setups.
📌If you would like to learn how to use the heatmap, cumulative volume delta and volume footprint techniques that I use below to determine very accurate demand regions, you can send me a private message. I help anyone who wants it completely free of charge.
🔑I have a long list of my proven technique below:
🎯 ZENUSDT.P: Patience & Profitability | %230 Reaction from the Sniper Entry
🐶 DOGEUSDT.P: Next Move
🎨 RENDERUSDT.P: Opportunity of the Month
💎 ETHUSDT.P: Where to Retrace
🟢 BNBUSDT.P: Potential Surge
📊 BTC Dominance: Reaction Zone
🌊 WAVESUSDT.P: Demand Zone Potential
🟣 UNIUSDT.P: Long-Term Trade
🔵 XRPUSDT.P: Entry Zones
🔗 LINKUSDT.P: Follow The River
📈 BTCUSDT.P: Two Key Demand Zones
🟩 POLUSDT: Bullish Momentum
🌟 PENDLEUSDT.P: Where Opportunity Meets Precision
🔥 BTCUSDT.P: Liquidation of Highly Leveraged Longs
🌊 SOLUSDT.P: SOL's Dip - Your Opportunity
🐸 1000PEPEUSDT.P: Prime Bounce Zone Unlocked
🚀 ETHUSDT.P: Set to Explode - Don't Miss This Game Changer
🤖 IQUSDT: Smart Plan
⚡️ PONDUSDT: A Trade Not Taken Is Better Than a Losing One
💼 STMXUSDT: 2 Buying Areas
🐢 TURBOUSDT: Buy Zones and Buyer Presence
🌍 ICPUSDT.P: Massive Upside Potential | Check the Trade Update For Seeing Results
🟠 IDEXUSDT: Spot Buy Area | %26 Profit if You Trade with MSB
📌 USUALUSDT: Buyers Are Active + %70 Profit in Total
🌟 FORTHUSDT: Sniper Entry +%26 Reaction
🐳 QKCUSDT: Sniper Entry +%57 Reaction
📊 BTC.D: Retest of Key Area Highly Likely
📊 XNOUSDT %80 Reaction with a Simple Blue Box!
📊 BELUSDT Amazing %120 Reaction!
I stopped adding to the list because it's kinda tiring to add 5-10 charts in every move but you can check my profile and see that it goes on..
btcusd on bearis reverse above 86170#BTCUSD on bearish above 86170, price needs to move above there before sell reverse will occur.
Above 86170 holds bearish reverse which will drop the coin below 84264, stop loss at 87300.
No possible bullish yet, unless the third pattern is broken.

At present, a selling phenomenon has emergedAt present, a selling phenomenon has emerged😰, and a large number of traders are waiting for the market to open⏰.
When other markets open on Monday, the situation of a large amount of capital flowing out to other trading fields also deserves attention. 😟
Especially the flows to the XAU/USD and USOIL markets, or other foreign exchange markets. 💱 The movement of funds to these areas might be influenced by economic news, geopolitical events, or simply portfolio re - balancing by investors. 📰
💰💰💰 BTCUSD 💰💰💰
💰💰💰 BTCUSD 💰💰💰
🎯 Sell@84000 - 84500
🎯 TP 82500 - 81500
Recently, the market has been extremely volatile 😱, which has led to the clearing of many traders' accounts or significant losses 😫. You can follow my signals and gradually recover your losses and achieve profitability 🌟💪.
Traders, if you're fond of this perspective or have your own insights regarding it, feel free to share in the comments. I'm really looking forward to reading your thoughts! 🤗

BTCUSD Daily Trend Analysis is BullishAccording to my momentum analysis, BTCUSD confirmed Bullish trend on April 12, 2025 with entry price at 83624 and stop-loss at 74373. It is likely to continue the trend till 91980 and if breaks and closes above 91980, there is a possibility of hitting the target at 102754.

Thu 10th Apr 2025 BTC/USD Daily Forex Chart Buy SetupGood morning fellow traders. On my Daily Forex charts using the High Probability & Divergence trading methods from my books, I have identified a new trade setup this morning. As usual, you can read my notes on the chart for my thoughts on this setup. The trade being a BTC/USD Buy. Enjoy the day all. Cheers. Jim

BTCUSD LONG Rebound BTCUSD Rebound until 78.60 Fibbonacci level and after that sell until 1h orderblock downside.

BTC/USD Weekly Analysis – Cup and Handle Breakout Toward Target🔍 Overview
The chart displays a classic Cup and Handle pattern on the weekly timeframe, a well-established bullish continuation formation often found in long-term uptrends. This pattern, combined with major technical confluences such as trendline support and strong horizontal levels, provides a high-conviction long setup with defined risk and reward.
☕ 1. The Cup Formation
Timeframe: Mid-2021 to early 2024
Shape: Rounded bottom, a hallmark of slow accumulation.
After reaching an all-time high in late 2021, BTC entered a bear market, dropping sharply and eventually bottoming out between $15,000–$20,000.
A gradual recovery followed, forming a wide and symmetrical base—indicating accumulation by institutional and long-term holders.
This phase represents a shift in market sentiment, from bearish to neutral, and eventually bullish, as buyers stepped in around key demand zones.
🔧 2. The Handle Formation
Timeframe: Early 2024 to late 2024
After reclaiming its previous high resistance area near $69,000–$75,000, BTC formed a short-term consolidation or pullback, creating the "handle" portion of the pattern.
The handle appeared as a descending channel, a healthy correction that typically precedes a breakout in this pattern.
This correction also aligned with a trendline retest, offering dynamic support and further strengthening the pattern's reliability.
💥 3. Breakout Confirmation
The breakout from the handle occurred above the descending resistance of the handle pattern.
Weekly candles showed strong bullish momentum, backed by rising volume and rejection from lower trendline levels.
BTC is now trading near $83,000, just above the trendline, confirming both pattern validation and support holding.
🎯 4. Target & Projection
The measured move of the Cup and Handle pattern is calculated by measuring the depth of the cup and projecting that from the breakout point.
Cup Depth: Approximately $60,000
Breakout Point: ~$75,000–$80,000
Target Price: ~$123,000–$125,000
This target aligns with historical Fibonacci extensions and psychological round-number resistance.
🔐 5. Key Levels
Support Zone: $20,000–$30,000 (multi-year accumulation base)
Trendline Support: Drawn from 2022 lows, holding well through handle correction
Resistance Zone: $100,000 psychological barrier
Stop Loss: Placed just below trendline and swing low at $76,340 to protect against downside volatility
🧠 Why This Setup is Strong
Multi-year Base Formation (2.5+ years of consolidation)
Pattern Reliability: Cup and Handle is a well-tested bullish continuation pattern
Confluence of Support: Both horizontal and dynamic trendline support levels
Momentum Structure: BTC has resumed higher highs and higher lows
Volume: Breakout occurred with a noticeable spike in volume, a key validation point
🏁 Conclusion
Bitcoin is displaying strong bullish potential through a large-scale Cup and Handle pattern. This technical setup is supported by:
Long-term accumulation
Structural breakout
Strong support levels
A clear roadmap toward $120K+ targets
As long as BTC maintains above the trendline and doesn't invalidate the handle's structure, the bulls remain firmly in control.

BTCUSDT BuyBitcoin is ready to start uptrend and retest 93k level. Stop area is 77k. Consolidation between 82 - 93 levels is still active.

BTC/USD Bullish Breakout from Rectangle PatternOverview:
The chart represents Bitcoin's price action against the US Dollar on the 1-hour timeframe, highlighting a Rectangle Pattern Breakout with a well-structured trade setup. This analysis will break down the pattern, key levels, and possible trading scenarios.
1️⃣ Chart Pattern Breakdown – Rectangle Consolidation
The price has been moving within a rectangle pattern (range-bound movement), where Bitcoin found support at lower levels and faced resistance at the upper boundary.
Rectangle Pattern: A continuation/consolidation pattern where price fluctuates between horizontal resistance and support before breaking out.
Curve Formation: The price action within the rectangle also forms a rounding bottom, indicating a potential shift from bearish to bullish sentiment.
Breakout Confirmation: BTC has broken out from the rectangle, suggesting bullish momentum.
2️⃣ Key Technical Levels
🔹 Support Level ($84,110)
This zone has acted as a strong demand area, preventing the price from falling further.
Buyers consistently stepped in at this level, making it a significant psychological floor for Bitcoin.
🔹 Resistance Level ($86,850 - $87,000 Zone)
This level had previously rejected upward movements, leading to multiple price pullbacks.
After the breakout, this area is expected to act as a new support level upon a retest.
🔹 Target Price ($89,931 – Next Resistance Zone)
If the breakout sustains, the next key target for bulls is around $89,931, based on prior resistance zones and technical projections.
🔹 Stop Loss ($84,110 – Below Support Zone)
A stop loss below the support zone ensures risk management in case of a false breakout.
3️⃣ Trading Strategy & Execution
📌 Entry Point – After price confirms the breakout above the rectangle’s resistance. Traders should wait for:
A pullback and retest of the broken resistance, which should now act as support.
A strong bullish candle confirming continuation.
📌 Take Profit (TP) – $89,931, based on historical resistance levels and price projection from the rectangle range.
📌 Stop Loss (SL) – Placed at $84,110, below the rectangle’s previous support zone to minimize downside risk.
📌 Risk-to-Reward Ratio (RRR) – The setup offers a favorable RRR, meaning potential profits outweigh the risks.
4️⃣ Market Sentiment & Additional Factors
✔ Bullish Outlook – The breakout signals strong buying interest and potential upside continuation.
✔ Volume Confirmation – Traders should monitor volume spikes during the breakout to confirm institutional participation.
✔ Economic Events & News – External factors like macroeconomic data or Bitcoin-related news can impact price action.
Conclusion – BTC/USD Trading Setup
Pattern Identified: Rectangle Pattern Breakout
Current Trend: Bullish breakout from consolidation
Trade Type: Long position (Buy setup)
Key Levels:
✅ Support: $84,110
✅ Resistance: $86,850 - $87,000
✅ Target: $89,931
✅ Stop Loss: $84,110
🔥 Final Thought : Bitcoin has broken out of a key consolidation range, signaling a bullish move towards $89,931. Traders should wait for confirmation and manage risk accordingly! 🚀📈

BTC @ ~$100k == GOLD @ ~$1kGold is always a good fractal to use for projecting Bitcoin.
Gold price action around the MIL:1K area is very similar to what we are seeing on BTC currently.
Flip $90k to support and it's go time for BTC.
1st target is ~$200k.
-@CryptoCurb
