BTC Consolidates 104000-105000: Bearish Breakdown Looming?BTC Technical Update: Bitcoin has been consolidating within the 104000-105000 range for an extended period, with the overall trend showing a downward bias. With the overall trend tilting bearish, traders should watch for a break below 103500 to confirm the next leg down. 📉
⚡️⚡️⚡️ BTCUSD ⚡️⚡️⚡️
🚀 Sell@ 105000 - 104500
🚀 TP 102500 - 101500
Accurate signals are updated every day 📈 If you encounter any problems during trading, these signals can serve as your reliable guide 🧭 Feel free to refer to them! I sincerely hope they'll be of great help to you 🌟 👇
Btcusdsell

Current BTC Trend Analysis and Trading RecommendationsToday, U.S. markets are closed, leading to light trading activity and relatively limited overall market volatility. From a technical analysis perspective, the 4-hour K-line chart currently shows prices trading below the middle band of the Bollinger Bands, exhibiting a classic range-bound consolidation pattern. Bulls and bears are locked in a tug-of-war between key support and resistance levels, with K-line formations alternating between bullish and bearish patterns.
In terms of chart structure, the lower support zone has demonstrated strong buying conviction, while the upper resistance level has exerted clear restrictive force. Multiple failed upward breakouts have formed a short-term top. This box consolidation—characterized by resistance above and support below—is expected to sustain sideways trading through Friday.
Against the backdrop of no major positive catalysts, bearish momentum may gradually dominate if no substantial bullish triggers emerge. Maintain a trading strategy of selling into strength.
BTCUSD
105000-105500
tp:104000-103000
Investment itself is not the source of risk; it is only when investment behavior escapes rational control that risks lie in wait. In the trading process, always bear in mind that restraining impulsiveness is the primary criterion for success. I share trading signals daily, and all signals have been accurate without error for a full month. Regardless of your past profits or losses, with my assistance, you have the hope to achieve a breakthrough in your investment.

BTCUSD Analysis UpdateBTC/USD Analysis Update 📈
Bitcoin has rebounded successfully after touching the 103500 support level and is currently trading around 105500. However, the ongoing correction may continue to test the psychological support at the 100000 round number in the short term ⚠️.
Key Points:
Support Bounce 🎯: BTC found buying interest at 103500, in line with our previous strategic analysis.
Immediate Resistance 📉: The current rebound faces direct resistance near 106000 (200-hour moving average).
Downside Risk 📉: Failure to hold above 105000 could trigger another decline toward 100000.
Risk Management:
Long positions should set stop-loss below 103000 ⛔️.
Short entries may consider the 106000–107000 range, targeting 102500 and 100000
⚡️⚡️⚡️ BTCUSD ⚡️⚡️⚡️
🚀 Buy@ 102500 - 103500
🚀 TP 106000 - 106500
🚀 Sell@ 106000 - 106500
🚀 TP 103500 - 101500
Accurate signals are updated every day 📈 If you encounter any problems during trading, these signals can serve as your reliable guide 🧭 Feel free to refer to them! I sincerely hope they'll be of great help to you 🌟 👇

Current BTC Trend Analysis and Trading RecommendationsThe daily candlestick chart of BTC shows a three - day consecutive bearish retracement, having fallen back to the vicinity of the starting point of the previous pinbar rebound and currently remaining in a recent low - level sideways consolidation zone. However, the 4 - hour trend is pressured by the middle band of the Bollinger Bands, staying within a downward channel and forming a rebound - retracement wave pattern.
For short - term strategies, anticipate a further retracement first. Long positions should be initiated only after the support level is confirmed valid. This retracement represents a necessary consolidation phase before the bullish trend continues, and the current adjustment range does not pose a substantial threat of trend reversal to the overall uptrend. With the core upward trend intact and the direction remaining clear, BTC is expected to resume its upward momentum after a brief consolidation. The operational approach remains to go long on retracements.
BTCUSD
buy@103500-104000
tp:105500-106500
Investment itself is not the source of risk; it is only when investment behavior escapes rational control that risks lie in wait. In the trading process, always bear in mind that restraining impulsiveness is the primary criterion for success. I share trading signals daily, and all signals have been accurate without error for a full month. Regardless of your past profits or losses, with my assistance, you have the hope to achieve a breakthrough in your investment.

BTC Trend Analysis and Trading Recommendations for TodayThe BTC market continues its sideways-down trend, with notably insufficient rebound momentum during the session. Although there were brief signs of stabilization in the early trading, bearish forces continued to exert pressure during the European session, and the index showed a staircase decline.
From the 4-hour chart analysis, the price once fell to touch the middle Bollinger Band support during the Asian session, followed by a technical rebound. However, the rebound strength was obviously weak, encountering strong resistance near the middle band. The current candlestick pattern presents a typical Dark Cloud Cover, the MACD indicator continues to release volume below the zero axis, with fast and slow lines in bearish alignment.
Technically, the price remains significantly pressured near the middle band, and the US session is likely to extend the existing downtrend. Investors are advised to maintain a bearish stance. If the price effectively breaks below the middle band support, the next target is targeted at the lower Bollinger Band. Strategically, fading rallies remains the preferred approach.
BTCUSD
sell@106500-106000
tp:105000-104000

Middle East Tensions Drive Capital Shift: BTC May Test 100K SupCurrently, we can clearly see that BTC is in a downward trend 🔻. Due to the tense situation in the Middle East 😰, a large amount of capital has flowed into gold and crude oil markets. BTCUSD is likely to continue its downward movement on Monday ⬇️. Let's focus on the support level at 100,000. If it breaks below 100,000, it may continue to decline ⚠️.
⚡️⚡️⚡️ BTCUSD ⚡️⚡️⚡️
🚀 Sell@ 106500 - 105500
🚀 TP 102000 - 101000
Accurate signals are updated every day 📈 If you encounter any problems during trading, these signals can serve as your reliable guide 🧭 Feel free to refer to them! I sincerely hope they'll be of great help to you 🌟 👇

BTCUSDT Trend Analysis and Trading RecommendationsToday's overall BTC market rebounded after hitting a low of 102,614 in the early trading session, with Bitcoin's price maintaining a slow upward trend throughout the day. The intraday high reached 105,912 but encountered resistance. As the weekend approaches, historical market data shows limited volatility during weekends, so range-bound fluctuations are expected for the weekend.
From the current overall market rhythm, the price has rebounded slightly today after the previous decline. The hourly chart shows consecutive upward candles, though the price movement remains relatively slow. As time progresses, the price is expected to sustain an upward trend after pullbacks, and breaking through the short-term resistance level is only a matter of time. In terms of short-term structure and pattern, despite slight resistance and minor pullbacks, the downward momentum has weakened. We can still focus on long positions at lower levels, paying attention to the 106,000 resistance level.
BTCUSD
buy@104000-104500
tp:106000-107000
Investment itself is not the source of risk; it is only when investment behavior escapes rational control that risks lie in wait. In the trading process, always bear in mind that restraining impulsiveness is the primary criterion for success. I share trading signals daily, and all signals have been accurate without error for a full month. Regardless of your past profits or losses, with my assistance, you have the hope to achieve a breakthrough in your investment.

Current BTC Trend Analysis and Trading RecommendationsToday's overall BTC market rebounded after hitting a low of 102,614 in the early trading session, with Bitcoin's price maintaining a slow upward trend throughout the day. The intraday high reached 105,912 but encountered resistance. As the weekend approaches, historical market data shows limited volatility during weekends, so range-bound fluctuations are expected for the weekend.
From the current overall market rhythm, the price has rebounded slightly today after the previous decline. The hourly chart shows consecutive upward candles, though the price movement remains relatively slow. As time progresses, the price is expected to sustain an upward trend after pullbacks, and breaking through the short-term resistance level is only a matter of time. In terms of short-term structure and pattern, despite slight resistance and minor pullbacks, the downward momentum has weakened. We can still focus on long positions at lower levels, paying attention to the 106,000 resistance level.
BTCUSD
buy@104000-104500
tp:106000-107000
Investment itself is not the source of risk; it is only when investment behavior escapes rational control that risks lie in wait. In the trading process, always bear in mind that restraining impulsiveness is the primary criterion for success. I share trading signals daily, and all signals have been accurate without error for a full month. Regardless of your past profits or losses, with my assistance, you have the hope to achieve a breakthrough in your investment.

BTCUSD: Decoding the Price Action Through "Tape Reading"🚀 BTCUSD: Decoding the Price Action Through "Tape Reading" 🚀
Hey Traders,
Let's dive into a "tape reading" analysis of BTCUSD, breaking down the recent price movements and looking ahead. We've seen some fascinating patterns emerge, and understanding them could be key to our next moves.
🔍 A Look Back: The Bullish Flag Formations 🔍
Our journey begins on April 7th, 2025, with the establishment of a strong "Flag Pole" at $74,489.00. This was supported by a robust double bottom, setting the stage for what was to come.
First "Flag" Confirmation: We saw the first "Flag" form, confirmed by a powerful "Hammer" candle on April 20th, 2025. This Hammer, with its unique "bottom-less Marubozu" body, signaled significant underlying strength.
Second "Flag" Confirmation: Another "Flag" emerged, solidified by strong multi-day bottom support around $94,791.00. This resilience suggested continued upward momentum.
The Breakout: On May 8th, 2025, BTCUSD surged, breaking out of its previous patterns and entering a new "flag pole" formation.
Third "Flag" & All-Time High: May 15th, 2025, brought the third "Flag" formation, again supported by a "Hammer" and a bullish Marubozu. This momentum culminated in a breach of the $105,770.00 multi-month price level on May 20th, 2025, breaking the previous all-time high from December 17th, 2024! We then rocketed to a new all-time high of $112,000.
📉 Recent Developments: The Downtrend and Key Levels 📉
Since the all-time high, we've started to experience a shift:
Downtrend Begins: A downtrend initiated around May 22nd, 2025.
High-Low Formations: We observed a second high-low formation on May 27th, 2025, followed by another on June 9th, 2025.
Double Top & Hanging Man: A clear double top formation emerged, further supported by a "Hanging Man" candle on June 10th, 2025.
🔮 What's Next? The Critical Close 🔮
Today's candle close is absolutely paramount! As of now, the candle is still forming, but my current read suggests a potential move to fill the wick of the June 13th, 2025, "Hammer" candle.
The direction BTCUSD takes – North or South – will largely be dictated by how today's candle closes. This will be our prime dominant signal.
Monthly Candle Perspective:
Interestingly, the Monthly candle is showing similar "Flag" patterns. Check out the chart here for a broader perspective:
Let me know your thoughts in the comments below! Are you seeing the same patterns?
Trade safe!
_________________________________________________________________________________
⚠️ Disclaimer: This post is educational content and does not constitute investment advice, financial advice, or trading recommendations. The views expressed here are based on technical analysis and are shared solely for informational purposes. The stock market is subject to risks, including capital loss, and readers should exercise due diligence before investing. We do not take responsibility for decisions made based on this content. Consult a certified financial advisor for personalized guidance.

Evening BTC Trend Analysis and Trading RecommendationsDuring the morning session, the Bitcoin price continued its upward momentum from the previous night, surging to an intraday high of 110,653. Subsequently, as bullish momentum gradually waned, the price entered a volatile downward channel. Consecutive bearish candles triggered a significant retracement of earlier gains. In the afternoon, supported by the hourly moving average, Bitcoin saw a brief rebound, climbing to 109,852 as U.S. stocks opened. However, bears quickly regained control, pushing the price down to 108,282 before stabilizing, after which it entered horizontal consolidation. The current price remains around 109,000. Notably, our previous short strategy at 109,800 precisely aligned with the trend, successfully realizing the expected profit.
Current trading advice: Consider light short positions within 109,400–109,700, targeting around 108,500. If the price effectively holds support and stabilizes at 108,500, you may attempt light long positions to speculate on a rebound.
BTCUSD
sell@109400-109700
tp:108500-107500

Analysis of the Current BTCUSD Trend and Trading RecommendationsFrom a technical perspective, the bearish trend in BTC is temporarily dominant. On the four-hour chart, the price has trended downward with consecutive negative candles after being pressured, clearly indicating a bearish trend. Although small lower shadows suggest that bulls and bears are still locked in a tug-of-war, the RSI indicator is near the overbought zone at 70, and while the MACD remains positive, its momentum continues to weaken—both signals imply insufficient upward momentum and lingering adjustment pressure.
On the hourly chart, BTC has entered a consolidation phase with alternating positive and negative candles after a unilateral downward move. Currently, the Bollinger Bands are narrowing and moving sideways, indicating that future volatility may be limited. The price is now hovering near the upper band of the range, facing technical resistance.
In terms of the afternoon trading strategy, given the bearish dominance and fading upward momentum, the focus should remain on shorting at highs. Aggressive traders can lightly position for short-term rebounds but must use small positions and set strict stop-losses; prudent traders should wait patiently for higher levels to initiate short positions.
BTCUSD
sell@109800-110300
tp:108500-107500
Investment itself is not the source of risk; it is only when investment behavior escapes rational control that risks lie in wait. In the trading process, always bear in mind that restraining impulsiveness is the primary criterion for success. I share trading signals daily, and all signals have been accurate without error for a full month. Regardless of your past profits or losses, with my assistance, you have the hope to achieve a breakthrough in your investment.

Shorting Opportunity EmergesBTC has seen significant volatility recently. 📊 After failing to break below 100,000 yesterday, it rebounded sharply to 108,500 immediately. ⚡ Now is precisely the opportunity to go short. 📉
⚡️⚡️⚡️ BTCUSD ⚡️⚡️⚡️
🚀 Sell@ 109000 - 108500
🚀 TP 105000 - 103000
Accurate signals are updated every day 📈 If you encounter any problems during trading, these signals can serve as your reliable guide 🧭 Feel free to refer to them! I sincerely hope they'll be of great help to you 🌟 👇

Gold Surges, Euro Plunges, BTC at RiskOn May 23rd's U.S. session, Trump's EU/Apple tariff plans sparked market chaos:
Gold surged 💥 as a safe haven.
The euro plunged on EU tariff fears.
If tariffs persist, capital may flood into gold/forex, likely triggering a BTC crash.
⚡⚡⚡ BTCUSD ⚡⚡⚡
🚀 Sell@109500 - 108500
🚀 T P 106500 - 104500
👇Accurate signals are updated every day 📈 If you encounter any problems during trading, these signals can serve as your reliable guide 🧭 Feel free to refer to them! I sincerely hope they'll be of great help to you 👇
Bitcoin (BTC/USD) – Rising Wedge Pattern Signals & BreakdownThis chart illustrates a Rising Wedge Pattern on the weekly timeframe for Bitcoin (BTC/USD), which is generally considered a bearish reversal pattern in technical analysis. The pattern appears after a strong upward move and typically signals that the price is losing momentum and may be preparing for a significant correction.
📐 What is a Rising Wedge Pattern?
A rising wedge is a chart pattern formed when the price consolidates between two upward-sloping trendlines – the support line (bottom) and the resistance line (top) – with the two lines converging toward each other.
As price climbs higher, it forms higher highs and higher lows.
However, the slope of the highs is less steep than the slope of the lows, showing a loss of bullish strength.
Eventually, the price breaks below the support line, often leading to a sharp move downward.
🔍 Key Highlights from the Chart:
📌 1. Major Resistance Zone (~$110K–$120K):
BTC is currently facing heavy resistance in this area.
This zone has historically acted as a supply zone where bulls have struggled to break through.
Multiple rejection wicks indicate strong selling pressure.
📌 2. Pattern Touchpoints:
BTC has now formed multiple touchpoints on both the support and resistance lines of the wedge, confirming the structure.
This gives the pattern higher validity from a technical analysis perspective.
📌 3. SR Interchange Zone (~$65K–$70K):
This is a key horizontal zone where past resistance could act as future support.
A successful breakdown may first test this level before continuation.
📌 4. Retesting After Breakdown:
After breaking the wedge support, a retest of the broken trendline is often seen.
If the retest is rejected, it confirms the breakdown and opens the door to deeper bearish movement.
🎯 Target Projection:
If the wedge breaks down and the bearish scenario plays out, we could see Bitcoin fall to the $22,000–$25,000 region – marked as the final target zone on the chart. This level aligns with:
Previous macro-support zones from 2021
Fibonacci retracement levels
Psychological price levels where buyers may re-enter
⚠️ Bearish Factors to Watch:
Bearish divergence on indicators like RSI or MACD (not shown on chart but worth checking)
Volume decreasing as price rises – a classic wedge behavior
Macroeconomic headwinds or Bitcoin halving-related exhaustion
Rejection from major resistance with strong bearish candles
🕒 Timeframe & Patience:
This is a weekly chart, which means the pattern will play out over weeks or months, not days. Patience is key. A clear break, retest, and rejection would be the most reliable confirmation to expect further downside.
✅ Invalidation Scenario:
If BTC breaks above the wedge resistance line with strong bullish volume and holds above the $120K level, this bearish thesis becomes invalid.
In that case, BTC could enter price discovery mode, making new all-time highs.
💬 Final Thoughts:
This analysis is a technical outlook, not financial advice. Always use stop-loss strategies and manage your risk carefully. Market sentiment, news, and macro factors can quickly shift the scenario. However, from a purely technical standpoint, the rising wedge pattern is a powerful signal that should not be ignored.

Trump Tariffs Risk Triggering BTC Crash as Capital Flows to GoldOn May 23rd's U.S. session, Trump's EU/Apple tariff plans sparked market chaos:
Gold surged 💥 as a safe haven.
The euro plunged on EU tariff fears.
If tariffs persist, capital may flood into gold/forex, likely triggering a BTC crash.
⚡⚡⚡ BTCUSD ⚡⚡⚡
🚀 Sell@110000 - 109000
🚀 TP 106500 - 104500
👇Accurate signals are updated every day 📈 If you encounter any problems during trading, these signals can serve as your reliable guide 🧭 Feel free to refer to them! I sincerely hope they'll be of great help to you 👇

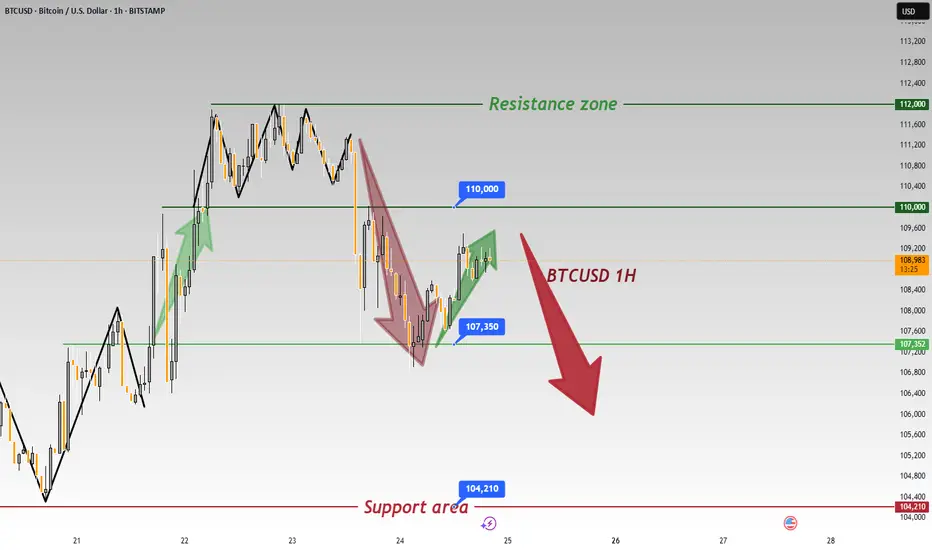
Bearish Reversal Confirmed – BTC Rising Wedge TrapBitcoin (BTCUSD) on the 1H timeframe is displaying a bearish reversal structure after failing to sustain a breakout above key resistance. The recent price action has formed a Rising Wedge Pattern, which typically precedes a downside correction, especially when formed near a key supply zone. Let’s break down the setup:
🔍 Technical Analysis Overview:
🔹 1. Rising Wedge Pattern (Bearish)
A rising wedge is visible near the top of the recent bullish impulse. This wedge is characterized by converging trendlines with higher highs and higher lows, but with diminishing momentum. It typically signals a weakening uptrend and a potential trend reversal or correction once price breaks below the lower wedge boundary.
The breakout to the downside has already begun, confirming bearish intent.
🔹 2. SR Interchange Zone
The blue zone marked in the chart represents a Support-Resistance Interchange (SR Flip). This was previously an area of consolidation and breakout, acting as a key decision zone. Price is expected to retest this zone after the wedge breakdown before continuing further down.
This creates a perfect "Break → Retest → Drop" scenario, often favored by institutional and swing traders.
🔹 3. Consolidation Structure
Before the wedge formation, Bitcoin was stuck in a prolonged consolidation phase. This type of ranging price action often accumulates orders before a breakout. Once broken, these zones serve as magnets for pullbacks or liquidity grabs, and are frequently retested.
🔹 4. Target Zone
The measured move from the rising wedge pattern points to a target near $101,617, which aligns with a previous structural low and a potential demand zone. This area could serve as the next major support level.
🎯 Trade Strategy & Setup:
Entry: After confirmation of breakdown and a clean retest of the SR zone.
Stop Loss (SL): Just above the wedge high and structural resistance (~$108,020).
Target (TP): $101,617 (downside projection based on wedge height and price structure).
📌 Risk-Reward Setup: 1:3+ possible if retest confirms.
🧠 Trader’s Insight:
This setup reflects a common smart-money behavior where price forms a bullish-looking structure (rising wedge), entices buyers, and then traps them with a swift breakdown. The SR retest provides a low-risk shorting opportunity. Patience is key — let price come to your level before entering.
🚨 Risk Note:
If BTC reclaims and holds above the $108,020 level, the bearish thesis may be invalidated. Always wait for confirmation before execution.

BTC Volatility Range Shifts Upward: Focus on Shorting The volatility range is moving upward, rising from 101,500–105,000 to 104,000–107,000 📈. It’s advisable to focus on shorting at higher levels ⏬. Currently, BTC is still in a range-bound fluctuation—just control your trade position sizes properly, and there won’t be any major issues essentially 😊!
⚡⚡⚡ BTCUSD ⚡⚡⚡
🚀 Sell@107000 - 106000
🚀 TP 104500 - 103500
👇Accurate signals are updated every day 📈 If you encounter any problems during trading, these signals can serve as your reliable guide 🧭 Feel free to refer to them! I sincerely hope they'll be of great help to you 👇

Bitcoin Short Setup –Supply Zone Rejection Trade Plan (1H Chart)(BTC/USD – Technical Setup)
🔵 Trend Setup:
⬆️ Resistance Line – Price is struggling to break above this level.
⬇️ Support Line – Price bounced several times here before breaking down.
🟢 EMA 70 – Currently around 104,435.9, acting as dynamic support/resistance.
📍 Key Levels:
🔴 Stop Loss Zone:
107,488.4 to 107,402.4
(🚨 Strong resistance, limit losses!)
🟡 Entry Point:
106,026.8
(🟨 Inside the Supply Zone – Ideal for Sell)
🟦 Supply Zone:
106,026.8 to 107,402.4
(⚠️ High selling pressure expected here!)
🔵 Break of Structure (BOS):
Price broke below the rising support line
(📉 Bearish confirmation!)
🎯 Target Point:
99,000.0
(💰 Take Profit Target!)
🔻 Trade Idea:
SELL at 106,026.8
🛑 Stop Loss: 107,488.4
✅ Target: 99,000.0
Risk-Reward looks solid.
This is a short setup expecting a drop after a retest of the supply zone.

BTC/USD Bearish Setup – Trendline Retest Before the Fall?🔍 Technical Breakdown – BTC/USD 3H Timeframe
Bitcoin is displaying a textbook Double Top pattern formation on the 3-hour chart, signaling a potential bearish reversal after a strong bullish run. This classic pattern suggests buyer exhaustion and sets the stage for a downward move. Let's break down the analysis:
🧠 Pattern Insight: Double Top Reversal
A Double Top is one of the most reliable trend reversal patterns, especially when it forms after a sustained uptrend — just like we're seeing here.
Top 1 and Top 2 both formed inside a strong Resistance Zone between $106,500 and $107,000, showing repeated rejection from buyers to push price higher.
The formation of lower highs and long wicks near Top 2 further reinforce the weakening bullish momentum.
💥 Neckline Breakdown & Bearish Trigger
The Neckline, aligned with a horizontal Support Zone (~$103,300–$103,800), was decisively broken, confirming the pattern.
This breakdown acts as the trigger for bearish entries, and we are now in the "Retest Phase", where price often pulls back to the neckline or a nearby trendline before continuing lower.
📐 Trendline Confluence – Retest Opportunity
A short-term descending trendline drawn from Top 2 intersects near the neckline zone.
Price is now approaching this confluence area, offering a potential high-probability short entry if bearish price action confirms (e.g., a rejection candle like a bearish engulfing or pin bar).
🎯 Price Targets & Trade Setup
Parameter Value
📍 Entry On bearish confirmation near neckline/trendline retest (~$105,300)
❌ Stop Loss (SL) Above recent swing high / Top 2 (~$107,100)
🎯 Target ~$97,126 (based on measured move from top to neckline projection)
⚖️ Risk:Reward Approx. 1:3 or better (depending on entry timing)
Measured Target Calculation:
Height from neckline to peak (~$107,000 - $103,500 = $3,500)
Target = Neckline break - height = ~$103,500 - $3,500 = $97,000–$97,100
🔥 Market Context & Psychological Edge
This chart structure reflects a shift in market sentiment. What was once strong bullish momentum is now hesitating — with buyers failing to make higher highs and sellers stepping in aggressively. The double top is not just a pattern, it's a narrative of exhaustion and reversal.
“Let price confirm your bias. Don't just predict; react to structure and behavior.”
Being patient and letting the retest play out is crucial. Don’t rush in early — let the market give you a clean signal. This is where technical discipline pays off.
⚠️ Risk Management Notes
Crypto markets are highly volatile — avoid oversized positions.
A failed double top can lead to a bullish continuation, so SL discipline is key.
Wait for confirmation — candlestick patterns, momentum shifts, or bearish volume spikes can add confidence.
📌 Summary
✅ Pattern: Double Top
✅ Confirmation: Neckline Break
🔄 Current Phase: Retesting Neckline/Trendline
📉 Bias: Bearish
🎯 Target: ~$97,100
❗ SL: Above Top 2
💬 What do you think? Are we headed to GETTEX:97K or is this just a fakeout? Drop your thoughts below and don’t forget to like and follow for more trade setups!

Analysis of BTC's Trend After Two Breakthroughs Above 105,000Recently, the price of BTC has been fluctuating within the range of 102,000-105,000 📊. It has broken through the 105,000 resistance level twice: the first breakout reached 106,000 💥, and today it strongly broke through to 107,000 🔥 before quickly retracing to the 102,000 support level ⬇️. After hitting the bottom, it rebounded rapidly to 105,000 📈. The current upward trend has not stalled 🚀, and shorting at high levels near 106,000 can be considered when the price rebounds to this area ⏳ 👉
⚡⚡⚡ BTCUSD ⚡⚡⚡
🚀 Sell@105000 - 106000
🚀 TP 102500 - 101500
🚀 Buy@101500 - 102500
🚀 TP 105000 - 106000
👇Accurate signals are updated every day 📈 If you encounter any problems during trading, these signals can serve as your reliable guide 🧭 Feel free to refer to them! I sincerely hope they'll be of great help to you 👇

BTCUSD Rectangle Pattern Breakout + Bearish Retest & Target🧩 Chart Overview
This chart captures a well-defined rectangle continuation pattern forming within a rising channel on the 1-hour timeframe. This setup is a classic combination of horizontal and diagonal price structure interaction, offering valuable insights into potential market behavior and trade opportunities.
🧱 Structure Breakdown
Rectangle Pattern: Price action was trapped in a sideways consolidation phase between the resistance zone (~104,800 - 105,400) and the support zone (~101,200 - 101,800).
This rectangle followed a strong bullish rally, which often implies a continuation pattern. However, the lack of follow-through from bulls near the resistance led to repeated failures to break out, suggesting weakening momentum.
Rising Channel: Within this rectangle, price respected a rising trendline support and resistance structure, forming a parallel ascending channel.
Bearish Breakout: The significant event occurred when BTC broke down below both the horizontal support of the rectangle and the lower boundary of the rising channel, triggering a structural shift from bullish to bearish.
🔁 Retesting Phase – What’s Happening Now
After the breakdown:
Price pulled back toward the prior support zone, which is now acting as resistance (a classic example of the support-turns-resistance principle).
This is commonly referred to as a retest, which validates the breakout and offers a lower-risk entry point for traders looking to short.
The retest area (around 101,500 - 102,000) is crucial. If price fails to reclaim this level and prints bearish confirmation (e.g., rejection wick, bearish engulfing candle), it increases the probability of downward continuation.
🎯 Trade Setup (Short Bias)
Entry Zone: 101,500 – 102,000 (on retest rejection confirmation)
Stop Loss: Above 103,000 (above prior highs and invalidation point)
Target 1 (TP1): 99,347 – key psychological and horizontal support level from prior structure
Target 2 (TP2): 97,277 – measured move of the rectangle height projected downward, aligning with previous demand area
This setup offers an attractive risk-to-reward ratio, assuming proper trade management and confirmation-based entry.
📊 Additional Technical Confluences
Bearish Momentum: The aggressive breakdown candle shows strong seller interest and increased volatility.
Volume: If confirmed with high selling volume during the breakdown and low buying volume during the retest, the move gains more credibility.
Trend Reversal Signals: The break of the channel and the rectangle support indicates potential trend reversal from short-term bullish to bearish.
RSI & Momentum Indicators (optional): Traders may use tools like RSI or MACD to confirm momentum shifts during retest.
📉 Psychological and Price-Level Significance
101,500 was a strong intraday support zone throughout the consolidation phase. Once broken, it flips polarity and acts as resistance.
The round-number level of 100,000 is always a psychological magnet for BTC. It often acts as a bounce or breakout zone, so traders should watch price behavior near this area closely.
Deeper demand may emerge around 97,000 – 96,500, which can serve as an extended target or reaccumulation zone depending on broader market conditions.
⚠️ Risk Management & Final Thoughts
This setup is high-probability only if the retest confirms rejection. Avoid early entries or assumptions before confirmation.
Always use proper stop-loss placement to avoid whipsaws or fake-outs.
Manage position sizing based on account size and risk tolerance.
News events or macro data can override technicals, so be aware of upcoming economic releases or sentiment shifts.
🧵 Conclusion
Bitcoin is showing clear signs of short-term weakness following the breakdown of a long-standing consolidation range within a rising channel. The ongoing retest provides an ideal area for short positioning, with clearly defined invalidation and profit targets.
✅ If bears defend the retest zone, expect downside continuation toward 99.3K and possibly 97.2K.

BTC/USD 1-Hour Range Analysis: Key Levels & StrategieBTC/USD 1-Hour Chart Analysis 📊
Currently, BTC/USD is oscillating within the 101,500–105,000 range on the 1-hour chart 📈.
Key Levels
Support: 101,500 acts as short-term support 🛡️. Below that, the strong support lies at 100,600 — a breach of this key level could trigger a sharp price decline.
Resistance: 105,000 is a tough resistance level 🚧, with multiple failed upward attempts. The area above 106,000 forms a resistance zone, which bulls must overcome to initiate a significant uptrend.
Trend
The price is in a downward consolidation phase, with recent highs and lows gradually decreasing. However, chart patterns suggest a potential rebound after testing support, hinting at a possible short-term trend shift 🤔.
⚡⚡⚡ BTCUSD ⚡⚡⚡
🚀 Sell@105000 - 106000
🚀 TP 102500 - 101500
🚀 Buy@101500 - 102500
🚀 TP 105000 - 106000
Accurate signals are updated every day 📈 If you encounter any problems during trading, these signals can serve as your reliable guide 🧭 Feel free to refer to them! I sincerely hope they'll be of great help to you 🌟
