Short term long followed by a scale in entry to the downsideLiquidity had been grabbed, tops manipulated, pushed down enducing late shorts. This short term long will remove all the profotable shorts, or atleast let them out at breal even. Then we will be heading back down!
Btcusdshort

BTCUSD Next Possible Move - Sell BTCUSDHello Traders
Our technical view has been shown in the chart.
If you like it then Support us by Like, Following, and Sharing.
Thanks For Reading
Seven Forex
(Disclaimer: Published ideas and other Contents on this page are for educational purposes and do not include a financial recommendation. Trading is Risky, so before any action do your research.)

BITCOIN even more correction ❌🧨Hello 🐋
based on the chart, the price starts the correction phase 📖💡
and
more correction is logical ❌🧨
beside
range candlesticks to the upside and downside before any other sharp movement is logical too 📖💡
for
any other huge pump, we need even more correction to the downside ❌🧨
Please, feel free to share your point of view, write it in the comments below, thanks 🐋

Bitcoin is at the top of its descending channelThis is the time for low-risk selling and high-risk buying, and if the channel breaks, it is expected to be temporary and return below the channel in a short time. Wait until the price brea the yellow line.

Bitcoin Analyze (Road Map, 07/23/2023)!!!🗺️(15-Min)Due to the fact that the trading volume is generally low on Saturdays and Sundays , the structure of the waves became complex.
Bitcoin seems to be completing the Double Three Correction(WXY) in 🟡 PRZ(Price Reversal Zone) 🟡.
Although Bitcoin seems to have succeeded in creating the Inverse Head and Shoulders pattern , it seems that the effect of this pattern is only up to PRZ (maybe a little higher) .
I expect Bitcoin to start declining from the PRZ and attack the 🟢 support zone($29,850-$29,480) 🟢 again.
Bitcoin Analyze ( BTCUSDT ), 15-minute time frame ⏰.
Do not forget to put Stop loss for your positions (For every position you want to open).
Please follow your strategy, this is just my Idea, and I will be glad to see your ideas in this post.
Please do not forget the ✅' like '✅ button 🙏😊 & Share it with your friends; thanks, and Trade safe.

Bitcoin Analyze (Road Map, 07/21/2023)!!!🗺️(15-Min)Bitcoin has managed to form an ascending channel in the 15-minute time frame⏰.
In terms of the structure of the waves in the ascending channel, I can say that Bitcoin was able to complete the main wave Y at the top of ascending channel and 🟡 Price Reversal Zone(PRZ) .
🔔I expect Bitcoin to try again to break the 🟢 support zone($29,850-$29,480 )🟢 ⚠️ after breaking the lower line of ascending channel ⚠️.
---------------------------------------------------------------------
🌐➕ Positive News ➕🌐:
Indonesia launches its crypto exchange and clearing house.
Couple Alleged to Have Stolen $4.5 Billion Bitcoin in Bitfinex Hack Case Reached a Deal with US Prosecutors.
Tesla’s diamond hands: EV maker's Bitcoin holdings see no change in Q2.
Robert F. Kennedy Jr. Wants Bitcoin Backed U.S. Dollars and Tax Breaks for Investors.
Bitcoin ETFs Move Closer To Approval, SEC Lists 8 Applicants On Federal Register.
Societe Generale Becomes First Company to Win French Crypto License.
🌐➖ Negative News ➖🌐:
Bloomberg Analyst Issues Bitcoin Alert, Says One Catalyst Could Cause Headwinds for BTC.
US Government Sells Another 8,200 Bitcoin, On-Chain Data Confirms.
The Bill Bringing Strict Rules to Cryptocurrencies Has Been Submitted to the US Senate!
UK Government Rejects Lawmaker Plan to Regulate Crypto as Gambling.
Kuwait Cracks Down on Crypto, Banning Payments, Investment and Mining.
Elon Musk’s Tesla Keeps Dogecoin (DOGE) As Payment Option While Removing Bitcoin (BTC).
---------------------------------------------------------------------
Bitcoin Analyze ( BTCUSDT ), 15-minute time frame ⏰.
Do not forget to put Stop loss for your positions (For every position you want to open).
Please follow your strategy, this is just my Idea, and I will be glad to see your ideas in this post.
Please do not forget the ✅' like '✅ button 🙏😊 & Share it with your friends; thanks, and Trade safe.

GodBot AI BTC forecast untill 20:00GodBot AI analyses more than 500 GB market data per minute.
Three main vectors of analysis are: macroeconomic analysis, technical analysis and fundamental analysis.
According to AI forecast bitcoin will reach 29500 soon.

Bitcoin Road Map🗺️!!!(4-hour time frame⏰)Hi everyone👋 (Reading time less than 3 minutes⏰).
Bitcoin has been moving in a Rectangle Pattern for more than 21 days .
If we look at the waves inside the Rectangle Pattern in terms of Elliott waves , we will find that Bitcoin has succeeded in completing the Double Three Correction(WXY) , and in the last 7 days, it is forming an Expanding Ending Diagonal .
💡One of the Signs to confirm the end of wave 5 of Expanding Ending Diagonal can be the formation of the Hanging Man Candlestick Pattern .
💡Another Sign to confirm the end of wave 5 inside the Expanding Ending Diagonal can be Fibonacci levels so that wave 5 is often 138.2%-161.82% in size relative to the size of wave 3 .
💡Another sign is the fifth touch of Bitcoin with the resistance line , which shows the importance of this line for Bitcoin.
🔔As a result, I expect Bitcoin to decline to at least the middle of the rectangle pattern or 🟢 support zone($30,480-$30,360) 🟢.
❗️ Note ❗️: If Bitcoin goes above $31,880 , expect Bitcoin will touch at least $33,000 .
📚For a better understanding and educational aspect, I tried to show you the structure of the waves inside the rectangle pattern on the chart.
🌐➕ Positive News ➕🌐:
Ripple won in court, creating a wave of hope and happiness in the cryptocurrency community.
Europe’s First Bitcoin ETF Set To Begin Trading After 12-Month Wait.
Argentina Embraces BTC With Its First Bitcoin Futures Contract .
Galaxy Digital CEO Mike Novogratz opines that if the Securities and Exchange Commission (SEC) gives the green light for a spot BTC exchange-traded fund (ETF), it will turn around the fortunes of the largest virtual currency.
🌐➖ Negative News ➖🌐:
Bitcoin’s price is following in XRP’s footsteps by rallying close to $32,000, but the price could pull back in the face of this week’s $720 million options expiry.
US Government Moves $305,000,000 Worth of Bitcoin (BTC) Seized From Silk Road
US industry watchdogs oppose the draft bill on the crypto market structure.
----------------------------------------------------------------------------------------
Bitcoin Analyze ( BTCUSDT), 4-hour time frame⏰.
Do not forget to put Stop loss for your positions (For every position you want to open).
Please follow your strategy, this is just my Idea, and I will be glad to see your ideas in this post.
Please do not forget the ✅' like '✅ button 🙏😊 & Share it with your friends; thanks, and Trade safe.

$BTC #BTC #Bitcoin #Elliottwave #btcusd short 8jul23This count is based on my assumptions so anything can happen not a trading or financial advice just for educational purposes only kindly do your own ta thanks trade with care good luck.

btc updateI don't trade crypto and just watch market; I'm literally waiting for good prices of BTC and ETH for investing!
but now that's how I'm thinking about the BTC.

BTC SHORT IDEA BASED ON ICT MODELwe are likely to see lower price for BTC in the coming days, giving that we created an ICT3D pattern which genarally signals a pontential reversal
My out look for BTC is that we will first trade around 30780 which is around a premium FVG. From that area we will likely trade down to 27500.

BTC Chart AnalyticsBitcoin will see a drop in the next few days and then it will go up based on harmonic patterns and trend lines and support and resistance.

BTC/USD trade in consolidation zone Howdy Traders,
We can see that Bitcoin has been trading in a range for several days. This means that the buyer and seller are satisfied within this range. Bitcoin tried to break this range but failed and it was a fake breakout and many buyers were trapped in this breakout.
Looking at this fake breakout, I feel that the market may go down a bit.
Target: 30961, 30800, and more,
Thank You,
Money_Dictators

BTC area's I'm looking at for a bounce higherWith the sell off we have seen after last week, everyone is trying to pick a bounce from here.
In this diagram I've provided a schematic of areas to watch.
No one knows how far we will go.
Ideally for a shallow pull back, the Inside Range target is where we might see some higher highs and higher lows form.
This would start to form our reversal area.
However, there might be other ideas from the market, and we might to see more stops run before we can go higher.
This would be the two liquidity targets outlined, and then also the outside range target.
The outside range is the gap between the current range lows and the previous structure high.
Time will tell! Best thing you can do now is just watch and likely do nothing.

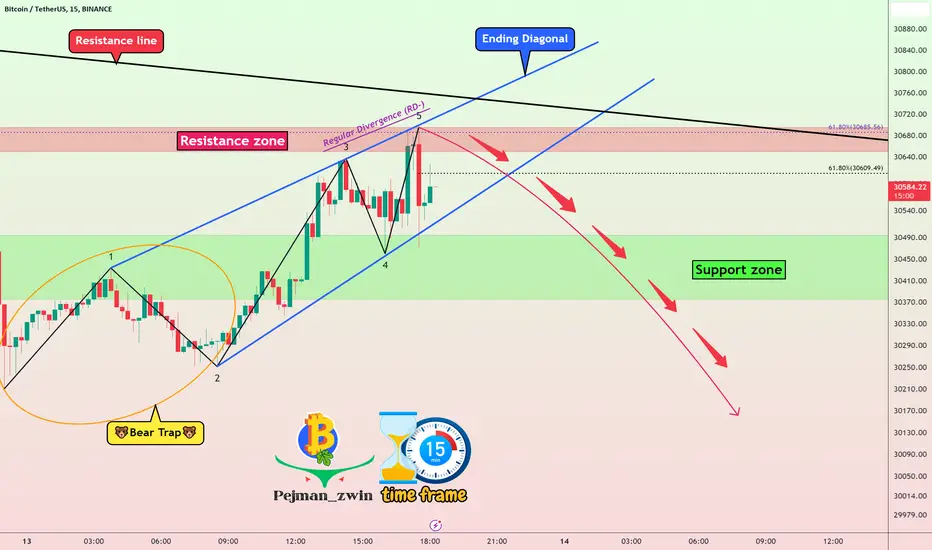
🚨Bitcoin will FALL by Ending Diagonal🚨(15-MIN)Bitcoin formed a 🐻 Bear Trap 🐻 after failing to break the 🟢 support zone($30,500-$30,370) 🟢.
In terms of the structure of the waves, it seems that Bitcoin has formed an Ending Diagonal in the 15-minute time frame⏰.
Also, we can see Regular Divergence (RD-) between two consecutive peaks .
🔔With the breaking of the lower line of the Ending Diagonal pattern, I expect Bitcoin to successfully break the 🟢 support zone($30,500-$30,370) 🟢 this time.
-------------------------------------------------------------------------
I tried to divide the important news of the past 48 hours into Negative and Positive News for you.
🌐➖ Negative News ➖🌐:
US industry watchdogs oppose the draft bill on the crypto market structure.
Former Celsius CEO Alex Mashinsky reportedly arrested
Reserve Bank of India Deputy Governor: Stablecoins are dangerous for emerging economies
US Government Moves $305,000,000 Worth of Bitcoin (BTC) Seized From Silk Road
Hackers
Bitcoin ETF Is Not Most Important Adoption Vector for BTC, Gabor Gurbacs Says
🌐➕ Positive News ➕🌐:
The inflation rate in June in the United States was announced at 3%; Continued reduction in inflation
Telegram Wallet bot enables in-app payments in Bitcoin, USDT, and TON.
Billionaire Investor Tim Draper Still Bullish on Bitcoin, Foresees $250,000 Price in the Future – Here's the Timeline
Google Play Changes Policy on Tokenized Digital Assets, Allowing NFTs in Apps and Games
Crypto Criminals Stealing Much Less Money in 2023.
-------------------------------------------------------------------------
Bitcoin Analyze ( BTCUSDT ), 15-minute time frame ⏰.
Do not forget to put Stop loss for your positions (For every position you want to open).
Please follow your strategy, this is just my Idea, and I will be glad to see your ideas in this post.
Please do not forget the ✅' like '✅ button 🙏😊 & Share it with your friends; thanks, and Trade safe.
Potential BTC move towards CME GAP Hey Guys,
Another update:
I think my view is still valid.
Think we wil see a pump towards maximum $31000 area, then aggressive correction followed by some consolidation and move maybe further up or moving further down and eventually we might see lows.
How low? I think first we see $20000 - $19800 area with lows around $17350. If this area not holding we can see the very lows before summer between $12000-$14000. This area is a massive buy order for me if it come that far! Lets see my friends. Hope you enjoy my update. Appriciate your thumbs up! Wish you all a ver nice day!
Thank you!!
****Its my tradingplan and its not financial advise****
Cryptodjens

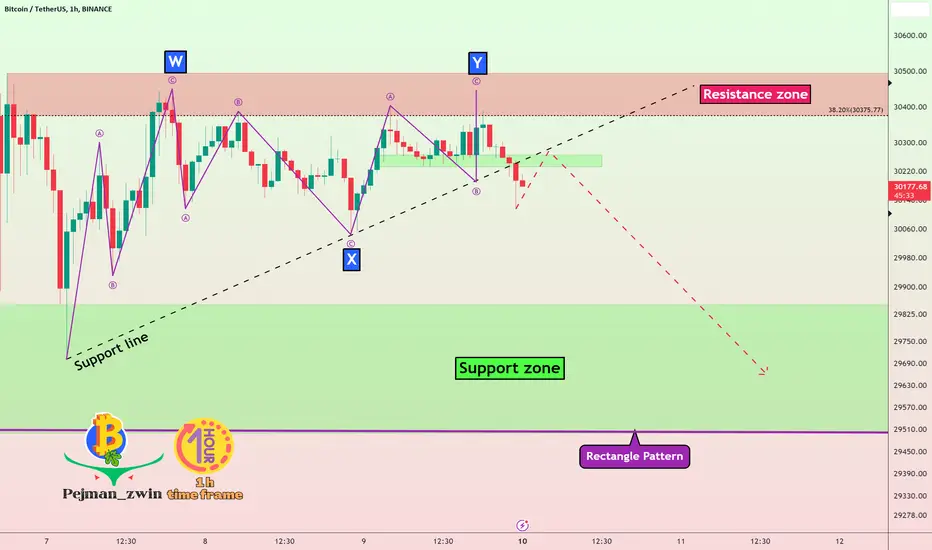
✂️Bitcoin LOST the support line✂️(1-hour time frame)It seems that Bitcoin managed to complete the correction structure of Double Three Correction(WXY) in the last three days.
The 💡 Sign 💡 of the completion of the Double Three Correction structure can be the breaking of the support line .
➕Also, if we look at the RSI indicator in the 1-hour time frame, we can see the 🗻Double Top Pattern🗻 , and I expect the RSI to move downward in the coming hours .👇
🔔I expect Bitcoin to attack⚔️ the 🟢 support zone($29,860-$29,420 )🟢 again after breaking the support line .
Bitcoin Analyze ( BTCUSDT ), 1-hour time frame ⏰.
Do not forget to put Stop loss for your positions (For every position you want to open).
Please follow your strategy, this is just my Idea, and I will be glad to see your ideas in this post.
Please do not forget the ✅' like '✅ button 🙏😊 & Share it with your friends; thanks, and Trade safe.
BTCUSDT YASSINEIØS 🎗️ Please respect the analysis. Today is a beautiful day, a golden opportunity. Just a little patience and diligence, we will be the best Happy holiday Any questions about the transaction are welcome

WILL BLACKROCK BTC ETF GIVE BTC UNEXPECTED $31K BREAKOUT?BTC is currently maintaining a stable outlook following the recent downward trend. Since BTC has not dropped below the 23K mark, it is holding a crucial level of support.
The main question now is whether the upcoming BlackRock Bitcoin application will impact the price movement.
From a broader perspective, BTC is still considered to be in a positive position. If BTC manages to sustain its upward trend and avoids dropping below 23K in the short term, there is a good possibility of a new breakout. This would result in an increase in price, pushing it towards a significant resistance level of 31K after reaching 26K.
it's important to check the coming time frame, which can play an important trend for the main BTC side.
The bullish long-term view if the trend holds the levels can be $47K

BTCUSDT/ Bitcoin will go downBINANCE:BTCUSDT
I really hope that in the near future we will see a rebound in order to take out all the shorts and only then go down. I am deeply convinced of the realism of this picture, I did not think that everything would come so early, I expected such sharp downward movements closer to autumn. Not an investment idea. All profitable trades. Follow me and more likes please ❤

💡Signs of the FALL of Bitcoin(4-hour time frame)💡Bitcoin has NOT seen an upward or downward Sharpie movement for about 12 days and is moving in the form of a Range market ; this Range movement generally causes the formation of a Rectangle pattern .
Bitcoin is currently moving above the rectangle pattern and the 🔴 resistance zone($31,420-$31,220) 🔴.
💡 Signs 💡 of Bitcoin falling again from the resistance zone can be candlestick patterns: Hanging Man , Shooting Star , and Marubozu Candle .
Also, if we look at the RSI indicator , we can see that there is a strong Regular Divergence (RD-) between two consecutive peaks inside the rectangle pattern. In addition, the RSI indicator seems to be issuing one of the most reliable sell signals, the Bearish Failure Swing .👇
🔔I expect Bitcoin to fall to at least the 🟢 support zone($29,860-$29,420) 🟢 and the bottom of the rectangle pattern after breaking the uptrend line .
Bitcoin Analyze ( BTCUSDT ), 4-hour time frame ⏰.
Do not forget to put Stop loss for your positions (For every position you want to open).
Please follow your strategy, this is just my Idea, and I will be glad to see your ideas in this post.
Please do not forget the ✅' like '✅ button 🙏😊 & Share it with your friends; thanks, and Trade safe.

$BTC #BTC #Bitcoin #Elliottwave short #btcusd 4jul23This count is based on my assumptions so anything can happen not a trading or financial advice just for educational purposes only kindly do your own ta thanks trade with care good luck.

Bitcoin decline after completion of pullback(1-hour time frame)Hi everyone👋 (Reading time less than 2 minutes⏰).
First, I recommend you look at the 4-hour Bitcoin chart I shared yesterday.👇
Bitcoin started to decline after contacting the upper line of the rectangle pattern ; the first support in front of Bitcoin was the uptrend line .
Bitcoin managed to break the uptrend line (as I expected in yesterday's post) and started to go down and managed to break the 🟢 support zone($30,700-$30,560) 🟢 a few hours ago.
Bitcoin is currently completing a pullback to the broken 🟢 support zone($30,700-$30,560) 🟢.
Also, the 20 Simple Moving Average (20-SMA) went below the 60-SMA , which is a sell signal , and the resistance in front of the Bitcoin are 20-SMA and downtrend line , which has reacted well to this extreme move in the previous two minor pivots .
🔔I expect Bitcoin to fall to at least the 🟢 support zone($29,860-$29,420) 🟢 and the bottom of the rectangle pattern.
Bitcoin Analyze ( BTCUSDT ), 1-hour time frame ⏰.
Do not forget to put Stop loss for your positions (For every position you want to open).
Please follow your strategy, this is just my Idea, and I will be glad to see your ideas in this post.
Please do not forget the ✅' like '✅ button 🙏😊 & Share it with your friends; thanks, and Trade safe.
