$BTC #BTC #Bitcoin #Elliottwave Short #btcusd 21jun2023This count is based on my assumptions so anything can happen not a trading or financial advice just for educational purposes only kindly do your own ta thanks trade with care good luck.
Btcusdshort

BTCUSDT TradeWe will see a liquidity sweep towards the block order zone plus we will see a downtrend towards the demand zone this remains an idea

BTC - A Tale of a Ten Year Old Support Trend LineLads please pay attention! This 10 year old support trendline turned into a resistance in November 2022. Approach with extreme care! But bare in mind that this is crypto and it could get blasted through with vengeance.

👉 BTCUSDT| Range Rejection 👈Let's take a small profit. We clearly see the three rejections in this range area.
🚀 If you want to help me here, please follow me 🚀
✅ Random GOLD Wins Idea ✅

Bitcoin - exit from the triangle is a bullshit for the bulls?!Hello trader! Today I have a new idea for you. Like and subscribe to the channel, there is a lot of useful information.✅
Opened a scalp trade for BTC 20% of the deposit.
Technical: the price of the asset has formed a classic "triangle" pattern at 2H with a breakdown of the upper border. I think that this exit was for the removal of stop-loss, and soon the price will go to confirm the support of the pattern.
Deal plan:
Entrance - 30,800/30,960$
Stop - $31,610
Take - 30,050/29,700$
P.S: guys, this is a scalp trade, try not to risk too much and take a position with a short stop loss, with any profit we move the stop to the second.
Happy trading and good mood everyone!

BTCUSD UPDATEPresently, on the 4 hour timeframe, we have A change of character and break of structure targeting the downside 20,000 price handle. On the daily and weekly time frame, we have a flip zone identified and a fair value gap that informs our bearish outlook for the short term to medium term.

📈 BTC Trade Setup📈 BTC Trade Setup: Potential Upside Move Based on SMC Concept 📉💡
🔍 Trade Setup:
Entry: $30,260
Target: $30,905
Stop Loss: $30,175
📊 Analysis: BTC is currently trading at $30,495. Based on the Smart Money Concept, consider entering a long position at $30,260, anticipating an upward move. Set the target at $30,905 and place a stop loss at $30,175 to manage risk.
⚡️ Probability Analysis: Taking into account the SMC concept, there is a probability of a price increase. Traders should closely monitor the price action for confirmation of the anticipated move. #BTC #TradingSetup #SMCConcept

BTC USD Just Trade Idea, Price alreay took Buy side liquidity and Price moving to Internal Liquidity and Price respecting Premium arrays. So Better to look shorts upto daily fvg

BTCUSD: 1H analysisHi
I hope you have made money from the previous analysis.
Bitcoin faces two major resistances in the 1H. The first resistance is Moving average 50, which has a significant reaction to it and acts as a strong resistance at the top of the price. The second is a very strong level of 30,500. As a result, it is expected that Bitcoin cannot break this level and return to 30,300. But if price cross this level, 31000 is the next destination.

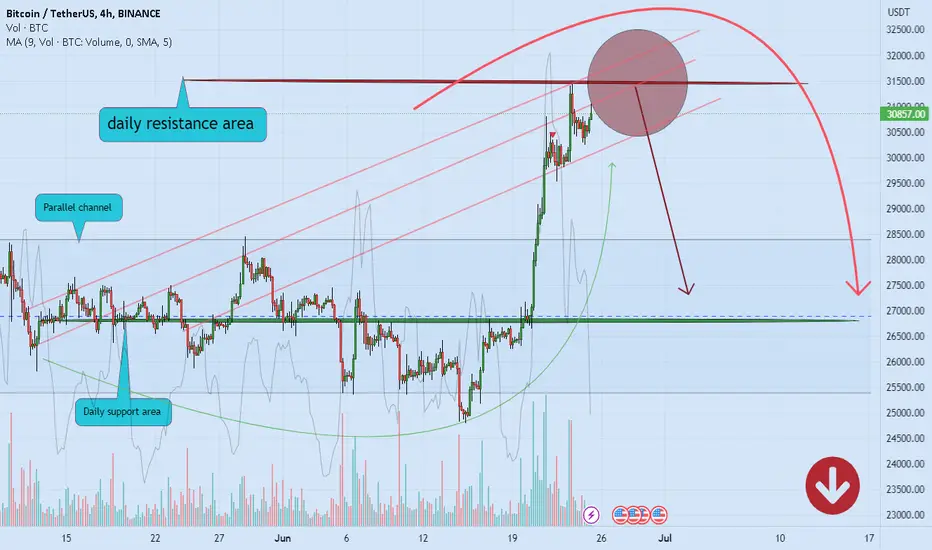
BITCOIN and daily resistance area ❌🧨 Hello 🐋
based on the chart, the price is close to the daily resistance area 📖💡
so
we expect to see more correction to the downside ❌🧨
and
it can act as a gain for more stopless hunting, so we can see brief green candlesticks too 📖🚀
Please, feel free to share your point of view, write it in the comments below, thanks 🐋
Sell btc Selling btc here @ 30.6k
stop loss @ 31.5k
tp 1 @ 27.1k
tp 2 @ 25k
tp 3 @ 21.5k
reason :
- Retest of previous high of 12 April 2023
- Retest of trendline
- Bearish divergence forming on weekly timeframe (confirmation after closer on sunday)

BTCUSD BUYAccording to my analysis of Bitcoin. There is a high possibility to rise with the breach of the descending channel, as well as the resistance at 26250. There is more rise in the coming days towards the level of 28000. good luck for everbody

Bitcoin reached my target, now whatIn my previous Bitcoin analysis, I said that Bitcoin held very well 25k support and an up move with 30k target could follow.
Now the main crypto is facing a very strong resistance and a correction could follow.
28k could be the target for this correction

BTC 25-23kIn the near future (1-2 month) we will work out the red cloud of the monthly timeframe, which will bring the price to 0.5 (25k) or 0.618 (~23.9k) fibo level of the last ascending impulse.
from where it will be possible to form the next ascending impulse.

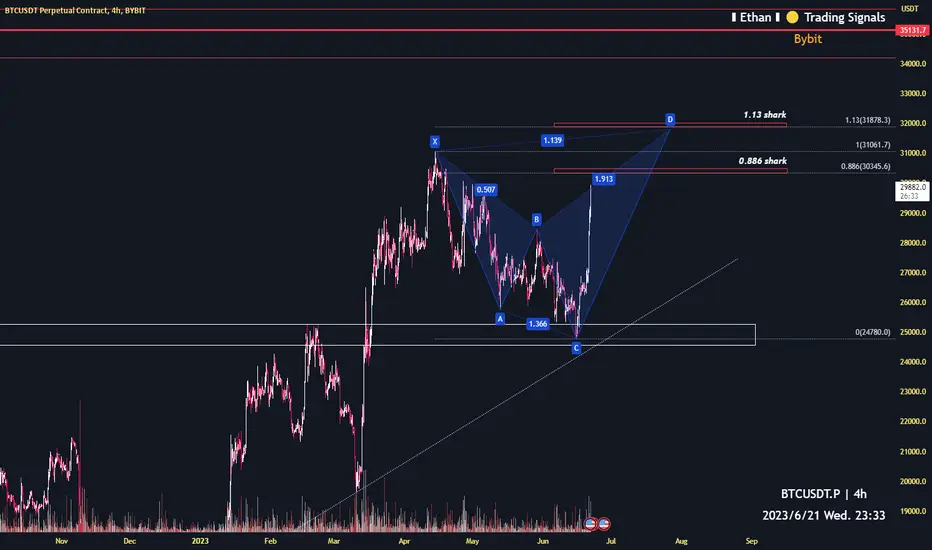
Bitcoin potential reversal price $318784h time frame
-
Bitocoin creating a potential harmonic structure(shark).
Reversal price is 30345 and 31878, depend on small or big shark.
We can have great RRR if open short at these prices.
Stay prepared for it!
Bitcoin – Doomsday ScenarioTLDR:
Although I am not at all bearish on Bitcoin, I think that as traders we should be prepared for every eventuality.
I listed the warning signs that may herald a bearish reversal and key level in which a reversal to the upside may be possible.
This is a limited scenario. I don’t think a 10K Bitcoin is likely and there is no point is discussing such a possibility ATM.
Bearish Signals:
Prelude: Allow me to point out that there are two huge liquidity pools between 20K to 23.8K. Market Makers don’t like to leave such an imbalance behind before taking the market higher. I am not saying that we have to retrace but, it’s a possibility.
1. The loss of the up trending diagonal support line.
The altcoin market is an example that once an up-trending support line is breached, more downside is likely. I can forgive a short period below the diagonal support but, a sustained or reoccurring break is the first sign of a downtrend.
For example: The loss of Bitcoin’s diagonal support that initiated the markdown phase in December of 2021.
you can look at almost all the altcoin charts and see the same picture.
2. The loss of the 25,200 USD horizontal support level.
You equivocate the 25,200 level to the 53K level during the bull market. It a crucial level because it is the difference between trading in a range to the beginning of an uptrend.
3. The loss of the 200 D EMA.
Currently at 23,800 USD. The 200 D EMA is the line in the sand. Once price breaks this level our bias is formally bearish, and traders will tend to go short on every opportunity.
4. The loss of the 23K level.
If you look at the VRVP, you will see a high-volume node at 23K. this level can be a reversal point for price or the final seal on Bitcoin’s coffin.
5. If we lose the 23K level, then it’s pretty much over and 20K will be next. If this happens, we’ll take it up from there. No use discussing it now.
Again, let me say that ATM I am looking for upside. However, we are traders, and we can make money if the market moves up or down. We need to be prepared and without bias clouding our judgment.
NFA.
What do you think? Please share in the comments.
Best wishes to all.

btcusd. Don't forget about stop-loss.
Write in the comments all your questions and instruments analysis of which you want to see.
Friends, push the like button, write a comment, and share with your mates - that would be the best THANK YOU.
P.S. I personally will open entry if the price will show it according to my strategy.
Always make your analysis before a trade

$BTC #BTC #Bitcoin #Elliottwave #btcusd short 18jun2023This count is based on my assumptions so anything can happen not a trading or financial advice just for educational purposes only kindly do your own ta thanks trade with care good luck.

Bitcoin will go UP by Three Rising Valleys Pattern🚀Bitcoin managed to break the downtrend line in the 15-minute time frame by breakout candle .
Bitcoin has also succeeded in forming a Three Rising Valleys pattern .
I expect Bitcoin to attack the 🔴 resistance zone($ 26,820-$ 26,720) 🔴 again after breaking Peak 2 .
Bitcoin Analyze ( BTCUSDT ), 15-minute time frame ⏰.
Do not forget to put Stop loss for your positions (For every position you want to open).
Please follow your strategy, this is just my Idea, and I will be glad to see your ideas in this post.
Please do not forget the ✅' like '✅ button 🙏😊 & Share it with your friends; thanks, and Trade safe.

BTC - Bearish for SHORT TERM🐻Hi Traders, Investors and Speculators of Charts 📈📉
After closely monitoring the market trends following our previous idea of shorting until the 25K support zone, it has become apparent that there is a notable increase in selling activity. Despite witnessing a decent rebound initially, it was met with an equivalent level of selling pressure, resulting in the price experiencing a downward trajectory with lower highs.
Furthermore, it is crucial to take into account the occurrence of a multiple bearish patterns in the daily (short term) timeframe including a double top, Head and Shoulders pattern and Bearish M patterns.
These technical chart-analysis patterns typically indicates a reversal in the price trend and suggests a bearish outlook for the short term. It implies that the market has made two unsuccessful attempts to surpass a certain price level, highlighting the presence of significant selling pressure and a potential decrease in investor confidence.
NOTE that although I am still bearish for the SHORT term, I remain bullish in my macro perspective.
________________________________
From the Fibonacci Retracement Macro perspective, we can see the price is still in the upper resistance zone; right underneath the 1.618. What we DO NOT want to see from the monthly timeframe is a close UNDER the support at roughly $25K. This would drive the price down to find more buying pressure around $20K.
BITSTAMP:BTCUSD COINBASE:BTCUSDT INDEX:BTCUSD BITFINEX:BTCUSD COINBASE:BTCUSD BINANCE:BTCUSDT BYBIT:BTCUSDT BITGET:BTCUSDT CRYPTOCAP:BTC GEMINI:BTCUSD BINANCEUS:BTCUSDT PHEMEX:BTCUSDT
_______________________
📢Follow us here on TradingView for daily updates and trade ideas on crypto , stocks and commodities 💎Hit like & Follow 👍
We appreciate your support !
CryptoCheck

BTCUSD Analysis H4Here is my analysis for BTCUSD on H4 by Order Block. The price could go bearish, you can put a pending order on the Order block or find an entry on LTF within OB Zone. Trade Safe!

Bitcoin Road Map(15-Min)🗺️!!!Bitcoin started to grow again as I expected; the structure of impulse waves of Bitcoin is such that wave 3 is extended, and wave 5 finished in the resistance zone.
I tried to show the road map of BTC in a 15-minute time frame.
Bitcoin Analyze ( BTCUSDT ), 15-minute time frame ⏰.
Do not forget to put Stop loss for your positions (For every position you want to open).
Please follow your strategy, this is just my Idea, and I will be glad to see your ideas in this post.
Please do not forget the ✅' like '✅ button 🙏😊 & Share it with your friends; thanks, and Trade safe.

Bitcoin will go DOWN by 🦇Bearish Bat Harmonic Pattern🦇(15-Min)Bitcoin is moving in ascending channel for a few hours⏰.
Also, Bitcoin created the 🦇 Bearish Bat Harmonic Pattern 🦇 near the 🔴resistance zone($ 27,350-$ 27,260)🔴; the confirmation sign of the D point of the pattern can be the creation of the Shooting Star candlestick pattern above the ascending channel and near the resistance zone.
I expect Bitcoin to start its downward trend again in the coming hours after breaking the lower line of ascending channel.
Bitcoin Analyze ( BTCUSDT ), 15-minute time frame ⏰.
Do not forget to put Stop loss for your positions (For every position you want to open).
Please follow your strategy, this is just my Idea, and I will be glad to see your ideas in this post.
Please do not forget the ✅' like '✅ button 🙏😊 & Share it with your friends; thanks, and Trade safe.
