Whether BTC can reach 90KWhether BTC can reach 90K
Our strategy has made a profit and now BTC is testing the 88K resistance, let's see if we can break it today
Btcusdshort

Each wave around 87K is the moment we buyEach wave around 87K is the moment we buy
btcusdt buy@87K-87.5K
tp:88.5K-89K
We share various trading signals every day with over 90% accuracy.
Fans who follow us can get high rewards every day
If you want stable income, you can contact me.

BTC Today's strategyHi guys, it's a new week and the charts show it's moving up the channel
Looking back on the trading strategy we developed last week, we were undoubtedly successful. Now that the price has exceeded 87K, we still need to pay attention to the resistance of 88K, as it is the determinant of whether the upside can be
btcusdt buy@84.5K-85K
tp:87.5K-88K
We share various trading signals every day with over 90% accuracy.
Fans who follow us can get high rewards every day
If you want stable income, you can contact me.

BTCUSD: ShortToday's bulls have won a great victory. After completing the target of 86K, the targets near 87K and 88K have also been achieved. The current indicator forms a short position. It should fluctuate and fall near 88K, so the transaction can be mainly short.

BTC/USDT "Bitcoin vs Tether" Crypto Market Bearish Heist Plan🌟Hi! Hola! Ola! Bonjour! Hallo!🌟
Dear Money Makers & Robbers, 🤑 💰🐱👤🐱🏍
Based on 🔥Thief Trading style technical and fundamental analysis🔥, here is our master plan to heist the BTC/USDT "Bitcoin Tether" Crypto Market. Please adhere to the strategy I've outlined in the chart, which emphasizes short entry. Our aim is the high-risk Green Zone. Risky level, oversold market, consolidation, trend reversal, trap at the level where traders and bullish robbers are stronger. 🏆💸Book Profits Be wealthy and safe trade.💪🏆🎉
Entry 📈 : The heist is on! Wait for the breakout of (80000) then make your move - Bearish profits await!"
however I advise placing Sell stop below the MA line or Sell limit orders within a 15 or 30 minute timeframe. Entry from the most recent or closest low or high level should be in swing/retest.
📌I strongly advise you to set an alert on your chart so you can see when the breakout entry occurs.
Stop Loss 🛑: Thief SL placed at (84000) swing Trade Basis Using the 4H period, the recent / swing high or low level.
SL is based on your risk of the trade, lot size and how many multiple orders you have to take.
Target 🎯: 68000 (or) Escape Before the Target
🧲Scalpers, take note 👀 : only scalp on the Short side. If you have a lot of money, you can go straight away; if not, you can join swing traders and carry out the robbery plan. Use trailing SL to safeguard your money 💰.
📰🗞️Fundamental, Macro, COT Report, On Chain Analysis, Quantitative Analysis, Intermarket Analysis, Sentimental Outlook:
The BTC/USDT "Bitcoin Tether" Crypto Market is currently experiencing a Neutral trend (there is a higher chance for Bearishness).., driven by several key factors.
⭐Fundamental Analysis
Fundamental analysis assesses Bitcoin's core metrics and market position. Here are the key factors:
Market Capitalization: Approximately 1.68 trillion USD, calculated using the circulating supply of 19.83 million BTC multiplied by the current price of 85,000 USDT. This reflects Bitcoin’s significant presence in the crypto market.
Trading Volume (24h): Around 31.44 billion USD, indicating robust liquidity and active trading activity over the past day.
Circulating Supply: 19.83 million BTC, out of a maximum supply of 21 million BTC, meaning 94.4% of the total supply is already in circulation.
Price Context: Bitcoin’s current price of 85,000 USDT is below its all-time high of 109,356 USD (reached on January 20, 2025), suggesting it is in a corrective phase but still well above historical lows (e.g., 2 USD on October 20, 2011).
Key Insight: Bitcoin’s fundamentals remain strong with a high market cap and active trading volume, but the price being below its recent peak indicates potential vulnerability or a consolidation period.
⭐Macroeconomic Factors
Macroeconomic conditions influence Bitcoin’s price as a global asset. Here are the relevant factors:
Global GDP Growth: Forecasted at 3.0% to 3.3% for 2025, suggesting moderate economic expansion worldwide. This level of growth may support risk assets like Bitcoin but isn’t strong enough to trigger significant inflation concerns.
Commodity Prices: Expected to decline by 5% in 2025, potentially reducing Bitcoin’s appeal as an inflation hedge since falling commodity prices signal lower inflationary pressure.
Stock Market Performance: U.S. stock indices are up 5% year-to-date (YTD) as of early 2025, reflecting a positive risk-on sentiment that often correlates with Bitcoin’s performance as a speculative asset.
Interest Rate Policies: The U.S. Federal Reserve is anticipated to cut interest rates in 2025, which could weaken the USD and make Bitcoin more attractive relative to USDT (a USD-pegged stablecoin). Conversely, the Bank of Japan may raise rates, though this has a limited direct impact on BTC/USDT.
Key Insight: Macroeconomic conditions are mixed—declining commodity prices may dampen Bitcoin’s inflation-hedge narrative, but stock market gains and potential Fed rate cuts could bolster its price.
⭐Global Market Analysis
Global market trends and events provide context for BTC/USDT’s performance:
Geopolitical Events: No significant geopolitical tensions are currently reported as of March 5, 2025. This reduces demand for Bitcoin as a safe-haven asset, unlike during periods of global unrest.
Central Bank Policies:
Federal Reserve: Expected rate cuts could weaken the USD, potentially driving BTC/USDT higher as investors seek alternatives.
Bank of Japan: Anticipated rate hikes may strengthen the JPY, but this has minimal direct influence on BTC/USDT unless it triggers broader currency shifts.
Commodity Trends: A projected 5% decline in commodity prices may ease inflation fears, indirectly reducing Bitcoin’s appeal as a store of value.
Global Risk Sentiment: Mixed stock market performance globally suggests a neutral stance on risk assets, with no strong directional push for Bitcoin.
Key Insight: Without major geopolitical catalysts, Bitcoin’s price may hinge on central bank actions, particularly Fed rate cuts that could weaken the USD and support BTC/USDT.
⭐Commitment of Traders (COT) Data
COT data offers insights into large trader positions, though specific BTC/USDT COT reports are not directly available. Here’s an inferred analysis:
Technical Ratings: Current indicators for BTC/USDT show a “sell” signal, with oscillators (e.g., RSI, MACD) and moving averages (e.g., 50-day, 200-day) trending strongly bearish.
Trader Positioning: The bearish technical outlook suggests large traders (e.g., speculators) are likely net short, anticipating further price declines.
Market Implications: This positioning could amplify downward pressure if selling continues, though a reversal in sentiment could trigger a short squeeze.
Key Insight: The inferred COT data points to bearish sentiment among large traders, aligning with technical signals and suggesting a downward bias.
⭐On-Chain Analysis
On-chain data reflects Bitcoin’s blockchain activity and holder behavior:
Unmoved BTC: Approximately 151,000 BTC, acquired at an average price of 97,800 USDT, has not moved despite recent volatility. This indicates strong conviction among holders at higher levels, potentially acting as resistance.
Accumulation Patterns: Some accumulation occurred near 83,000 USDT, suggesting buying interest at lower levels. However, rapid selling has dominated, with one-third of BTC accumulated between 96,000–97,500 USDT redistributed during the recent decline.
Supply Concentrations: Thin supply exists between 93,000 and 83,000 USDT, with notable clusters at 84,200 USDT (23,000 BTC), 86,900 USDT (25,800 BTC), and 88,900 USDT (46,000 BTC), indicating key price levels where holders may act.
Key Insight: On-chain data shows a mix of strong holding at higher prices and selling pressure at current levels, hinting at capitulation but also potential support forming near 83,000–85,000 USDT.
⭐Market Sentiment Analysis
Market sentiment reflects trader and investor psychology:
Social Media Sentiment: Posts on platforms like X reveal a split outlook—some traders predict a drop to 75,000–73,000 USDT, citing technical weakness, while others see a potential bullish reversal if support holds.
Sentiment Index: Total positive sentiment is estimated at 0.75 (on a scale from -1 to 1), suggesting moderate optimism despite recent declines.
Fear and Greed Index: Specific data is unavailable, but the mixed sentiment aligns with a neutral-to-slightly bullish stance.
Key Insight: Sentiment is mixed but leans slightly bullish, indicating cautious optimism amid uncertainty.
⭐Positioning
Positioning reflects how traders are aligned in the market:
Speculative Positions: Likely net short, inferred from bearish technical signals and COT-like trends, suggesting traders are betting on a decline.
Institutional Positioning: Hedge funds have increased exposure to Bitcoin ETFs, indicating growing long-term interest that could counterbalance short-term selling.
Market Dynamics: Short positions may dominate near-term price action, but institutional buying could stabilize or reverse the trend.
Key Insight: Short-term bearish positioning contrasts with potential long-term bullish institutional interest.
⭐Next Trend Move
The next likely price movement is based on current data:
Direction: Downward pressure is favored, driven by technical sell signals and bearish positioning.
Key Levels:
Support: 80,000 USDT; if breached, 75,000–73,000 USDT becomes the next target.
Resistance: 95,000 USDT, a level that would need to be overcome for a bullish reversal.
Triggers: A break below 80,000 USDT could accelerate selling, while holding above 85,000 USDT might signal stabilization.
Key Insight: The next trend move likely tests lower support levels, with a potential drop to 75,000–73,000 USDT if momentum persists.
⭐Other Data
Additional factors impacting BTC/USDT:
Institutional Adoption: Hedge funds are increasing exposure to Bitcoin ETFs, a bullish signal for long-term price support as institutional capital flows in.
Regulatory Changes: The SEC’s employee buyout program in 2025 could lead to shifts in crypto regulation, introducing uncertainty and potential volatility.
Market Trends: Bitcoin’s limited supply (21 million BTC cap) and growing mainstream acceptance bolster its long-term value proposition.
Key Insight: Institutional interest is a positive wildcard, but regulatory uncertainty could shake confidence in the near term.
⭐Overall Summary Outlook
Overview: On March 5, 2025, BTC/USDT at 85,000 USDT exhibits a cautiously bearish outlook. Technical sell signals, bearish trader positioning, and recent on-chain selling pressure point to downside risks. However, strong holding behavior at higher levels (e.g., 97,800 USDT), potential institutional support via ETF exposure, and a slightly bullish market sentiment suggest a reversal is possible if support holds. Macroeconomic factors like expected Fed rate cuts could weaken the USD and provide tailwinds, though declining commodity prices may temper Bitcoin’s inflation-hedge appeal. Risks include a drop below 80,000 USDT or volatility from regulatory shifts.
📌Keep in mind that these factors can change rapidly, and it's essential to stay up-to-date with market developments and adjust your analysis accordingly.
⚠️Trading Alert : News Releases and Position Management 📰 🗞️ 🚫🚏
As a reminder, news releases can have a significant impact on market prices and volatility. To minimize potential losses and protect your running positions,
we recommend the following:
Avoid taking new trades during news releases
Use trailing stop-loss orders to protect your running positions and lock in profits
💖Supporting our robbery plan 💥Hit the Boost Button💥 will enable us to effortlessly make and steal money 💰💵. Boost the strength of our robbery team. Every day in this market make money with ease by using the Thief Trading Style.🏆💪🤝❤️🎉🚀
I'll see you soon with another heist plan, so stay tuned 🤑🐱👤🤗🤩

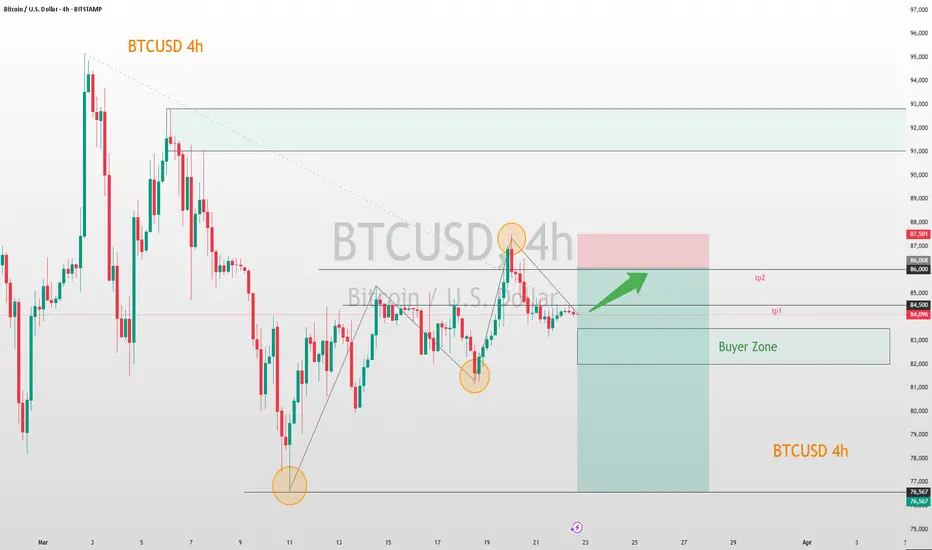
3/24 BTCUSD Trading Signal: LongThis is a relatively healthy rebound. After breaking through the first resistance, it slowly rose to the second resistance, where it has been tested many times. The current shape is good and there is room for further rise.
Therefore, in the current transaction, it is recommended to take long as an important reference direction, and the target is near the resistance of 86K.
When the price rises to this point, the market is likely to confirm the validity of the area near the 85K support. If the support is confirmed to be valid, the price may rise to 86.8K-88K.

BITCOIN BASED ON WYCKOFF THEORY 73K PROGRAMMED FOR NEXT LEG DOWNBased on analysis from multiple perspectives, not just Wyckoff theory, the chart strongly suggests that this is merely a pullback before continuing downward.


BTC | 90K or 40KBTC is seemingly in the early days of a brand new bearish cycle.
This is somewhat surprising, since ETH did not make a new ATH - which has happened every single time in the past rallies.
The bounce zones I will be watching for the coming bearish cycle:

The momentum of BTC indicates its short-term potentialThe BTC/USD price is currently in a consolidation phase within a specific range.
Pay close attention to the 82,000 - 83,000 zone. Should the price retrace to this area and demonstrate signs of support, it could be a viable opportunity to initiate a small long position.
Set the target take - profit levels between 84,500 and 86,000. When the price reaches 84,500, it is advisable to consider partially closing the position to secure some profits. If it manages to break through this level, the subsequent target will be 86,000.
Considering the extreme volatility characteristic of the crypto market, prudent management of position size is of utmost importance. It's essential to refrain from overtrading to safeguard your investment capital.
BTCUSD
buy@82000-83500
tp:84500-86000
I will share trading signals every day. All the signals have been accurate for a whole month in a row. If you also need them, please click on the link below the article to obtain them.
BTC Today's strategySo far, BTC has fluctuated around 84K today, and it still fluctuates within our marked range. The strategy of selling high and buying low still works.
Today's BTC trading strategy:
btcusdt buy@83K-83.5K
tp:84.5K-85.5K
There is no large-scale selling by long-term holders in the market. Short-term holders have a significant impact on short-term movements. At present, geopolitical conflicts continue, trade frictions continue, and bitcoin and gold have historically performed well in times of economic uncertainty
Our investment strategy has achieved significant returns in the past two weeks. If you also want to double your capital, you can click on my link to get my trading strategy

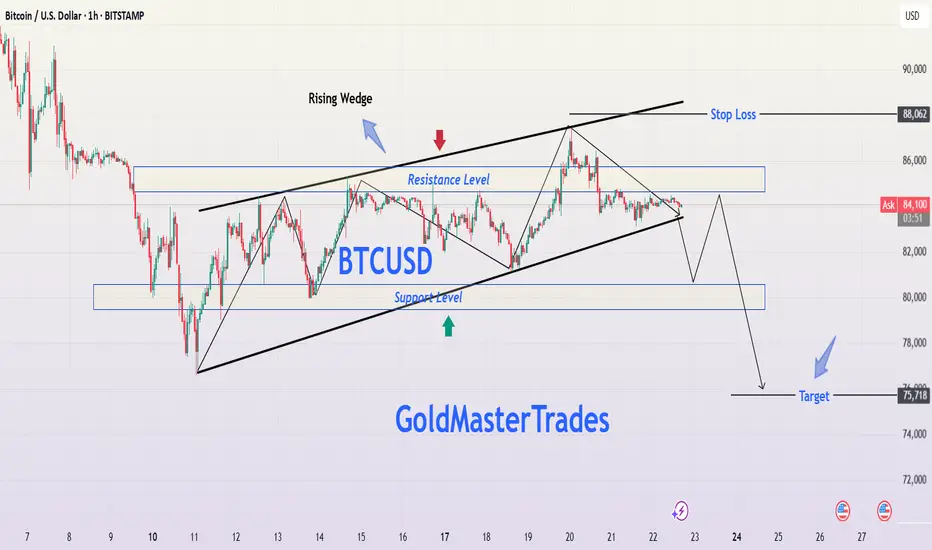
BTCUSD Bitcoin Rising Wedge Breakdown – Professional AnalysisBitcoin's price action is forming a Rising Wedge pattern on the 1-hour chart, a well-known bearish reversal formation. This pattern suggests that although the price has been making higher highs and higher lows, the upward momentum is weakening. Historically, when a rising wedge breaks to the downside, it often leads to strong downward movement, making it an ideal shorting opportunity.
This analysis will cover the pattern formation, key support and resistance levels, price action expectations, trading strategy, and risk management to ensure a well-informed trade setup.
1. Chart Pattern Breakdown: Understanding the Rising Wedge
Formation of the Rising Wedge
The price has been moving within two converging trendlines (black lines), forming a wedge shape.
The slope of both the upper and lower trendlines is positive, indicating an uptrend, but the lower trendline is steeper, suggesting weakening bullish pressure.
As Bitcoin moves higher, buying volume is declining, indicating that buyers are losing control.
The price has tested the upper resistance trendline multiple times, failing to break above it, further confirming bearish exhaustion.
The lower trendline has acted as strong support, but multiple touches suggest a possible breakdown soon.
Why This Pattern is Bearish
The rising wedge is inherently bearish because it signals that although the price is rising, the upward movement is slowing down. Eventually, the price is likely to break below the lower support trendline, triggering a sharp sell-off.
A breakdown from this wedge structure would confirm the start of a downtrend, making it an excellent opportunity for short traders.
2. Key Technical Levels to Watch
Resistance Level (~$86,000 - $86,500) - Strong Sell Zone
Bitcoin has repeatedly failed to break above this zone, indicating heavy selling pressure.
If the price unexpectedly moves above this level, the bearish setup would be invalidated.
Support Level (~$80,000 - $80,500) - Breakdown Zone
This support level has held strong multiple times.
If BTC loses this zone, it will likely trigger a massive drop due to stop-loss orders being hit and panic selling.
Stop Loss ($88,062) - Risk Management
A stop loss above $88,062 ensures protection against unexpected bullish breakouts.
This level is placed just above recent highs to minimize the risk of premature stop-outs.
Target Level ($75,718) - Profit Objective
The projected price target is based on measuring the height of the wedge and applying it to the breakout point.
This level also aligns with a major historical support zone, where buyers might step in.
3. Trading Setup & Strategy
Bearish Trading Plan - Short Setup
📌 Entry:
Enter short after Bitcoin breaks below the wedge’s lower support and confirms the breakdown by retesting support as new resistance.
Ideal entry price is around $81,500 - $82,000 after confirmation.
📌 Stop Loss:
Place above $88,062, which is beyond the wedge’s upper resistance.
This protects against unexpected bullish breakouts.
📌 Take Profit:
First target: $78,000 (psychological support).
Final target: $75,718 (technical breakdown target).
Confirmation Signals for a Strong Short Trade
✔ Candle Close Below Support – A 1-hour candle closing below the wedge confirms a breakdown.
✔ Increase in Selling Volume – Rising bearish volume supports downward momentum.
✔ Retest of Broken Support as Resistance – If the price retests the wedge’s lower trendline and fails to reclaim it, it confirms further downside.
4. Risk Management & Considerations
Risk-to-Reward Ratio: The trade offers a 3:1 risk-reward ratio, making it highly favorable.
Market Conditions: External news events, institutional activity, or macroeconomic trends (like inflation reports) could impact price action.
Bear Trap Possibility: If Bitcoin breaks below but quickly reclaims support, it could be a fakeout, so wait for confirmation before entering.
5. Alternative Scenario – When to Invalidate the Bearish Outlook?
Although the primary expectation is a bearish breakdown, we must consider alternate scenarios:
🚨 Bullish Invalidation: What if Bitcoin Rallies?
If Bitcoin breaks above the resistance zone at $86,500 - $88,000, the rising wedge breakdown would be invalidated. In that case:
✅ A breakout above $88,062 could trigger a short squeeze, pushing BTC toward $90,000+.
✅ Bulls will regain control, shifting the trend to bullish continuation instead of reversal.
🔹 In such a case, traders should exit short positions and re-evaluate market conditions before re-entering trades.
6. Conclusion – Trading Plan Summary
📊 Current Bias: Bearish 📉
🔹 Pattern: Rising Wedge (Breakdown Expected)
🔹 Entry: Short after wedge breakdown & confirmation
🔹 Stop Loss: Above $88,062
🔹 Target: $75,718
Bitcoin is forming a classic Rising Wedge, which historically leads to strong downward movement once it breaks support. If BTC follows the expected scenario, a high-probability short trade is in play, targeting a decline toward $75,718. However, traders must wait for confirmation and manage risk effectively to avoid fakeouts.
📢 Stay updated, follow price action closely, and trade responsibly! 🚀
BTC Today's strategySo far, BTC has fluctuated around 84K today, and it still fluctuates within our marked range. The strategy of selling high and buying low still works.
Today's BTC trading strategy:
btcusdt buy@83K-83.5K
tp:84.5K-85.5K
There is no large-scale selling by long-term holders in the market. Short-term holders have a significant impact on short-term movements. At present, geopolitical conflicts continue, trade frictions continue, and bitcoin and gold have historically performed well in times of economic uncertainty
Our investment strategy has achieved significant returns in the past two weeks. If you also want to double your capital, you can click on my link to get my trading strategy

EconOptics| An Early Short Position on BTC (Risky)Bitcoin Analysis on the 1-Hour Timeframe:
The price is currently moving within an ascending channel. However, on the daily timeframe, this ascending channel appears to represent only a short-term consolidation phase, which diminishes its overall significance. That said, we can still take advantage of the minor fluctuations within this channel. My recommendation is to closely monitor a potential breakout, as a strong trend in the market could emerge following such a breakout.
At the moment, the price has reacted to the upper boundary of the channel and has been rejected. If we remain optimistic, it could potentially move toward the lower boundary of the channel. Currently, the price has broken below the midline of the channel and is consolidating within a narrow range. From the bottom of this consolidation zone, we can identify a trigger for a short position and utilize it. However, I suggest paying close attention to volume increases during a breakout to enter the position with momentum. Personally, I use the 15-minute timeframe for quicker entry points and tighter stop-loss levels. I might also hold this position in anticipation of a breakdown below the lower boundary of the channel, which could signal the resumption of a bearish trend on higher timeframes.
Stick to your strategy and practice proper risk management!

BTC Today's strategyToday, BTC still fluctuates within our marked range, and the strategy of selling high and buying low still works
Today's BTC trading strategy:
btcusdt buy@83K-84K
tp:85K-86K
There are risks in trading. If you are not sure about the timing, it is best to leave me a message. This will better confirm the timing of the transaction, It can also better expand profits and reduce losses

BTC Today's strategyAt present, the support range continues to move upward and the fluctuations have exceeded the previous range. This is a new direction. We only need to make appropriate adjustments and trade within the range, selling high and buying low.
Today's BTC trading strategy:
btcusdt buy@83K-84K
tp:86K-87K
There are risks in trading. If you are not sure about the timing, it is best to leave me a message. This will better confirm the timing of the transaction, It can also better expand profits and reduce losses.

BTC ~ MACRO Bounce ZoneBTC has been holding the 80K zone well, but from the macro perspective the bearish cycle should be starting soon.
This is due to simple logic (after such a dramatic ATH) as well as the Wyckoff Method.
Unless we can reclaim 90K, it's likely that this will be the third touch on the parabolic curve - which is usually when the bearish cycle starts.
Previously, BTC retraced and bounced one Fib higher than the price at the start of the bullish cycle. This puts us roughly at 28k, as well as at the neckline of the previous resistance zone before the new ATH:
______________
BINANCE:BTCUSDT

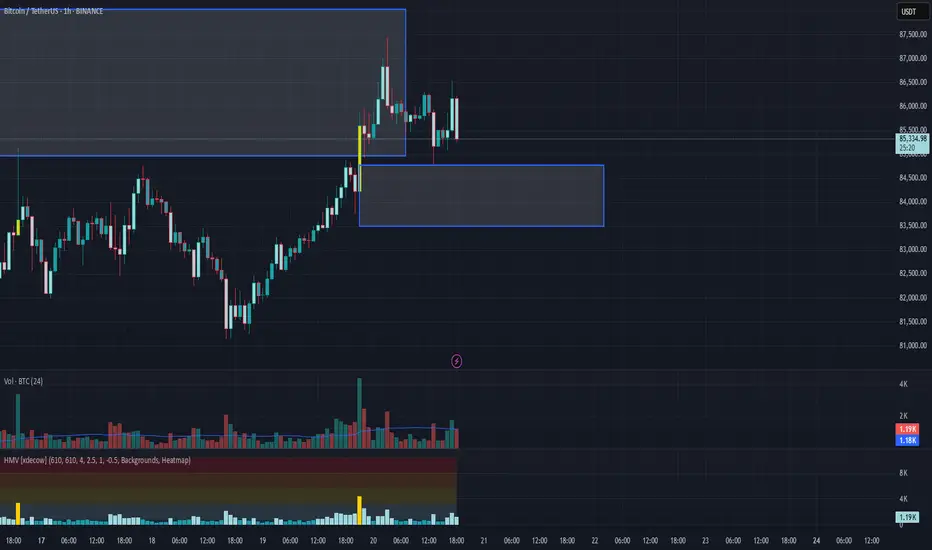
BTC/USDT Analysis: Climactic Moment on the Bitcoin ChartBitcoin managed to hold above the local range despite seller pressure, tested the key volume zone of $85,000–$88,000, and has already shown an initial selling reaction.
Currently, a local support zone has formed at $84,800–$83,500, casting doubt on the scenario of a decline to the lower boundary. If this zone is tested and buyers react to it, the current uptrend will continue. If there is no reaction, the trend will shift to a bearish direction.
Selling Zones:
$85,000–$88,000 (volume zone)
$95,000–$96,700 (accumulated volumes)
$97,500–$98,400 (pushing volumes)
$107,000–$109,000 (volume anomalies)
Buying Zones:
$84,800–$83,500 (pushing volumes)
$77,000–$73,000 (volume anomalies, pushing volumes)
BTCUSD | Rising Wedge Breakdown – Bearish SetupChart Overview:
This chart represents Bitcoin (BTC/USD) on the 1-hour timeframe and showcases a Rising Wedge pattern. The price action has reached a key resistance level, and a potential breakdown scenario is unfolding.
1️⃣ Pattern Identification: Rising Wedge Formation
A Rising Wedge is a bearish reversal pattern that forms when price moves within two converging upward-sloping trendlines. The narrowing price range indicates a weakening trend, and a breakdown usually leads to a significant price drop.
Upper Trendline (Resistance): Marked in blue, this trendline connects the higher highs.
Lower Trendline (Support): Also in blue, connecting the higher lows.
Breakdown Confirmation: The price has already moved below the wedge support, confirming the bearish bias.
2️⃣ Key Price Levels & Zones
🔹 Resistance Zone (Blue Box)
This strong resistance level has repeatedly rejected the price.
The final rejection led to a breakout failure and potential trend reversal.
🔹 Support Zone (Blue Box)
A strong demand zone, but a breakdown below it triggers a bearish trend.
This level is now acting as potential resistance after the breakdown.
🔹 ATH (All-Time High) – $87,566
This marks the highest price level reached in the given timeframe.
3️⃣ Market Structure Breakdown
🔻 Bearish Momentum & Breakdown
After touching the resistance, BTC failed to sustain upward movement.
A breakout of the wedge's lower trendline confirms a trend reversal.
Price action suggests a lower-high, lower-low structure, indicating a bearish market shift.
📉 Expected Price Movement (Wave Structure)
The breakout retest could result in a small pullback to previous support (now resistance).
After confirmation, price is likely to continue downward in a wave-like structure.
Fibonacci levels or key support zones will act as profit-taking targets.
4️⃣ Trade Setup & Targets
🔻 Short Setup (Bearish Trade Idea)
Entry: On a successful retest of the broken support zone.
Stop-Loss (SL): Above the previous resistance zone for risk management.
Take Profit (TP) Targets:
TP 1: $81,638
TP 2: $77,897
Final Target: $74,990
5️⃣ Summary & Conclusion
📌 BTC/USD has broken out of a Rising Wedge pattern, confirming a bearish trend.
📌 A pullback and retest may occur before further downside continuation.
📌 The chart suggests a short opportunity, targeting lower support zones for potential profit-taking.
📌 Traders should manage risk with a well-placed stop-loss above key resistance.
This setup aligns with technical analysis principles, confirming a high-probability short trade for BTC. 🚀

BTC Today's strategyToday, BTC trading is relatively stable and has been fluctuating in the 80K-85K range. We are still buying near support points and selling near resistance points. Once there is a new breakout range, we can simply adjust it
Today's BTC trading strategy:
btcusdt sell@85K-87K
tp:83K-81K

(BTC/USDT) Analysis: Supply Zone Rejection & Potential Drop to SSupply Zone (~85,296 - 84,835):
The price has reached a supply zone, which is acting as resistance. A rejection from this area could push BTC down.
Support Zone (~82,260 - 81,977):
This is a demand area where buyers might step in if the price declines.
Indicators:
EMA 30 (Red Line - 83,553.82): Short-term trend indicator.
EMA 200 (Blue Line - 83,743.52): Long-term trend indicator, currently above the price, indicating potential resistance.
Price Action & Prediction:
The price has touched the supply zone and is showing signs of rejection.
The blue projected path suggests a potential pullback followed by a drop toward the support zone (~82,260).
If price breaks below the support zone, further downside could be expected.
Potential Trade Idea:
Short Setup: If rejection at the supply zone continues, a short position could target the 82,260 support zone.
Long Setup: If price reaches the support zone and shows bullish reactions, a long position could aim for a rebound toward resistance.

BTC/USD - Bearish Break & Retest SetupMarket Overview :
Bitcoin (BTC/USD) has broken below a key consolidation zone after trading in a range between $90,000 - $108,000 for several weeks. The price is now attempting a retest of the previous support, which has turned into a resistance (supply zone) before a potential continuation to the downside.
Chart Pattern & Technical Setup:
📉 Break & Retest Structure: The price has broken below the previous range and is now testing the $87,000 - $91,000 resistance zone.
📉 Lower High Formation: BTC is expected to create a lower high before continuing its downward trend.
📉 Bearish Wave Projection: The chart suggests a zigzag movement, forming successive lower highs and lower lows, targeting $67,399 as the next support level.
Trade Setup:
Bias: Bearish
Entry: Sell limit at $87,000 - $91,000 (Supply Zone)
Stop Loss: Above $95,000 (Invalidation Level)
Take Profit: $67,399 (Next Key Support)
Confluences Supporting Bearish Bias:
✅ Supply Zone Rejection: The resistance area is likely to attract sellers.
✅ Market Structure Shift: A break below the previous range indicates a trend reversal.
✅ Lower High Confirmation: A rejection at resistance will confirm the bearish outlook.
Risk Management:
Risk-Reward Ratio (RRR): 1:3+
Position Sizing: Adjust based on risk tolerance.
Alternative Scenario:
A break and close above $95,000 would invalidate the bearish setup, signaling a potential bullish continuation.
📌 Disclaimer: This analysis is for educational purposes only. Always manage risk properly before entering a trade.

BTCUSD SELL signal. Don't forget about stop-loss.
Write in the comments all your questions and instruments analysis of which you want to see.
Friends, push the like button, write a comment, and share with your mates - that would be the best THANK YOU.
P.S. I personally will open entry if the price will show it according to my strategy.
Always make your analysis before a trade
