BITCOIN Next top is going to surprise you but it SHOULDN'T !!Bitcoin (BTCUSD) broke yet another benchmark, the psychological level of $100k. The market cap is growing and many claim that it can't keep rising as the capitalization would be at unrealistic levels. For one capital inflows seem to be very comfortable right now with BTC investments and there are still billions waiting at the side for the right investment in 2025.
Fundamentals aside, Bitcoin's historic patterns and price action gives us even more reasons to expect (much) higher prices and a Cycle Top that could surprise many.
** Fibonacci Channel Up **
First of all, we've plotted a Channel Up starting from BTC's first Bear Cycle and displayed the Fibonacci retracement levels on it. As you can see, those fit perfectly and catch each Cycle's tops and bottoms very accurately:
1) June 2011 Top on the 0.618 Fib. November 2011 Bottom on the 0.0 Fib.
2) December 2013 Top on the 1.0 Fib. August 17 2015 Bottom on the 0.382 Fib.
3) December 2017 Top on the 1.0 Fib. December 2018 bottom on the 0.5 Fib.
4) April 2021 Top on the 0.786 Fib. November 2022 bottom on the 0.236 Fib.
** Pi Cycle and MM Bands **
Then we have applied the Pi Cycle trend-lines 1 (orange) and 2 (green), which are key trend Resistance and Support levels respectively, combined with the MMB SD3 above (red trend-line) and MMB SD3 below (black trend-line), which are also historically almost the absolute Resistance and Support levels respectively. In the middle of all these is the 1W MA50 (blue trend-line), which during the Parabolic Rally phases (like the one we are currently on), is Bitcoin's main upward force.
** Covering at least 4 Fib ranges **
As you can see, all Cycles broke above at least the Pi Cycle trend-line 1 (orange) before making a Top. The first two Cycles even hit the MMB SD3 above (red). Also each Cycle has a proportional Fibonacci Channel level range, covering at least 4 Fib bands (as described above). Cycle 1 covered Fibs 0.618, 0.5, 0.382, 0.236 and 0.0. Cycle 2 covered Fibs 1.0, 0.786, 0.618, 0.5, 0.382. Cycle 3 also covered Fibs 1.0, 0.786, 0.618, 0.5, 0.382. Cycle 4 covered Fibs 0.786, 0.618, 0.5, 0.382, 0.236.
** Surprise Top **
The MMB SD3 above (red trend-line) is now below Fib 0.618 and it is less likely for BTC to hit it since Cycle 3 didn't. As a result, it is possible that the next Top will be on Fib 0.5 at best (maximum). If that is succeeded towards the end of 2025, and assuming that the Pi Cycle trend-line 1 (orange) breaks by then as it always has on every previous Cycle, that gives us a target range for the next Cycle Top within $250k - $350k!
Do you still think that's unrealistic? Feel free to let us know in the comments section below!
-------------------------------------------------------------------------------
** Please LIKE 👍, FOLLOW ✅, SHARE 🙌 and COMMENT ✍ if you enjoy this idea! Also share your ideas and charts in the comments section below! This is best way to keep it relevant, support us, keep the content here free and allow the idea to reach as many people as possible. **
-------------------------------------------------------------------------------
💸💸💸💸💸💸
👇 👇 👇 👇 👇 👇
Btcusdsignals

BTCUSD next possible move
🔑 "Success is not final, failure is not fatal: it is the courage to continue that counts." – Winston Churchill
Every success we achieve is just a step, not the final destination. Likewise, every failure is merely a temporary lesson, an opportunity to grow and improve 🌱.
🔥 What truly matters is our ability to persevere, to keep moving forward despite obstacles and setbacks. Those who succeed in the long run are those with the unbreakable courage to rise after every fall 🏆.
💪 Don’t fear failure. See it as a stepping stone to your future victories. Each challenge is a chance to become stronger, wiser, and more resilient.
✨ Keep moving forward with confidence and determination, because your true strength lies in that perseverance. 🚀

Scenario on BTC 12.12.24According to the previous scenario, I adjusted the levels a little and now it gives me a big short position scenario somewhere at the price of 93k, if we do not maintain this level, a move to the price of 87k is possible.

BITCOIN The Volatility Index points to strong consolidation nextLast time we analyzed Bitcoin (BTCUSD) in relation to the Volatility Index (VIX), was 4 months ago (August 22, see chart below) and was an extremely successful projection as we took advantage of the 1W MA50 (blue trend-line) bottom and predicted the $100k Target, which recently got hit:
Once more, we decided to seek the (mostly) negatively correlated patterns of VIX (chart on the right) to determine BTC's (chart on the left) price action in the coming months.
Based on VIX's Channel Down, the fact that it broke below its 1W MA50 (blue trend-line) and now is rebounding indicates that BTC may be entering a weekly consolidation phase. As you can see on VIX's chart, every time it broke below the 1W MA50 and started rising, Bitcoin entered a multi-week consolidation phase that sometimes was quick and others many months in length. Its 1W RSI is also at a level that relates to all those consolidation phases.
In our opinion this consolidation has more probabilities of being similar to December 04 2023 - January 29 2024, as the post August 2024 rally resembles more the rally that started on August 2023. This highlights the high degree of symmetry within Bitcoin's 2-year Channel Up.
If it continues to replicate that huge Bullish Leg, then we might as well see the rally peaking upon a +195.27% rise again. That could target $145000 by May 2025, which technically would also be marginally above the 1.5 Fibonacci Channel extension, similar to the March 11 2024 High.
So what do you think? Is it possible for Bitcoin to enter a multi-week consolidation now? Feel free to let us know in the comments section below!
-------------------------------------------------------------------------------
** Please LIKE 👍, FOLLOW ✅, SHARE 🙌 and COMMENT ✍ if you enjoy this idea! Also share your ideas and charts in the comments section below! This is best way to keep it relevant, support us, keep the content here free and allow the idea to reach as many people as possible. **
-------------------------------------------------------------------------------
💸💸💸💸💸💸
👇 👇 👇 👇 👇 👇

BTC/USD "BITCOIN" Crypto Market Bullish Heist PlanHola! Ola! My Dear Robbers / Money Makers & Losers, 🤑 💰
This is our master plan to Heist BTC/USD "BITCOIN" Crypto Market based on Thief Trading style Technical Analysis.. kindly please follow the plan I have mentioned in the chart focus on Long entry. Our target is Red Zone that is High risk Dangerous level, market is overbought / Consolidation / Trend Reversal / Trap at the level Bearish Robbers / Traders gain the strength. Be safe and be careful and Be rich.
Entry 📈 : Can be taken Anywhere, What I suggest you to Place Buy Limit Orders in 15mins Timeframe Recent / Nearest Low Point take entry should be in pullback.
Stop Loss 🛑 : Recent Swing Low using 4H timeframe
Target 🎯 : 110,000.0
Attention for Scalpers : Focus to scalp only on Long side, If you've got a lot of money you can get out right away otherwise you can join with a swing trade robbers and continue the heist plan, Use Trailing SL to protect our money 💰.
Warning : Fundamental Analysis news 📰 🗞️ comes against our robbery plan. our plan will be ruined smash the Stop Loss 🚫🚏. Don't Enter the market at the news update.
Loot and escape on the target 🎯 Swing Traders Plz Book the partial sum of money and wait for next breakout of dynamic level / Order block, Once it is cleared we can continue our heist plan to next new target.
💖Support our Robbery plan we can easily make money & take money 💰💵 Follow, Like & Share with your friends and Lovers. Make our Robbery Team Very Strong Join Ur hands with US. Loot Everything in this market everyday make money easily with Thief Trading Style.
Stay tuned with me and see you again with another Heist Plan..... 🫂

BITCOIN The three Expansion Phases of the Cycle.We have talked about Bitcoin (BTCUSD) hitting the $100k Target on numerous analyses and one of those was almost 4 months ago (August 26, see chart below), where we introduced the 2-year Channel Up, which has been the dominant pattern since the very beginning of the new Bull Cycle:
That piece of analysis was on the 1M time-frame but today we will examine it from the 1W perspective as the horizon narrows. We have made some slight modifications and the one that stands out is that we've classified it on Expansion Phases.
The key characteristic of those was the mid-Phase consolidation, which on the previous 2 took place within the 0.382 - 0.5 Fibonacci range, while the 1W RSI also turned sideways for the first time since the Channel Up bottomed.
With this marker, the consolidation phase is easily identifiable and according to it, we are currently on once. As a result, we can assume that we are within the 0.382 - 0.5 Fib range of Expansion Phase 3. This indicates that there is still plenty of room to rise. Based on that, a $150k Target is technically plausible before Summer.
So do you expect to reach 150000 so fast, if we do at all during this Cycle? Feel free to let us know in the comments section below!
-------------------------------------------------------------------------------
** Please LIKE 👍, FOLLOW ✅, SHARE 🙌 and COMMENT ✍ if you enjoy this idea! Also share your ideas and charts in the comments section below! This is best way to keep it relevant, support us, keep the content here free and allow the idea to reach as many people as possible. **
-------------------------------------------------------------------------------
💸💸💸💸💸💸
👇 👇 👇 👇 👇 👇

BTCUSD Correction may Continue Bitcoin briefly dipped below $94,000 earlier this week but recovered strongly, stabilizing around the $100,000 mark by Friday.
Despite these mixed sentiments this week, institutional demand remained strong, adding $1.72 billion until Thursday.
Bla bla bla!
The COO of Indian crypto exchange Giottustold FXstreet that the financial incentive for investors is to support adding Bitcoin to a company’s balance sheet.
Bitcoin (BTC) reclaimed the $100K level, trading near $100,100 on Friday after a recent decline earlier this week. The recent pullback in BTC was mostly due to high-leverage traders and some holders booking profits. Despite Microsoft’s rejection of adding Bitcoin to the company’s balance sheet, institutional demand remained strong, recording a total inflow of $1.72 billion until Thursday. Giottus COO Arjun Vijay highlighted the growing financial incentive for companies to adopt Bitcoin on their balance sheets.
Bitcoin reaction this week

BTC/USD "BITCOIN" Crypto Market Heist Plan on Bullish SideHi there! Dear Money Makers, Losers, and Robbers, 🤑 💰
Based on Thief Trading style technical analysis, here is our master plan to heist the BTC/USD "BITCOIN" cryptocurrency market. Please adhere to the strategy I've outlined in the chart, which emphasizes long entrance. Our aim is the high-risk Red Zone. Risky level, overbought market, consolidation, trend reversal, trap at the level where traders and bearish robbers are stronger. Be wealthy, cautious, and safe.
Entry 📈: Acceptable anywhere; I advise placing buy limit orders within a 15-minute window. The entry for the Recent/Nearest Low Point should be in pullback.
Stop Loss 🛑: Using the 4H period, the recent swing low
Goal 🎯: 110,000
Scalpers, take note: only scalp on the long side. If you have a lot of money, you can go straight away; if not, you can join swing traders and carry out the robbery plan. Use trailing SL to safeguard your money 💰.
Warning : Our heist strategy is incompatible with Fundamental Analysis news 📰 🗞️. We'll wreck our plan by smashing the Stop Loss 🚫🚏. Avoid entering the market right after the news release.
Take advantage of the target and get away 🎯 Swing Traders Please reserve the half amount of money and watch for the next dynamic level or order block breakout. Once it is resolved, we can go on to the next new target in our heist plan.
💖Supporting our robbery plan will enable us to effortlessly make and steal money 💰💵 Tell your friends and family to follow, like, and share. Boost the strength of our robbery team. Every day in this market make money with ease by using the Thief Trading Style.
I'll see you soon with another heist plan, so stay tuned 🫂

BTC/USD "BITCOIN" Crypto Market Heist Plan on Bearish SideOla! Ola! My Dear Robbers / Money Makers & Losers, 🤑💰
This is our master plan to Heist BTC/USD "BITCOIN" Crypto Market based on Thief Trading style Technical Analysis.. kindly please follow the plan I have mentioned in the chart focus on Short entry. Our target is Near the Green Zone that is High risk Dangerous level, market is oversold / Consolidation / Trend Reversal / Trap at the level Bullish Robbers / Traders gain the strength. Be safe and be careful and Be rich 💰.
Entry 👇 📉: Can be taken Anywhere, What I suggest you to Place Sell Limit Orders in 15mins Timeframe, Recent / Nearest High Point entry should be in pullback.
Stop Loss 🛑: Recent Swing High using 2H timeframe
Target 🎯 : 90,000
Attention for Scalpers : Focus to scalp only on Short side, If you've got a money you can get out right away otherwise you can join with a swing trade robbers and continue the heist plan, Use Trailing SL to protect our money 💰.
Warning : Fundamental Analysis news 📰 🗞️ comes against our robbery plan. our plan will be ruined smash the Stop Loss 🚫🚏. Don't Enter the market at the news update.
Loot and escape on the target 🎯 Swing Traders Plz Book the partial sum of money and wait for next breakout of dynamic level / Order block, Once it is cleared we can continue our heist plan to next new target.
💖Support our Robbery plan we can easily make money & take money 💰💵 Follow, Like & Share with your friends and Lovers. Make our Robbery Team Very Strong Join Ur hands with US. Loot Everything in this market everyday make money easily with Thief Trading Style.
Stay tuned with me and see you again with another Heist Plan..... 🫂

BITCOIN This is why $250k is a Cycle Top candidateBitcoin (BTCUSD) is now cruising on the Bull Cycle's most aggressive phase, the Parabolic Rally. We got the final confirmation as it broke above and now established the 1st Standard Deviation from Above (grey trend-line) of the Mayer Multiple Bands (MMB) as the new Support.
Having already broken above the previous All Time High (ATH) Resistance, every time BTC flipped the 1st SD into Support while above the ATH, it hit at least the 2nd SD (orange trend-line) before the Cycle Top was priced. This level is currently at $181700 but rising along with the trend
What adds a more specific dynamic to the potential Cycle Top though, is that during Bitcoin's 11-year Higher Lows trend-line growth, it posted rallies of at least +1719% on each Cycle. As the Cycles progressed and due to the Law of Diminishing Returns, this rally started lower each time.
This shows the great significance of this rally and as a result, on the current Cycle with can estimate from its very bottom (November 2022). This suggests that we can reach at least $250k before or around the time the 2nd SD is tested. In addition, all Cycles have topped after the 1M RSI makes contact with its historic Lower Highs trend-line.
So what do you think? Is $250k a strong candidate for a Cycle Top? Feel free to let us know in the comments section below!
-------------------------------------------------------------------------------
** Please LIKE 👍, FOLLOW ✅, SHARE 🙌 and COMMENT ✍ if you enjoy this idea! Also share your ideas and charts in the comments section below! This is best way to keep it relevant, support us, keep the content here free and allow the idea to reach as many people as possible. **
-------------------------------------------------------------------------------
💸💸💸💸💸💸
👇 👇 👇 👇 👇 👇

BTCUSDT Swing trade SignalHello everyone i want hare my bitcoin swing trade idea.
Bitcoin had huge liquidity to downside which was for active new buyers plus it tested last week Fibonacci buy levels where it got aggressive reaction.
Open long position at 98181
Stop loss at 96800
Take profit i will stay ion this trade until new year if i will be right.
Always manage your risk!!! Don't risk more than 2 % in this trade.

BITCOIN nothing to stop it now! Can top anywhere inside 250-400kMore than 1 year ago (September 05 2023, see chart below), we published the following Bitcoin (BTCUSD) idea, which very illustratively presented the potential course of the new Bull Cycle:
As you can see, BTC managed to trade an entire year rising within this green Arc pattern and always below the Cyclical Pivot trend-line that emerged from the bottom of the 2018 Bear Cycle.
We made the last update on this chart last August (20 2024), where we called the end of the 5-month correction since March and the start of the new Phase (final Parabolic Rally) of the Bull Cycle.
** The key hold of the 1W MA50 **
The key for that call was the fact that the 1W MA50 (blue trend-line) held twice during the August sell-off and supported. As you can see, on all of BTC Bull Cycles, the 1W MA50 has been supporting post Halving and never broke until after the Top and the start of the new Bear Cycle.
** Symmetry of pre and post-Having **
Given that historically the Bull Cycle lasts post-Halving almost the time it lasted from the bottom to the Halving, we should expect its top around December 2025 - January 2026 and if it is on the Cyclical Pivot trend-line, then it could be as high as 400k.
However, even on a less optimistic scenario where it lasts 1064 days (152 weeks) from the Bottom (not counting FTX crash), like the 2015 - 2017 Bull Cycle, we can expect a peak a little over $200000 on the Cyclical Pivot trend-line.
** The 1W RSI series of Tops **
It is important to notice that the 1W RSI is recovering from the overbought volatility correction, having dropped from a massively overbought 88.50 High (March 04) to a practically bearish 45.00 Low (September 02). As this chart shows, BTC tends to top on levels similar to the first 1W RSI of the Cycle, so there is still a lot of way to go before it tops, especially if it follows the 2015 - 2017 Bull Cycle, which had four almost symmetrical such Tops.
But what do you think? Are you also expecting Bitcoin to top anywhere within a $250 - $400k range? Feel free to let us know in the comments section below!
-------------------------------------------------------------------------------
** Please LIKE 👍, FOLLOW ✅, SHARE 🙌 and COMMENT ✍ if you enjoy this idea! Also share your ideas and charts in the comments section below! This is best way to keep it relevant, support us, keep the content here free and allow the idea to reach as many people as possible. **
-------------------------------------------------------------------------------
💸💸💸💸💸💸
👇 👇 👇 👇 👇 👇

BTC Trade Idea: Reversal Zone Market Context:
Bitcoin is approaching an uncharted territory between 101970 and 110200, where no historical resistance exists due to the all-time high level. This zone is psychologically significant and likely to attract profit-taking from early buyers and aggressive short-sellers, making it a prime area for potential reversals or consolidation.
Trade Setup:
Entry Strategy:
Short Position: Wait for signs of exhaustion, such as:
Large wicks on higher timeframes (e.g., 4H or daily).
Bearish candlestick patterns (e.g., shooting star, bearish engulfing).
Momentum indicators showing bearish divergence (e.g., RSI or MACD).
Enter a short position near the upper bound of 110200, with partial entries near 101970 if signs of weakness appear earlier.
Stop-Loss:
For shorts: Place stop-loss above 111500, beyond potential fake-outs.
For longs (breakout play): Place stop-loss below 109500, assuming the breakout level holds as support.
Adjust position size based on volatility within the zone.
Additional Notes:
Volume Confirmation: Monitor trading volume—high volume near resistance could signal a breakout, while declining volume might confirm a reversal.
Macro Events: Watch for macroeconomic news or crypto-specific developments that could drive speculative momentum in this region.
This setup assumes high volatility and requires active monitoring for precise entries and exits.

Scenario BTC 6.12.There are two main scenarios: either the support at 0.786 breaks through and we go for another ATH, or the support holds and we can watch for a possible correction. If that happens, we can test the levels somewhere around the previous low and if the trendline breaks, we can test the levels around 87k, but we are currently waiting for further signals.

BITCOIN Where were you when it broke $100000 ??It is officially history! Bitcoin (BTCUSD) finally broke the ultimate (until the next one!) psychological level of $100000. A price tag that was discussed as myth/ desire/ utopia not so many years ago. Perhaps the level that will go down in history as the future global currency's transition from its retail to the institutional phase (thanks Blackrock!) and on its way towards an eventual mass adoption (Amazon, X, Netflix and others are you listening?).
Well this post isn't an analysis. It's a festive one, a well deserved round of victory for HODLers who ignored for so many year the pessimists, the negative ones, the "Bitcoin is a scam", "Bitcoin is a fraud", "Bitcoin is going to zero" ones and kept holding. And those who will keep holding until perhaps $1000000? Who knows? Who can now deny it??
Well, lets have it. In the future you are going to hear the following a lot.
"Where were you daddy/ mommy/ grandpa/ grandma, when Bitcoin broke $100000?"
Indeed, and it will be a valid question. This will be bigger than the classics of why didn't you buy Amazon, Google etc in the late 90s/ early 00s. Or Gold in the early 1900s (yes great grandpa, that's for you!).
So let's wrap it up and this is a call for all of you to answer it and make a fun discussion in the comments section below:
" WHAT WERE YOU DOING WHEN BITCOIN BROKE $100k??? "
-------------------------------------------------------------------------------
** Please LIKE 👍, FOLLOW ✅, SHARE 🙌 and COMMENT ✍ if you enjoy this idea! Also share your ideas and charts in the comments section below! This is best way to keep it relevant, support us, keep the content here free and allow the idea to reach as many people as possible. **
-------------------------------------------------------------------------------
💸💸💸💸💸💸
👇 👇 👇 👇 👇 👇

BITCOIN repeating the November 2023 Channel and targets $140kBitcoin (BTCUSD) has been trading within a Channel Up in the past three weeks, basically for the majority of the month of November, following the U.S. elections. It may been struggling currently to break above the $100000 psychological barrier but historical patterns are in favor of a break-out as the very same Channel Up was formed exactly 1 year ago and paved the way for the March 14 2024 High.
** August 2023 vs August 2024 **
As you can see basically, BTC's whole sequence since the August 05 2024 Low is very similar to the one that started again a year before that in August 2023. The similarities are uncanny. Both fractals started with an August decline below the 1D MA200 (orange trend-line), bottoming inside a Cup pattern that initiated an Accumulation Process. At the same time, the 1D RSI was waving a Bullish Divergence as it has been rising on Higher Lows.
** Golden Cross to November Channel Up **
A 1D Golden Cross was formed right when the November Channel Up patterns emerged. By that time, the price was already on the 2.0 Fibonacci extension of the August decline. At the moment we are on the stage past a 1D MACD Death Cross, which led to a December bullish break-out to a new High.
** Next step = $140k **
A mere test of the 3.0 Fibonacci extension, would translate to a $140k price tag on Bitcoin. Based on the striking similarities and extremely high degree of symmetry with the pattern a year ago, it may become a reality as early as February 2025.
But what do you think? Is symmetry with last year about to kick in and force a bullish break-out to 140k? Feel free to let us know in the comments section below!
-------------------------------------------------------------------------------
** Please LIKE 👍, FOLLOW ✅, SHARE 🙌 and COMMENT ✍ if you enjoy this idea! Also share your ideas and charts in the comments section below! This is best way to keep it relevant, support us, keep the content here free and allow the idea to reach as many people as possible. **
-------------------------------------------------------------------------------
💸💸💸💸💸💸
👇 👇 👇 👇 👇 👇

BITCOIN $150k doesn't seem so unrealistic now, does it?Almost 4 months ago (August 14, see chart below), we made a bold prediction of a Bitcoin (BTCUSD) target at $150000 by early 2025, while the price was still at $60k:
This was received with a lot of skepticism at the time but with the price now almost on the $100k psychological barrier, the idea looks more and more realistic. It is time to revisit this chart and made some slight modifications based on the price action that was followed.
The price is now off the 0.786 - 1.0 Fibonacci range where it consolidated from March 2024 until October 2024. The enormous rise/ break-out is attributed of course to a large extent on the U.S. elections and the euphoria that followed. We are only 1 month outside this range and the price is already much higher.
Last month's candle is very similar to November 2020 and May 2017. In comparison, that was when the most aggressive (parabolic) rallies of those Bull Cycles started. In 2017 from May to December, it was on a 71.5° angle. On the next Cycle from November 2020 to April 2021, it was on a 68.5° angle, i.e. 3° lower. If that's a progression by any means, then we can assume that the 2024 - 2025 parabolic rally could be on a 65.5° angle (-3° from the previous Cycle). That gives a potential target of $300k as early as May 2025, assuming we could have a Double Top Cycle as in 2021.
In any case, it will be interesting to see if the current Cycle also makes a blow-off top (like the last two) outside/ above the Channel Up that started back on the December 2013 High. Unrealistic as it may seem now, the $150k Target is very plausible technically as it is just below the top of that multi-year Channel Up. If the $300k blow-off top (red Arcs) comes, then all the better, but a long-term investor may consider to start taking profits while the price is inside the Channel Up and starts being cautious once we break above it in the red Arcs.
So what do you think? Do you view $150k as technically realistic as this pattern indicates? And if so, can Bitcoin even make a blow-off top near $300k? Feel free to let us know in the comments section below!
-------------------------------------------------------------------------------
** Please LIKE 👍, FOLLOW ✅, SHARE 🙌 and COMMENT ✍ if you enjoy this idea! Also share your ideas and charts in the comments section below! This is best way to keep it relevant, support us, keep the content here free and allow the idea to reach as many people as possible. **
-------------------------------------------------------------------------------
💸💸💸💸💸💸
👇 👇 👇 👇 👇 👇

Bitcoin tends to falter the day after ThanksgivingThe 124k target remains in play overall, but for now I suspect the shakeout from its 100k milestone has more to offer bears. And while bitcoin prices are showing a nice breakout from a flag pattern on the 1-hour chart, bulls should take note that today (the day after Thanksgiving) tends to be a bearish day on average. And that could make any moves towards 100k tempting for bears to fade into over the near term.
MS

BITCOIN (BTCUSD): The First Buying Opportunity
Following our yesterday's support and resistance analysis for BTC,
the market is currently approaching a key daily horizontal support.
After its test, I see a clear intraday sign of strength of the buyers
with a formation of an ascending triangle pattern on an hourly time frame.
I expect a bullish movement at least to 94400
❤️Please, support my work with like, thank you!❤️

BITCOIN rejected on the 1st real Resistance of the Bull Cycle.Yesterday's brutal Bitcoin (BTCUSD) rejection caught the majority of the market off guard. There are a few fundamental reasons, there is the exhaustion of the post-election euphoria, there is the psychological weight of the $100000 barrier. However there is one major technical reason that has gone under the radar and we'll explain it to you below.
** The Fibonacci Channel and the 0.236 Fib **
As you can see on this chart, the underlying pattern has been a Fibonacci Channel going through the last 3 Cycles (including the current one). The pattern started with a strong rebound on its bottom (green circle) that formed the December 2013 Top. That Cycle Top was on the 0.236 Fibonacci level of the Cycle and that is a level that rejected rallies during Bull Cycles on June 24 2019 and May 11 2024.
** The '1st Real Resistance of the Bull Cycle' **
That is the Fib trend-line that (more recently) rejected the uptrend on November 22. We can call this the '1st Real Resistance of the Bull Cycle' as this is the first major rejection level that a Bull Cycle faces before the eventual Top. That high during the last 2 Cycles has been on the 0.0 Fibonacci level, technically the top of the Channel (red circles). The red spot on the current Cycle in late 2025 doesn't represent a projection but is an illustration for comparison purposes.
** Top timing and the 1W MA50 **
On a side-note, it is interesting to observe that the duration of each of the past Bull Cycles has been roughly 150 weeks (1050 days) so a repeat of this pattern would give us a High towards the end of September/ early October. It is much better to try to time the High and sell that put an actual price tag on it. Equally interesting is the fact that even though BTC is on a technical rejection, the current rally started on the August 05 2024 Low, exactly on the 1W MA50 (blue trend-line). Technically, as long as this trend-line holds, the cyclical bullish wave should stay intact.
But what do you think? Do you think the 0.236 Fib i.e. the '1st Real Resistance of the Bull Cycle' will extend the correction? Feel free to let us know in the comments section below!
-------------------------------------------------------------------------------
** Please LIKE 👍, FOLLOW ✅, SHARE 🙌 and COMMENT ✍ if you enjoy this idea! Also share your ideas and charts in the comments section below! This is best way to keep it relevant, support us, keep the content here free and allow the idea to reach as many people as possible. **
-------------------------------------------------------------------------------
💸💸💸💸💸💸
👇 👇 👇 👇 👇 👇

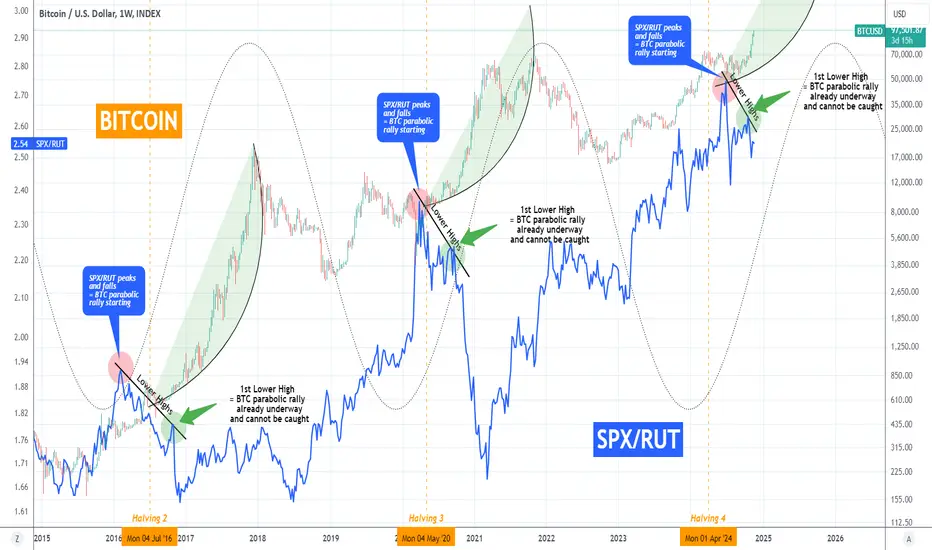
BITCOIN rally cant get caught anymore and SPXRUT ratio shows whyIt's beyond doubt now that Bitcoin (BTCUSD) has started the new Parabolic Rally (PR), technically the most aggressive phase of the Bull Cycle. We've made numerous analyses in the past explaining on time why we expected this break-out to take place after 7 months of accumulation.
What we bring to you today is the SPX/RUT ratio, the correlation of the S&P500 (SPX) and Russell 2000 (RUT) indices against BTC and how it confirms that this rally will now accelerate to a pace that it won't be easy to get caught (i.e. bought).
The SPX/RUT ratio is displayed by the blue trend-line. The ratio is particularly helpful during Bitcoin's Parabolic Rally phase as their correlation is mostly a negative one, meaning when the ratio falls, Bitcoin rises. On this chart, this correlation is present on a cyclical basis. This means that during every Cycle, it displays a behavioral pattern that is common.
The key characteristic here is the Lower Highs pattern that the ratio forms every Cycle around the Halving time. As you can see, when SPX/RUT peaks (red circle) and starts forming Lower Highs, Bitcoin stars its Parabolic Rally (green arc). On the 1st Lower High, BTC's rally is already underway and has entered the stage where due to the sheer buying pressure and aggression, getting an entry is difficult. The Lower Highs on SPX/RUT also signify a shift from big capitalization stocks to low, i.e. an increasing appetite for riskier assets and that transcends to the Bitcoin market as well.
So what do you think? Does the SPX/RUT ratio indicate that we've started the part of BTC's rally that is hard to catch? Feel free to let us know in the comments section below!
-------------------------------------------------------------------------------
** Please LIKE 👍, FOLLOW ✅, SHARE 🙌 and COMMENT ✍ if you enjoy this idea! Also share your ideas and charts in the comments section below! This is best way to keep it relevant, support us, keep the content here free and allow the idea to reach as many people as possible. **
-------------------------------------------------------------------------------
💸💸💸💸💸💸
👇 👇 👇 👇 👇 👇
BITCOIN Pi Cycle Theory aiming at $120k at least!Following Bitcoin's (BTCUSD) new All Time High in the aftermath of the U.S. elections, we've established on previous posts that we've entered the final year (12 months) of this Bull Cycle. This is clearly visible by the use of the Sine Waves as shown on this 1W chart.
** Pi Cycle **
The new aspect we're bringing to you today is the Pi Cycle indicator, which has proven to be as consistent as any other at projecting the long-term price action of Bitcoin. As you can see every Cycle Top has been considerably above the Top Pi Band (red trend-line) and we're currently trading $30k below where this level is now. This means that it is only a matter of time for BTC to 'attack' $120k and break it.
** 1W RSI kickstarting the aggression **
We are at a point where the new rally phase that started after the price tested, held and rebounded on the 1W MA50 back in early August, will start getting more and more aggressive. The final bullish signal was given last week after the 1W RSI closed above 70.00 (vertical orange dashed line). As you can see, during the previous two Cycles, every time Bitcoin closed the 1W RSI above 70.00, the Cycle peaked 54 weeks later (roughly 365 days). There is no reason to expect otherwise this time also, as this projected date (week of November 24 2025) falls exactly on the Sine Wave's Top.
Notice also that during the most aggressive part of the Parabolic Rally, the 1D MA100 (blue trend-line) tends to Support. And before that, when that crosses above the Bottom Pi band (green trend-line), the indicator gives a confirmed buy signal for the whole Cycle.
** Timing the market is everything **
The question now is how high can the price get? Well according to those estimates, a peak above the Top Pi Band can be anywhere within the $150k - $200k range, and that could be a conservative estimate. But lucky enough, with technical tools like the one we present to you today, we can time the market (thus our exits/ sells) almost perfectly and get out as high as possible, without having an absolute Target in mind.
But what do you think? Are you also expecting the rally to start getting even more aggressive and break above $120k? Feel free to let us know in the comments section below!
-------------------------------------------------------------------------------
** Please LIKE 👍, FOLLOW ✅, SHARE 🙌 and COMMENT ✍ if you enjoy this idea! Also share your ideas and charts in the comments section below! This is best way to keep it relevant, support us, keep the content here free and allow the idea to reach as many people as possible. **
-------------------------------------------------------------------------------
💸💸💸💸💸💸
👇 👇 👇 👇 👇 👇

BITCOIN Riding the 1DMA50 wave is the best strategy you can haveBitcoin (BTCUSD) has had an enormous bullish break-out to new All Time Highs (ATH) following last week's U.S. elections. The past 2 days have seen this massive rally turn sideways and as always a certain part of market participants have started calling for big corrections or even bear markets. Once again we will let simple charting show why this sideways price action is nothing but a short-term and mostly necessary consolidation.
** November 2020 vs November 2024 **
This analysis is a comparison of BTC's October 2020 - April 2021 rally with October 2024 - today. We've made idea regarding those time periods in the past but this time we bring a more aggressive picture on the 1D time-frame.
As you can see, on both fractals the 1D RSI started with a Channel Up while the price was still trading sideways/ consolidating within the 1W MA50 (red trend-line) and the Resistance level. That was the first sign of the upcoming Parabolic Rally, which was confirmed after the price broke above the Resistance.
BTC formed a Channel Up itself and right now we are on the November Bullish Leg and its consolidation phase (circle) that has been evident on both fractals. The 2020 - 2021 rally lasted for 164 days after November 01 and rose by +395%.
** The key role of the 1D MA50 **
Even if these time and price lengths aren't replicated, the key here for traders and investors alike is this: From October 09 2020 up until April 18 2021, BTC neve closed a 1D candle below its 1D MA50 (blue trend-line). It was the 1D MA50 that fully supported this 6-month rally, giving excellent buy entries for those seeking dip buying opportunities or those who simply wanted to hold onto their BTCs for as high as possible.
** Just ride the wave **
As a result, a viable and confirmed strategy at this stage of the Cycle (if you don't want to trade the volatility and buy low/ sell why) could be to just sell when finally a 1D candle closes below the 1D MA50. This is what we effectively call 'riding the 1D MA50 wave'.
So what do you think? Are you prepared to hold until the 1D MA50 breaks, are you willing to buy every time the price gets close to it, or simply have a different strategy at this starge? Feel free to let us know in the comments section below!
-------------------------------------------------------------------------------
** Please LIKE 👍, FOLLOW ✅, SHARE 🙌 and COMMENT ✍ if you enjoy this idea! Also share your ideas and charts in the comments section below! This is best way to keep it relevant, support us, keep the content here free and allow the idea to reach as many people as possible. **
-------------------------------------------------------------------------------
💸💸💸💸💸💸
👇 👇 👇 👇 👇 👇
