BTCUSD: Looking for Shorting OpportunitiesBTCUSD has recently experienced a significant rise. Just like gold, after a large increase, a correction is inevitable. Today, I captured some profits from the pullback. Going forward, during the market fluctuations, pay attention to the previous highs or the resistance zone after breaking the highs. If your account allows, you can consider shorting, but be sure to manage the risk carefully.
Btcusdsignals

BTC AND TRUMP+ SUPPLY A HISTORICAL NEW ATH coming HELLO TRADERS
As i can see it time to join the trend BTC Volume is boosting in markets and nailed everywhere we can see technically fib retracement give us a clear view on chart the last dip was already taken and market continues its bull run as it was not like previous halving after dips but for bears it was a nice retracement of near 25000 points If we see geopolitical around the world and current BTC demand vs Supply and Governments and some big companies are accumulating BTC day by day US election will create a spike move in BTC to the given targets if TRUMP get elected Elon Musk is supporting TRUMP Campain with 400+ MILLION $ and watching graphically charts for voting showing a Trump winning rate is growing BTC attracting many other new investors in markets BTC Dominance growing if this happens technically its now breaking down trend line to the up side and holding support above the 60K which is a good sign also for continuations of bull run so don't miss the train we are still early make a proper search before taking any trade it's just a trade idea with good R:R Stay tuned for more updates

BITCOIN Can it repeat last year and reach $140000?It was less than a month (October 14, see chart below) when we updated our old Bitcoin (BTCUSD) Channel Up idea of June 07, calling for the confirmed start of the new Bullish Leg of the Channel Up and setting a medium-term Target of $94500:
New evidence following the U.S. elections suggest that the aggressive nature of the past weekly rally can see BTC target even higher, more specifically the top of the Channel Up by Q2 2025.
As you can see, the price is currently between the 0.5 - 0.618 Fibonacci Channel range, which is technically a neutral zone. However it is considerably below the 0.618 horizontal Fib level applied on a potential +198.10% rise (same as the Sep 2023 - March 2024 rally). This showcases the enormous upside potential that exists within this 2-year Channel Up.
The RSI is about to enter the Overbought Zone (>70.00), which when the previous two Bullish Legs started was also while the price was below the 0.618 Fib (especially in the case of the October 20 2023 candle).
As a result, even though our 94500 medium-term Target stands, for the long-term we are targeting 140000, which is almost at the top of the 2-year Channel Up and marginally below a potential +198.11% rise. Notice that the two lengthy corrections (green Rectangles) within the pattern started only when the RSI formed a Lower High below the overbought level (<70.00).
So what do you think? Is Bitcoin still so undervalued at the moment, despite last week's surge, that it can even hit $140k? Feel free to let us know in the comments section below!
-------------------------------------------------------------------------------
** Please LIKE 👍, FOLLOW ✅, SHARE 🙌 and COMMENT ✍ if you enjoy this idea! Also share your ideas and charts in the comments section below! This is best way to keep it relevant, support us, keep the content here free and allow the idea to reach as many people as possible. **
-------------------------------------------------------------------------------
💸💸💸💸💸💸
👇 👇 👇 👇 👇 👇

BTCUSDT: Small Correction Possible Before UptrendBTCUSDT(Day Chart) Technical analysis update
BTC's price has been trading within a broadening wedge pattern for the last 160 days. Recently, it bounced off the wedge's support and is now trading at the GETTEX:59K level. We can expect a small correction before the next upward move, with the price possibly touching the $55K level before resuming a bullish trend.
Regards
Hexa

BITCOIN made new ATH and the rally has only just begun!Bitcoin (BTCUSD) is marching towards our 88k short-term Target as we called on October 16 (see chart below):
As the U.S. elections have now been concluded with Trump's victory, we can now once more focus on the long-term horizon, particularly looking 1 year ahead.
Basically, the last time we looked at this pattern was back in August 14 2023 (see chart below), where we used the KSI indicator on the 3W time-frame, which has just made a Bullish Cross, to call the upcoming parabolic rally correctly:
This time we bring to you the last bullish signal of the upcoming multi-month Parabolic Rally, which is the 2W LMACD that is about to form a Bullish Cross. As you can see such a Cross was formed exactly on the November 08 2016 U.S. elections (Trump's 1st win), and a few months before the November 03 2020 elections. What followed was the most aggressive rally (green Rectangle area) of the Bull Phase (green parabolic channel) that started when the price broke above the 2W MA50 (blue trend-line).
As a result, we expect BTC to rise aggressively from here, entering the post-U.S. elections bullish phase that may very well exceed the $100k psychological barrier, as we've shown in previous analyses.
But what do you think? Will the new ATH today spark a full year of Bull for Bitcoin? Feel free to let us know in the comments section below!
-------------------------------------------------------------------------------
** Please LIKE 👍, FOLLOW ✅, SHARE 🙌 and COMMENT ✍ if you enjoy this idea! Also share your ideas and charts in the comments section below! This is best way to keep it relevant, support us, keep the content here free and allow the idea to reach as many people as possible. **
-------------------------------------------------------------------------------
💸💸💸💸💸💸
👇 👇 👇 👇 👇 👇

Bitcoin Cycle Repeat? 1 Year Bull Run Above ATH Ahead!In the chart above, we’re comparing Bitcoin’s current cycle with its previous cycle.
Bear Run (1 Year): The previous cycle started with a significant bear market that lasted exactly 1 year, characterized by a sharp drop in price from the peak.
Recovery Phase (2 Years): Following the bear run, Bitcoin spent 2 years in a recovery and consolidation phase, gradually building a support base and regaining momentum.
Bull Run Above ATH (1 Year): After consolidation, Bitcoin entered a 1-year bull run that pushed it above the previous all-time high (ATH), setting new records.
Current Bitcoin Cycle: The current cycle appears to be mirroring the previous one closely:
We’ve had a 1-year bear run, which aligns with the pattern seen in the previous cycle.
This was followed by 2 years of recovery, with the price consolidating and gradually strengthening.
If the pattern continues, we could be entering 1 year of a bull run above the previous ATH, starting now or very soon.
Based on this repeating cycle pattern, the current setup suggests that we might have 1 year of a strong bull market ahead, potentially pushing Bitcoin above its previous all-time high by late 2025.
Regards
Hexa

BTCUSDT Bullish Wedge Pattern!BINANCE:BTCUSDT has formed a falling wedge pattern on the 1-hour chart, with strong support at the bottom of the wedge around $67,000. The price has already broken out of the pattern and is now retesting the wedge resistance. Additionally, BTC has crossed above the 100 EMA on the 1-hour chart, indicating potential bullish momentum. We can expect a strong upward move from the current level.
Regards
hexa

When to Book Profits in Bitcoin?Bitcoin technical analysis update
Historically, when Bitcoin's monthly RSI reaches overbought levels, the price tends to drop. In 2013, the RSI peaked at 97, in 2017 it reached 95, and in 2021, it topped at 92.5, forming a higher low divergence on the monthly chart. This time, if the RSI reaches the 90 level, it could signal another peak for Bitcoin. When the RSI reaches the 89-90 range on the monthly chart, it’s typically a good time to start booking profits. Currently, the RSI is at 63, suggesting there is still room for a price increase in the coming months.
Regards
Hexa

BITCOIN fully supported targeting $170k after the ATH breaks.Exactly 3 months ago (August 05, see chart below) when the price was on the 1W MA50 (blue trend-line), having hit it for the first time since the week of March 12 2003, we claimed that this was the last stand for Bitcoin (BTCUSD) if the market wanted to maintain the Bull Cycle, as based on the previous 3 Cycles, it was the absolute supporting trend-line:
The 1W MA50 eventually held not once but twice and that gave way to a rally that last week tested the 73800 All Time High (ATH). That is incredibly bullish, especially only two days before the U.S. elections, as from the historic patterns we've shown you before, a Parabolic Rally has started after each election.
So according to our August comparison chart, if history is repeated, BTC is looking towards at least the 1.618 Fibonacci extension from the ATH, which is roughly a little over $170k.
But what do you think? Are you expecting the ATH test to start a massive rally similar to all previous Cycles? And if so, is $170000 a realistic Target? Feel free to let us know in the comments section below!
-------------------------------------------------------------------------------
** Please LIKE 👍, FOLLOW ✅, SHARE 🙌 and COMMENT ✍ if you enjoy this idea! Also share your ideas and charts in the comments section below! This is best way to keep it relevant, support us, keep the content here free and allow the idea to reach as many people as possible. **
-------------------------------------------------------------------------------
💸💸💸💸💸💸
👇 👇 👇 👇 👇 👇

BITCOIN Closed 2 straight green 1M candles after 7 months!Bitcoin (BTCUSD) is closing today the monthly (1M) candle and unless it drops by 7000 in a few hours, it will close the month of October in green. That will be the 2nd straight green 1M candle since March!
This 7 month consolidation period is no stranger to BTC as such patterns, where there are no straight green 1M candles, are standard Accumulation Phases that we see during Bull Cycles. So far on the current one we've had three (including March 2024) and once the market closed 2 straight green 1M candles, it rallied.
The 2019 - 2021 Bull Cycle had three such straight green candle occasions and a very clear Accumulation Phase, while the 2015 - 2018 Cycle had numerous. One thing is clear based on this multi-year chart. When the market closes two straight green 1M candles, it is always a good signal to buy.
But what do you think? Do you find this indicator reliable? Are you buying based on this? Feel free to let us know in the comments section below!
-------------------------------------------------------------------------------
** Please LIKE 👍, FOLLOW ✅, SHARE 🙌 and COMMENT ✍ if you enjoy this idea! Also share your ideas and charts in the comments section below! This is best way to keep it relevant, support us, keep the content here free and allow the idea to reach as many people as possible. **
-------------------------------------------------------------------------------
💸💸💸💸💸💸
👇 👇 👇 👇 👇 👇

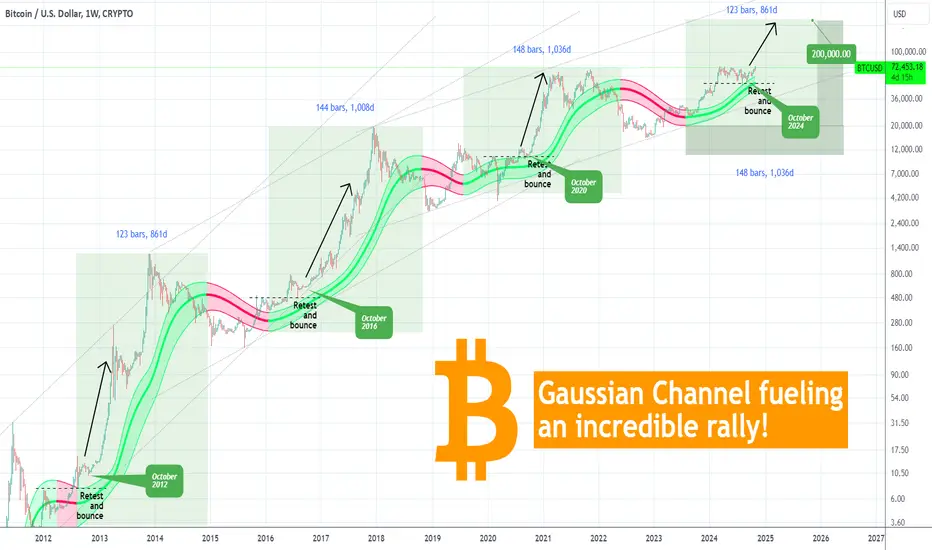
BITCOIN Gaussian Channel telling you the rally has already begunBitcoin (BTCUSD) is illustrated here on the 1W time-frame from the 2011 Cycle until today. We've used the Gaussian Channel (GC) after a long time and the reason is simple. Since the August 05 2024 Low, it has been supporting the uptrend up to today's test of the All Time High (ATH).
** Gaussian October support every 4 years **
This continuous support is a critical feature moving forward as every time the GC held at this stage of the previous Cycles (October 2020, 2016 and 2012), BTC started its final (and most aggressive) Parabolic Rally of the Cycle.
** Resistance turned Support **
What's equally interesting is that during those stages, the price also re-tested and held the former Resistance (of the previous Higher High), turned it into a Support (while the GC held) and bounced to the Parabolic Rally. This is a remarkably consistent feature taking place every 4 years!
** The green GC length matters **
Now as to the GC in more detail. What we want you to keep from it, is that the green part of the GC has lasted in the previous Cycles 123, 144 and 148 weeks respectively, which translates to 861, 1008 and 1036 days, until it turned red. As a result, we can expect the current green phase to last until December 08 2025 (minimum) and June 01 2026 (maximum). It is more reasonable to expect the longer case as the recent Cycles tend to have stabilized most of their common time patterns.
The Bear Cycle tends to start when a 1W candle is closed below the GC. Until then, based on the parallel Channel Up patterns that encompass 3 Cycles each time, we can even expect a price as high as $200000 for this Cycle Top.
Do you think that's realistic? And if so, do you also expect the GC wave to support a parabolic rally all the way to the top? Feel free to let us know in the comments section below!
-------------------------------------------------------------------------------
** Please LIKE 👍, FOLLOW ✅, SHARE 🙌 and COMMENT ✍ if you enjoy this idea! Also share your ideas and charts in the comments section below! This is best way to keep it relevant, support us, keep the content here free and allow the idea to reach as many people as possible. **
-------------------------------------------------------------------------------
💸💸💸💸💸💸
👇 👇 👇 👇 👇 👇
$BTCUSDT Bouncing from Demand Zone – Eyes on $75KBINANCE:BTCUSDT Bouncing from Demand Zone – Eyes on $75K with Strong ETF Inflows!!
After a significant uptrend, CRYPTOCAP:BTC experienced a healthy correction, finding support at a key demand zone. The current bounce from this level, marked by a bullish candle, signals a potential shift towards upward momentum. Volume is steadily increasing, which further strengthens the case for a continued move higher.
Additionally, there’s a notable rise in MARKETSCOM:BITCOIN ETF inflows, adding more fuel to the current rally. This confluence of bullish factors sets the stage for BTC to reach new highs, with $75,000 being the next major target on the horizon. Traders should watch for sustained volume and momentum as key indicators of this breakout.

Bitcoin (BTCUSDT) - 4H Timeframe - Massive Target Achieved!The Bitcoin (BTCUSDT) 4-hour chart reveals a successful long trade setup, with all pre-determined targets reached. Here's a breakdown of the key technical elements that guided this trade:
Entry Point: Positioned at $61,732.3, the trade setup aimed to capitalize on a bullish momentum, as indicated by strong support above the Risological dotted trend line.
Stop Loss: Strategically set at $60,316.2 to limit downside exposure while providing room for price fluctuation.
Target Points:
TP1: $63,482.7
TP2: $66,315.0
TP3: $69,147.4
TP4: $70,897.7 (final target successfully hit, confirming strong upward momentum
)
Volume Analysis: The trading volume stands at 56.92K, with an average of 120.91K over the past 30 days, indicating a slightly below-average activity level, yet sufficient to support the trend.
Bitcoin's successful breach through each target highlights robust bullish sentiment. Monitoring future price action will be crucial to gauge the sustainability of this trend, especially considering potential resistance levels post-TP4.

BTC FALLINGIs Now the Right Time to Sell Bitcoin?
As Bitcoin continues to experience significant volatility, many investors are wondering if now is the moment to cash in on their holdings. While Bitcoin has delivered impressive gains for early adopters, the unpredictable nature of the cryptocurrency market presents both risks and opportunities. Selling Bitcoin at current levels could allow investors to lock in profits, diversify portfolios, and reinvest in more stable assets.
Market analysts point to increased regulatory scrutiny, fluctuating investor sentiment, and macroeconomic conditions as factors that could impact Bitcoin’s future price trajectory. For those looking to reduce exposure to risk, selling BTC now can offer a strategic exit while prices remain elevated.
Ultimately, the decision to sell Bitcoin depends on individual financial goals and risk tolerance. However, with the market’s inherent unpredictability, acting sooner rather than later could provide a chance to capitalize on gains and explore other high-potential investments.

BITCOIN All indicators aligned for an incredible 12-month rallyBitcoin (BTCUSD) broke last week above its 7-month Bearish Megaphone pattern, which was essentially the pattern that absorbed via a relief pull-back the incredible rally that the market had since October 2023, fueled at large by the ETF speculation and then launch.
** Bearish Megaphones inside 7-year Channel Up **
This pattern is, as you can see, part of a greater 7-year Channel Up that encompasses the last two Cycles of BTC. Halfway through the 2018 - 2021 Cycle, the market also had a Bearish Megaphone, a little larger, lasting for 12 months before the price broke above it.
** The importance of the 1W MA50 **
That bullish break-out came when the price regained the 1W MA50 (blue trend-line) as Support and until the Cycle Top, it was never compromised again. In an amazing display of Cycle symmetry, Bitcoin is also being supported by the 1W MA50 right now (has been since the March 13 2023 weekly candle), in fact it was successfully tested and held 3 times since August 05 2024.
** MACD Bullish Cross **
The Megaphone break-out and the 1W MA50 support aren't the only bullish indicators that point to a heavy price increase next. Perhaps the most important of all is the (L) MACD Bullish Cross on, also on the 1W time-frame, the first such formation in a whole year (since October 23 2023). This is a huge development as it comes after 7 months of non-bullish price action, indicating a shift in trend.
** Can the top be at $200k or above? **
When all those indicators were aligned in mid 2020, BTC kick started the 2nd, final and most aggressive Rally of its Cycle. It was +65% stronger than the 1st Rally. As a result, we may experience in the next 12 months a rally of +615% (65% greater than the +373% 1st Rally).
But if this seems too great without a catalyst like the ETF launch was in January, even if BTC replicates the bullish price action of November 2022 - March 2024, it will still hit the $200k mark. What history has shown at least, is that we can stay bullish, until a 1W candle closes below the 1W MA50, whether that's at 100k, 150k or 200k and above.
So what do you think about this triple bullish combo? Is it enough to initiate a 12-month rally? And if so, what is your target? Feel free to let us know in the comments section below!
-------------------------------------------------------------------------------
** Please LIKE 👍, FOLLOW ✅, SHARE 🙌 and COMMENT ✍ if you enjoy this idea! Also share your ideas and charts in the comments section below! This is best way to keep it relevant, support us, keep the content here free and allow the idea to reach as many people as possible. **
-------------------------------------------------------------------------------
💸💸💸💸💸💸
👇 👇 👇 👇 👇 👇

BITCOIN This 1D Golden Cross can push it to the ATH ($73800).Bitcoin (BTCUSD) is ahead of a major bullish formation as most likely by next Monday, it will form a Golden Cross on the 1D time-frame, the first such formation since October 29 2023. As we've analyzed before, it is no coincidence that exactly 1 year later a new 1D Golden Cross emerges as seasonality and long-term Cycles play a pivotal role for BTC.
On top of that, the price made a major re-test (and so far bounce) at the top of the former Channel Down that broke upwards last week. If this re-test holds, it is the best short-term signal for a new High. In fact the price has been making Higher Highs since the August 05 bottom, forming a double Channel Up pattern, and those Higher Highs are the reason why the market got behind this rally and supported it to break above the 7-month Channel Down.
So the Higher Highs along with the 1D Golden Cross are the bullish combination that the market needs to look (much) higher. The first technical target now is naturally the 73800 All Time High (ATH). It is very possible to see it get tested by the election day.
But what do you think? Do you expect the ATH to break aggressively after the elections, just like the October 2023 1D Golden Cross did? Feel free to let us know in the comments section below!
-------------------------------------------------------------------------------
** Please LIKE 👍, FOLLOW ✅, SHARE 🙌 and COMMENT ✍ if you enjoy this idea! Also share your ideas and charts in the comments section below! This is best way to keep it relevant, support us, keep the content here free and allow the idea to reach as many people as possible. **
-------------------------------------------------------------------------------
💸💸💸💸💸💸
👇 👇 👇 👇 👇 👇

BTC/USD "BITCOIN" Market Money Heist Plan on Bullish Side.Bonjour! My Dear Robbers / Money Makers & Losers, 🤑 💰
This is our master plan to Heist BTC/USD "BITCOIN" Market based on Thief Trading style Technical Analysis.. kindly please follow the plan I have mentioned in the chart focus on Long entry. Our target is Red Zone that is High risk Dangerous level, market is overbought / Consolidation / Trend Reversal / Trap at the level Bearish Robbers / Traders gain the strength. Be safe and be careful and Be rich.
Entry : Can be taken Anywhere, What I suggest you to Place Buy Limit Orders in 15mins Timeframe Recent / Nearest Swing Low
Stop Loss 🛑 : Recent Swing Low using 4H timeframe
Attention for Scalpers : If you've got a lot of money you can get out right away otherwise you can join with a swing trade robbers and continue the heist plan, Use Trailing SL to protect our money 💰.
Warning : Fundamental Analysis news 📰 🗞️ comes against our robbery plan. our plan will be ruined smash the Stop Loss. Don't Enter the market at the news update.
Loot and escape on the target 🎯 Swing Traders Plz Book the partial sum of money and wait for next breakout of dynamic level / Order block, Once it is cleared we can continue our heist plan to next new target.
Support our Robbery plan we can easily make money & take money 💰💵 Follow, Like & Share with your friends and Lovers. Make our Robbery Team Very Strong Join Ur hands with US. Loot Everything in this market everyday make money easily with Thief Trading Style.
Stay tuned with me and see you again with another Heist Plan..... 🫂

BITCOIN When the 4 year Cycles do the talking..It's been some time since we last used the Mayer Multiple Bands (MMB) on Bitcoin (BTCUSD) but the timing is just right to bring you an update, only 2 weeks before the U.S. Presidential Elections with the market ahead on an imminent bullish break-out.
This time we look into how the price was trading on this date every 4 years. As you know BTC is trading roughly within 4 year Cycles that keep a high degree of symmetry and tend to repeat a lot of dynamics each time.
Right now, towards the end of October (2024), the price is trading within the Mean MM (black trend-line) and the 1st SD above (grey trend-line). It has already started rising off the Mean MM. Based on the 4-year Cycle Theory, it is no surprise then that the price was within the exact same range in October 2020, October 2016 and October 2012. The degree of symmetry is remarkable and is yet again showcased by this indicator.
We can also see that by this time every 4 years, the price had already started rising off the Mean MM, just as it is doing now. With the green Rectangles we display the date range between these 4-year intervals and the peak of the Bull Cycle. For October 2012 it took 58 weeks (406 days) until it topped, October 2016 was 60 weeks (420 days) while October 2020 was 55 days (385 days). So time-wise the Cycle tends to peak roughly the same period.
As a result, if we take the minimum scenario of 55 weeks, we can expect the Cycle to top by mid November 2025. As far as targets are concerned, the first two Cycles hit (and broke) the 3 SD above (red trend-line), while the last one the 2 SD above (orange trend-line). Again assuming a 'worst case scenario' hitting 'just' the 2 SD trend-line, we can set a Target Range of 190k - 250k, depending on whether the price hits it halfway through the 55 week range or towards its end. Nevertheless, an exciting rally appears to be starting for Bitcoin.
So what do you think? Is this October MMB fractal about to break to a parabolic rally? And if so, will it hit the orange trend-line? Feel free to let us know in the comments section below!
-------------------------------------------------------------------------------
** Please LIKE 👍, FOLLOW ✅, SHARE 🙌 and COMMENT ✍ if you enjoy this idea! Also share your ideas and charts in the comments section below! This is best way to keep it relevant, support us, keep the content here free and allow the idea to reach as many people as possible. **
-------------------------------------------------------------------------------
💸💸💸💸💸💸
👇 👇 👇 👇 👇 👇

BTCUSD 30m previewICMARKETS:BTCUSD they hold the support from the previous two days and as long as they are above this strong support zone, I expect an upward move

BITCOIN 'Angle Theory' unlocking this Cycle. Is $140k the top?Exactly 1 year ago (October 02 2023, see chart below), we published a renewed approach on Bitcoin (BTCUSD) historic Cycles, using the 'Angles Theory' on the logarithmic curve to make a more accurate roadmap of the current Cycle:
Back then, the price was 'just' $28000 and a few months later it catapulted to almost $74000. Below we present again the basics of that analysis, in order to refresh your memory.
** Cycle Peaks and angles **
BTC's Cycle peaks in historical order have been $32, $1250, $19800, $69800. They all made contact with the Logarithmic top Growth Curve, a historic pattern that is holding since BTC's inception.
Every peak-to-peak measurement appears to be roughly half of the previous peak. The automatic angle measurements on the (red) dotted lines may differ based on the screen's display and how the horizontal/ vertical axis move but on ours (and the screenshot of the idea) goes like this: 42°, 22°, 11°. We estimate a 7° angle for the new Cycle peak on the log Growth Curve.
** Next Cycle peak? **
If we take all previous Cycles and apply them to fit the new price action towards the top of the Log Growth Curve, that 7° line gives a projected Cycle peak within $140000 - 160000 (slightly updated from our study a year ago). It is also interesting to apply the same angle principle to the Cycle bottoms. We can see that those (green dotted lines) can also roughly be half of what the previous bottom was (though the variations are higher). The new bottom is estimated to be on a 8° angle.
Remarkably the angles of the tops and bottoms of each Cycle have approximately the same measurements, indicating that despite being logarithmic within a curve, they can be viewed separately in Channels.
** Last year compared to now **
So how has this Theory worked out compared to last year? Well beyond doubt, the Cycle was much more aggressive that the previous two (blue and orange) due to mainly the Bitcoin ETF launch, and is certainly more similar to the first Cycle (black). That suggests that it will top by January 2025 but the Sine Waves Tops, which have caught Bitcoin's cyclical peaks with incredible accuracy, indicate it will be around November 2025. As you can see, this is exactly where the projection of the blue and orange fractals show.
But what do you think? Will the current Cycle peak at the end of 2025 and if show will it be at a minimum of $140000 and a maximum of $1600000, as the 7° angle on the Log Curve suggests? Feel free to let us know in the comments section below!
-------------------------------------------------------------------------------
** Please LIKE 👍, FOLLOW ✅, SHARE 🙌 and COMMENT ✍ if you enjoy this idea! Also share your ideas and charts in the comments section below! This is best way to keep it relevant, support us, keep the content here free and allow the idea to reach as many people as possible. **
-------------------------------------------------------------------------------
💸💸💸💸💸💸
👇 👇 👇 👇 👇 👇

Gold and Bitcoin: Dual Insights for Investment OpportunitiesWith the instability in international affairs, gold has reacted first, successfully breaking through the $2700 mark. Meanwhile, BTCUSD remains stuck in a low-range consolidation, despite conditions that should have led to a breakout long ago.
From the weekly candlestick chart, it's evident that this week, the BTCUSD price has completely broken through the MA30 resistance. Historical data shows that after significant upward movements, prices often experience a pullback before rising again. So, will history repeat itself this time?
I believe the probability is very high. Therefore, if you have funds available but are unsure where to invest, consider converting your money into Bitcoin and waiting for its gradual appreciation, or directly invest in BTCUSD with a long-term strategy. I think this time, the price could reach 78K .

BITCOIN One year later, the pattern is repeated and leads to 88kThis is not the first time we make a case for October being the start of an aggressive rally for Bitcoin (BTCUSD) and lately we have presented you the evidence on the long-term 1W time-frame.
This time we want to focus on the 1D chart, where a more detailed analysis can be made on the fractals that lead to this rally. It was the very same pattern that helped us catch last year the amazing October 2023 - March 2024 rally, as you can see on our September 28 2023 post (see chart below):
As you can see both fractals (2023 and 2024) traded initially within a Triangle pattern that bottomed on an Inverse Head and Shoulders (IH&S). The bottom took place at the same time of the 1D Death Cross formation. Throughout the whole process, they were supported by the 1W MA50 (red trend-line).
Right now on the October 2024 fractal we are at the point where BTC just broke above the top (Lower Highs trend-line) of the Triangle. On the 2023 fractal that led to a brutal rise that only took a 'break' after reaching the 2.0 Fibonacci extension, right after forming a 1D Golden Cross.
As a result, it is possible to see $88000 (Fib 2.0 ext) in December, before the market 'cools' again. Much of course will depend upon how the markets will digest the November U.S. elections but as we've shown you in analytical charts here, the result of event tends to make little difference.
So what do you think? Can this break-out lead to 88k? Feel free to let us know in the comments section below!
-------------------------------------------------------------------------------
** Please LIKE 👍, FOLLOW ✅, SHARE 🙌 and COMMENT ✍ if you enjoy this idea! Also share your ideas and charts in the comments section below! This is best way to keep it relevant, support us, keep the content here free and allow the idea to reach as many people as possible. **
-------------------------------------------------------------------------------
💸💸💸💸💸💸
👇 👇 👇 👇 👇 👇

btcusd sell signal. Don't forget about stop-loss.
Write in the comments all your questions and instruments analysis of which you want to see.
Friends, push the like button, write a comment, and share with your mates - that would be the best THANK YOU.
P.S. I personally will open entry if the price will show it according to my strategy.
Always make your analysis before a trade
