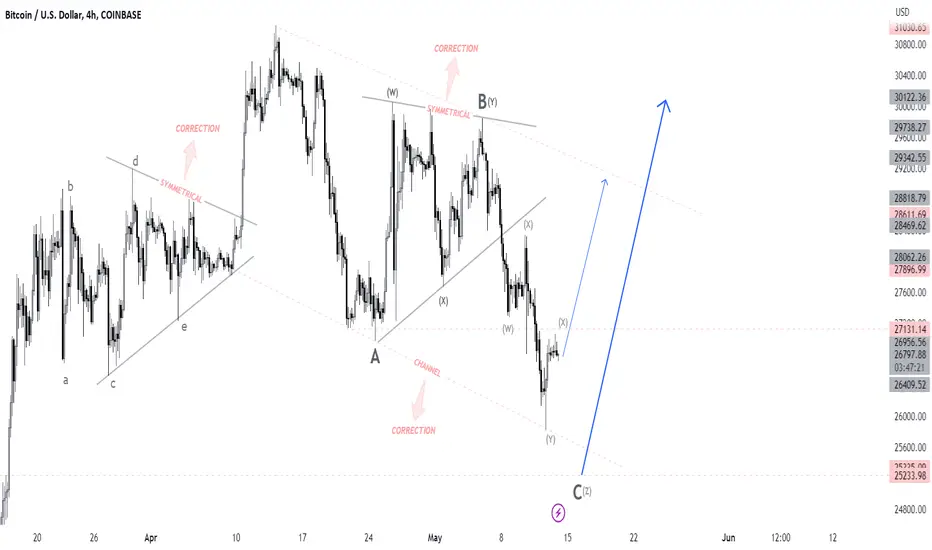
Bitcoin Next Week Possible MovePair : BTCUSD ( Bitcoin / U.S Dollar )
Description :
Completed " ABC " Correction
Impulse Correction Impulse
Symmetrical Triangle
SMC - CHOCH
Break of Structure
Bearish Channel as an Corrective Pattern in Long Time Frame and Rejection from the Lower Trend Line
Impulsive " wxyx " Wave will Completed its " z " at Daily S / R Level
Btcusdsignals
Bitcoin is ready to fall and only need to confirm the pattern.At the moment I am analyzing, Bitcoin has not yet confirmed the Head and Shoulder pattern and has not started its downtrend. Confirmation of this pattern is needed to break the pink trend line and pull it back. And then after the pullback, it will quickly reach two profit levels of $25,088 or $24,550, one of which is the collision of the price with the blue trend line, and the other is a drop due to the completion of the head and shoulder pattern. After the first profit limit, if Bitcoin continues to fall, it will reach the second and maybe third profit limit, which I do not think will happen. Good luck

BITCOIN hit the 1W MA200 after 2 months! Stocks may show the wayBitcoin (BTCUSD) hit today the 1W MA200 (orange trend-line) for the first time since the March 13 weekly bullish break-out. Basically this is the first time that the 1W MA200 is being tested as a Support since the weekly candle of August 15 2022. If it holds, it will be confirmed most likely as a Support and accumulate more buyers for a rebound to the last standing MA level, the 1W MA100 (green trend-line). If it closes below the 1W MA200, we may see a final pull-back to the 1W MA50 (blue trend-line).
The stock market (right chart) represented by the S&P500 (SPX) on this analysis, may be an early signal to BTC's price action as it is near its own 1W MA100 (green trend-line), for 5 straight weeks. If broken, it will be a major long-term buy signal as it has been untouched since the week of August 22 2022. The longer it fails to break it, the more probable it is to make one last pull-back to its 1W MA50 (blue trend-line).
So what do you think? Will BTC hold its 1W MA200 and if so, coupled with an S&P500 break-out above its 1W MA100, will it reach $32000? Feel free to let us know in the comments section below!
-------------------------------------------------------------------------------
** Please LIKE 👍, FOLLOW ✅, SHARE 🙌 and COMMENT ✍ if you enjoy this idea! Also share your ideas and charts in the comments section below! **
-------------------------------------------------------------------------------
💸💸💸💸💸💸
👇 👇 👇 👇 👇 👇

BTC Getting ready to fill my scalp orderBTC will most probably touch my entry and have at least one leg up from there!
Nice R/R 😙
NFA

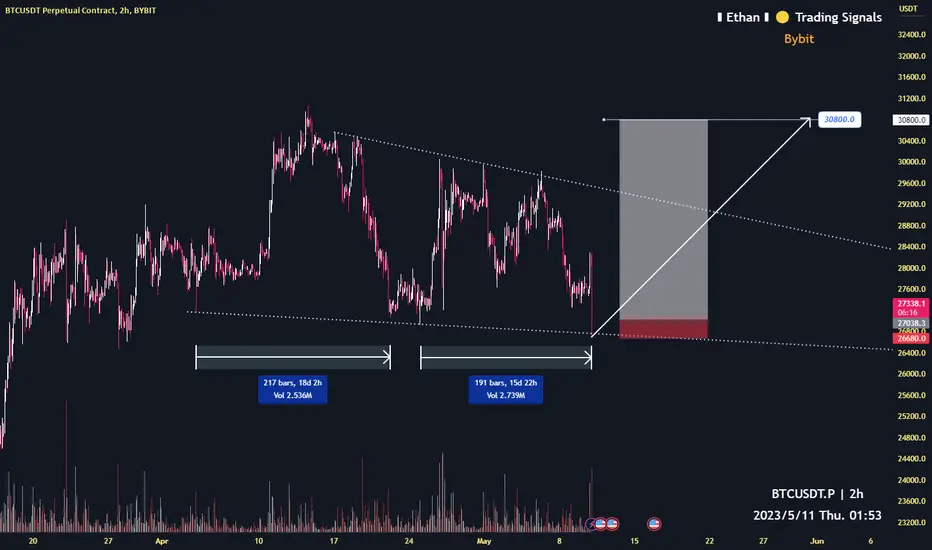
Bitcoin showing a low risk opportunity2h time frame
-
Bitcoin dumping rapidly and creating a descending wedge currently.
We can set SL a little bit lower than previous(26700), and aim at 30800 if this pattern continues to work.
This trade has great RR, do not miss it!
BITCOIN Huge Bullish Cross that kickstarts the Parabolic RallyBitcoin (BTCUSD) has failed to break above its 3W MA50 (blue trend-line) but the KST indicator is about to make its Bullish Cross. The previous three clear Bullish Crosses have been on July 2020, January 2016 and June 2013. All have kickstarted major Parabolic Rallies for BTC.
Since we have established that the Bear Cycle has technically ended and that we are already at the start of the new Bull Cycle, do you think that we are only a few weeks away from initiating another strong rally? Feel free to let us know in the comments section below!
-------------------------------------------------------------------------------
** Please LIKE 👍, FOLLOW ✅, SHARE 🙌 and COMMENT ✍ if you enjoy this idea! Also share your ideas and charts in the comments section below! **
-------------------------------------------------------------------------------
💸💸💸💸💸💸
👇 👇 👇 👇 👇 👇

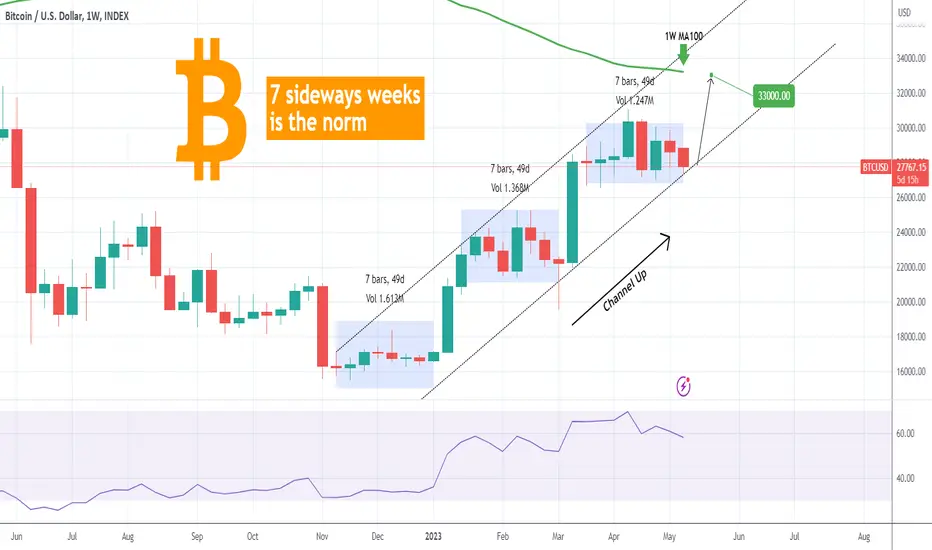
BITCOIN 7 sideways weeks is the norm. Embrace it and make profitBitcoin (BTCUSD) has been trading within a Channel Up pattern since the November FTX crash bottom. Inside this pattern, it has already seen a 7 straight week (1W) consolidation phase, two times already and currently it is about to complete the 7th week of the third consolidation phase.
This is taking place right at the bottom (Higher Lows trend-line) of the Channel Up. If the current 1W candle closes in green or with a strong upward closing inside the Channel (as March 06), then most likely we will see a strong bullish 1W candle following such as the ones on January 09 and March 13. The short-term Target is the 1W MA100, which has been holding as Resistance since May 02 2022 (green trend-line), at a projected price of $33000.
-------------------------------------------------------------------------------
** Please LIKE 👍, FOLLOW ✅, SHARE 🙌 and COMMENT ✍ if you enjoy this idea! Also share your ideas and charts in the comments section below! **
-------------------------------------------------------------------------------
💸💸💸💸💸💸
👇 👇 👇 👇 👇 👇
BITCOIN next Top can be at least $200k!Bitcoin (BTCUSD) is on a short-term pull-back and much of the crypto community casts doubts again over the recent rally and if this is indeed a new Bull Cycle or a bear market counter trend rally.
In times of short-term uncertainty we tend to rely our channel on the long-term time-frames and for BTC in particular its historic Cycles. Those are patterns that have repeated themselves over and over again, with some variations of course based on the current market conditions.
** The Fibonacci Channels **
Right now the price is above the 1W MA50 (blue trend-line), on a 5-month rally that hasn't been anything like short-term Bear Cycle rallies. The previous Cycles topped near Fibonacci trend-lines of prior Cycle Channels. For example the December 2017 Cycle Top was formed just below the bottom (Fib 0.0) of the orange Fibonacci Channel that started from the previous Cycle bottom. The November 2021 Top was formed just below the middle (Fib 0.5) of the blue Fibonacci Channel. This could be a +0.5 Fib progression and in that case the Top of the current Cycle might be just below the top (Fib 1.0) of the black Fibonacci Channel that started on the December 2018 bottom.
** The Halvings and $200k **
The 1.0 Fib at the time of (the next) Halving 4 (March 2024) will be above $200000, and as we know after each Halving, Bitcoin posts the most aggressive (parabolic) rally of the Bull Cycle. So that leads us to assume that the Top of the current Bull Cycle will be at least $200k. To give a relative sense of pathing, we have plotted the 'post Halving rallies' of the previous three Cycles on the current Channel starting on Halving 4.
Do you think that we will see $200k by 2025 Q3? Feel free to let us know in the comments section below!
-------------------------------------------------------------------------------
** Please LIKE 👍, FOLLOW ✅, SHARE 🙌 and COMMENT ✍ if you enjoy this idea! Also share your ideas and charts in the comments section below! **
-------------------------------------------------------------------------------
💸💸💸💸💸💸
👇 👇 👇 👇 👇 👇

BTCUUSD H4 ANALYSIS BTCUSD break previous support and now good demand zone is FWB:27K and strong zone is $26.5k and we are looking for a target $30 then plus above all area and technical mentioned in chart
just need your support so that we can work more efficiently thanks for supporting me


Opportunity to do long BTC/USDTToday, Bitcoin continues to maintain a narrow volatile market. Judging from the structural trend, Bitcoin maintains a volatile upward trend. Recently, the K-line has appeared many times, announcing that the short-term decline is basically over. , Then the next step may be to go long at a low level.So in short-term trading, we can execute according to the following trading rhythm.
1.At present, the short-term support focuses on the position of 28600-28800, and the support area can consider going long BTC/USDT in small batches.
2.Further support is at the position of 28000-28200, and the support area is long BTC/USDT.
3.The pressure carried above is on the 29000-29200 line. If the resistance area can be broken through strongly, the increase is expected to continue, that is, the 29800-30000 position.
The above are the key areas of BTC that need to be paid attention to in the short term and the general trading rhythm, and I will announce the more detailed trading rhythm and entry position in my channel.If you want to grasp the detailed trading rhythm and master accurate trading signals, you can enter my channel.

* BTCUSD MULTIPLE SETUPS SOON!! *
* Here we can see clearly BTCUSD is forming The Bearish Flag ( Continuation Pattern ) soon.
* I can see we can pull Multiple Trade Positions from the next moves of BTCUSD.
* I've put EP for SELL position & EP for BUY position.
* I recommend to take the SELL position as we can see clearly it's forming The Bearish Flag.
* Keep your eye close on your trading positions.
* Happy pip hunting traders.
* FX KILLA *

$BTCUSD 28,870 --> 24,500/26,000 --> 36,000-54,000BTC Price Live Data
The live Bitcoin price today is $28,855.61 USD with a 24-hour trading volume of $15,140,346,914 USD. We update our BTC to USD price in real-time. Bitcoin is down 1.89% in the last 24 hours. The current CoinMarketCap ranking is #1, with a live market cap of $558,824,016,222 USD. It has a circulating supply of 19,366,218 BTC coins and a max. supply of 21,000,000 BTC coins.
If you would like to know where to buy Bitcoin at the current rate, the top cryptocurrency exchanges for trading in Bitcoin stock are currently Binance, OKX, Deepcoin, Bybit, and CoinW. You can find others listed on our crypto exchanges page.
What Is Bitcoin (BTC)?
Bitcoin is a decentralized cryptocurrency originally described in a 2008 whitepaper by a person, or group of people, using the alias Satoshi Nakamoto. It was launched soon after, in January 2009.
Bitcoin is a peer-to-peer online currency, meaning that all transactions happen directly between equal, independent network participants, without the need for any intermediary to permit or facilitate them. Bitcoin was created, according to Nakamoto’s own words, to allow “online payments to be sent directly from one party to another without going through a financial institution.”
Some concepts for a similar type of a decentralized electronic currency precede BTC, but Bitcoin holds the distinction of being the first-ever cryptocurrency to come into actual use.
Who Are the Founders of Bitcoin?
Bitcoin’s original inventor is known under a pseudonym, Satoshi Nakamoto. As of 2021, the true identity of the person — or organization — that is behind the alias remains unknown.
On October 31, 2008, Nakamoto published Bitcoin’s whitepaper, which described in detail how a peer-to-peer, online currency could be implemented. They proposed to use a decentralized ledger of transactions packaged in batches (called “blocks”) and secured by cryptographic algorithms — the whole system would later be dubbed “blockchain.”
Just two months later, on January 3, 2009, Nakamoto mined the first block on the Bitcoin network, known as the genesis block, thus launching the world’s first cryptocurrency. Bitcoin price was $0 when first introduced, and most Bitcoins were obtained via mining, which only required moderately powerful devices (e.g. PCs) and mining software. The first known Bitcoin commercial transaction occurred on May 22, 2010, when programmer Laszlo Hanyecz traded 10,000 Bitcoins for two pizzas. At Bitcoin price today in mid-September 2021, those pizzas would be worth an astonishing $478 million. This event is now known as “Bitcoin Pizza Day.” In July 2010, Bitcoin first started trading, with the Bitcoin price ranging from $0.0008 to $0.08 at that time.
However, while Nakamoto was the original inventor of Bitcoin, as well as the author of its very first implementation, he handed the network alert key and control of the code repository to Gavin Andresen, who later became lead developer at the Bitcoin Foundation. Over the years a large number of people have contributed to improving the cryptocurrency’s software by patching vulnerabilities and adding new features.
Bitcoin’s source code repository on GitHub lists more than 750 contributors, with some of the key ones being Wladimir J. van der Laan, Marco Falke, Pieter Wuille, Gavin Andresen, Jonas Schnelli and others.
What Makes Bitcoin Unique?
Bitcoin’s most unique advantage comes from the fact that it was the very first cryptocurrency to appear on the market.
It has managed to create a global community and give birth to an entirely new industry of millions of enthusiasts who create, invest in, trade and use Bitcoin and other cryptocurrencies in their everyday lives. The emergence of the first cryptocurrency has created a conceptual and technological basis that subsequently inspired the development of thousands of competing projects.
The entire cryptocurrency market — now worth more than $2 trillion — is based on the idea realized by Bitcoin: money that can be sent and received by anyone, anywhere in the world without reliance on trusted intermediaries, such as banks and financial services companies.
Thanks to its pioneering nature, BTC remains at the top of this energetic market after over a decade of existence. Even after Bitcoin has lost its undisputed dominance, it remains the largest cryptocurrency, with a market capitalization that surpassed the $1 trillion mark in 2021, after Bitcoin price hit an all-time high of $64,863.10 on April 14, 2021. This is owing in large part to growing institutional interest in Bitcoin, and the ubiquitousness of platforms that provide use-cases for BTC: wallets, exchanges, payment services, online games and more.

BITCOIN If the low volume worries you, see this chart!Bitcoin (BTCUSD) has been on a strong recovery since late November, following the FTX crash but is doing so on Decreasing Volume. This is something that has gotten many market participants worry as decreasing volume during rallies make the trend fragile.
A simple look however at past Cycle bottoms is enough to provide a good understanding of the current situation. As this chart (4D time-frame) shows, there was Decreasing Volume on all previous major market bottoms, especially in times of extreme capitulation such as the March 2020 COVID crash, or the August 2015 Bitfinex crash. With the FTX crash in early November 2022 being such a capitulation even, there should be no surprise that the volume has been decreasing ever since. With BTC almost doubled since then, we can strongly claim that this is a standard Cycle bottom rally.
If we start seeing the volume rising, then it means that the market is most likely headed for the mid Cycle peak, typically before the next Halving.
In any case are you worried about this decreasing volume while the price has been rising or agree that this is common after Cycle bottoms? Feel free to let us know in the comments section below!
-------------------------------------------------------------------------------
** Please LIKE 👍, FOLLOW ✅, SHARE 🙌 and COMMENT ✍ if you enjoy this idea! Also share your ideas and charts in the comments section below! **
-------------------------------------------------------------------------------
💸💸💸💸💸💸
👇 👇 👇 👇 👇 👇

BITCOIN When you see this, it will already be TOO LATE!This is an interesting analysis on the 1W time-frame of Bitcoin (BTCUSD) against the GOLD/SPX ratio(blue trend-line). The conclusion that this comparison offers can be very valuable.
As you see, when the GOLD/SPX ratio peaks and starts pulling back, Bitcoin starts the Parabolic Rally of its Bull Cycle. At the moment the GOLD/SPX ratio is on a Channel Up similar to 2018 - 2019. When the ratio broke that Channel to the upside, it peaked as in February 2016 and started to decline. At the same time Bitcoin kick started its Parabolic Rally.
Will you be on the look-out for such a spike or when it happens it will already be too late? Feel free to let us know in the comments section below!
-------------------------------------------------------------------------------
** Please LIKE 👍, FOLLOW ✅, SHARE 🙌 and COMMENT ✍ if you enjoy this idea! Also share your ideas and charts in the comments section below! **
-------------------------------------------------------------------------------
💸💸💸💸💸💸
👇 👇 👇 👇 👇 👇

BITCOIN Never looked back after breaking this level!Bitcoin (BTCUSD) is above the Multiple 3 (black trend-line) of the Fibonacci MAs for the third straight 3W candle. Every time it did so, the price always hit Multiple 4 (yellow trend-line). This level is now at $43300 and rising. Do you think this is BTC's next target within a 6 month time-frame? Feel free to let us know in the comments section below!
-------------------------------------------------------------------------------
** Please LIKE 👍, FOLLOW ✅, SHARE 🙌 and COMMENT ✍ if you enjoy this idea! Also share your ideas and charts in the comments section below! **
-------------------------------------------------------------------------------
💸💸💸💸💸💸
👇 👇 👇 👇 👇 👇

Symmetrical triangle in BTCUSD with bullish biasH4 chart of BTCUSD making symmetrical triangle which means it can go in either direction however, there is bullish bias as there was Bullish divergence at the last LLs and the last LL was broken and new HH was printed at the level of 30150. So now 2 levels are important to determine direction of market if the last HL (27350) is broken trend will go bearish and if the last HH (30160) is broken then trend will go bullish. Most probably, market will go in up direction after breaking 30150 level so we should plan our buy stop entry at the break of 30150 and sell entry at the break of 27350.

BITCOIN The astonishing symmetry with 2014/15 shows $49k in NovOn today's analysis we look into Bitcoin (BTCUSD) on the 1W time-frame and compare the current Cycle with that of 2014 - 2017. As you see there is so far an astonishing symmetry between the two, with the price currently consolidating after almost hitting the 0.5 Fibonacci retracement level three weeks ago. For the Fibonacci calculations we have used the price top and bottom as suggested by the 1W RSI, which is the backbone of the analysis. This indicates that the Cycle Top (on RSI terms) was on the week of April 12 2021 (and not Nov 08 2021) while the Cycle Bottom was on the week of June 13 2022 (and not in November 2022, which was in the aftermath of the FTX crash).
So far the three Phases have lasted almost the same time. If Phase 3 (yellow) ends this week on a 46 week duration such as November 30 2015, then on the next 1W candle we will start Phase 4 (green), which in 2016 lasted for 28 weeks and on its end hit the 0.786 Fibonacci level. As a result, this is a highly probable target, with the 0.786 Fib being at $49000 and the 28 week span ends on November 13 2023.
With the 1W RSI pulling back after hitting the 70.00 overbought level in April, do you think BTC will start a strong Phase 4 next week towards FWB:49K ? Feel free to let us know in the comments section below!
-------------------------------------------------------------------------------
** Please LIKE 👍, FOLLOW ✅, SHARE 🙌 and COMMENT ✍ if you enjoy this idea! Also share your ideas and charts in the comments section below! **
-------------------------------------------------------------------------------
💸💸💸💸💸💸
👇 👇 👇 👇 👇 👇

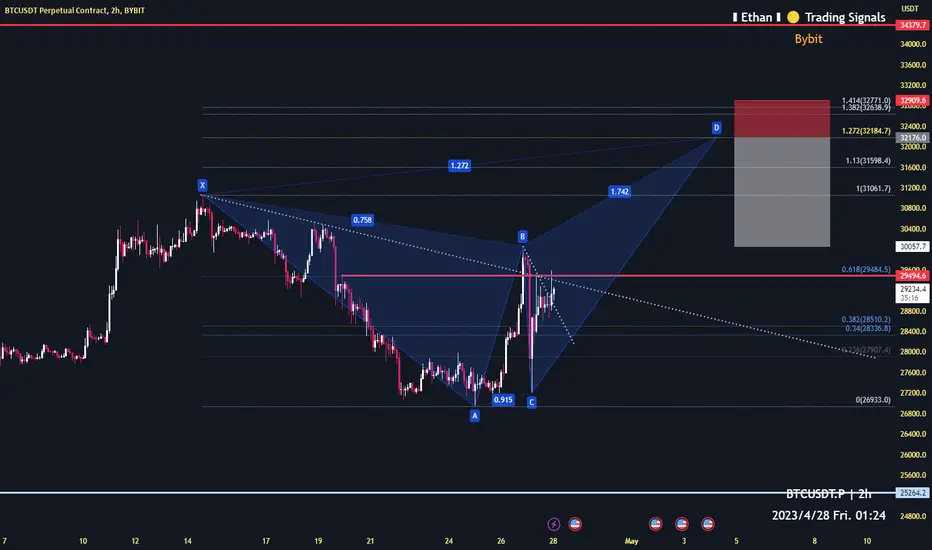
Bitcoin is approaching the end of this small bull run2h time frame
-
Bitcoin is creating a potential harmonic structure(butterfly)
The reversed point is around 32185 to 32700.
We might reach it in next two weeks.
Stay prepared for it!
BITCOIN How the VIX will push it (along with stocks) much higherYou may be wondering what Bitcoin (BTCUSD) has to do with the S&P500 index (SPX) and the Volatility Index (VIX). Well this chart gives you the answer and sets the tone for the remainder of the year and beyond.
As you see Bitcoin (chart on the left) rebounded on the Higher Lows trend-line that started on the December 2018 Low (and only broke during the COVID crash). The S&P500 (chart in the middle) is following a similar pattern as its Higher Lows trend-line (that only broke during the U.S. - China trade war and the COVID crash) held and gave the index a push last October.
At the same time VIX (chart on the right) has been holding its Higher Lows trend-line up until this month (April). This bearish break-out implies that the index that measures the market volatility will most likely drop further indicating a decline in uncertainty and setting a risk-on tone for stocks and crypto alike. The lower the volatility, the higher risky assets such as stocks and crypto trade.
Do you think that will be the case for the rest of the year and probably beyond after this bearish break-out on VIX? Feel free to let us know in the comments section below!
-------------------------------------------------------------------------------
** Please LIKE 👍, FOLLOW ✅, SHARE 🙌 and COMMENT ✍ if you enjoy this idea! Also share your ideas and charts in the comments section below! **
-------------------------------------------------------------------------------
💸💸💸💸💸💸
👇 👇 👇 👇 👇 👇

BITCOIN Held key Cycle Support, preparing a mega break-out!Bitcoin (BTCUSD) is rebounding off the 0.5 Fibonnaci Lower Lows trend-line that provided Support numerous times during the previous Cycle but when it finally closed a 1W candle below it (June 06 2022) it started the final bearish sequence.
Currently this is very positive for the upside's chances and if BTC manages to close a 1W candle above the 0 Fib, we can see the final two bullish waes to 36000 and 43000. At the same time, the Higher Lows trend-line since the market bottom is holding, while the 1W MA50 (blue trend-line) hasn't been re-tested in a month and a half.
Do you think that hold on the 0.5 Fib was the key and we are off to the races again? Feel free to let us know in the comments section below!
-------------------------------------------------------------------------------
** Please LIKE 👍, FOLLOW ✅, SHARE 🙌 and COMMENT ✍ if you enjoy this idea! Also share your ideas and charts in the comments section below! **
-------------------------------------------------------------------------------
💸💸💸💸💸💸
👇 👇 👇 👇 👇 👇

BITCOIN hit the 1D MA50 after 40 days!Bitcoin (BTCUSD) hit yesterday (and closed above it) the 1D MA50 (blue trend-line0 for the first time since March 13. At the same time it almost touched the 0.618 Fibonacci level of the Channel Up, which has been the last level of Support before the bottom of the Channel Up.
The key here are the 1D RSI and LMACD indicators. We've placed both on the same pane and as you see they both imply that we may be in a similar spot as March 07 - 10. Whether we get a macro catalyst (it was the Credit Suisse crisis then) that will pull the price back to the bottom of the Channel Up or not, that remains to be seen.
If BTC closes a 1D candle below the 1D MA50, it is possible to see that last pull-back to the bottom of the Channel Up. If not, expect a rebound from current levels. In either case, our target is 33000.
Feel free to let us know in the comments section below!
-------------------------------------------------------------------------------
** Please LIKE 👍, FOLLOW ✅, SHARE 🙌 and COMMENT ✍ if you enjoy this idea! Also share your ideas and charts in the comments section below! **
-------------------------------------------------------------------------------
💸💸💸💸💸💸
👇 👇 👇 👇 👇 👇

Bitcoin short-term target 28800!1h time frame
-
Bitcoin will probably create a potential inverse head and shoulders here, which neckline is 27880.
If this structure perfectly form, the target will be 28700~28800.
