BITCOIN Don't sleep on this MegaphoneThe Megaphone pattern you see on this 1W chart certainly doesn't get enough attention as other, most cyclical and systemic patterns prevail. Bitcoin (BTCUSD) however has formed a similar structure during the previous Bull Cycle, right after the first rally top.
The moment that pattern broke to the upside (Fibonacci 1.0), the price spent as much time from the bottom (Fib 0.5) as the bottom did from the start (Fib 0.0). On the current pattern the bottom is on the November 07 2022 1W candle and that gives a projected break-out above the Megaphone on the week of June 03 2024. That isn't at all unrealistic as it times very well with the next Halving 4 event (scheduled on March 2024), which is the supply shock event that historically boosts BTC's price into the most aggressive Parabolic Rallies.
Do you think this pattern is of any importance? Feel free to let us know in the comments section below!
-------------------------------------------------------------------------------
** Please LIKE 👍, FOLLOW ✅, SHARE 🙌 and COMMENT ✍ if you enjoy this idea! Also share your ideas and charts in the comments section below! **
-------------------------------------------------------------------------------
💸💸💸💸💸💸
👇 👇 👇 👇 👇 👇
Btcusdsignals

BTCUSD High Probability SELL Setup SOON !!!* Here we can see Clearly the next move for Bitcoin this coming Hours & Days,
* We can see Clearly it's forming Head & Shoulder Reversal Pattern ( M ),
* We've got our EP level ( Blue Line ) & our TP level ( Golden Line ),
* Keep a close eye on your trading journey,
* Happy pip hunting traders.
* FX KILLA *

BTC USD SELLERS COMING SOON FOR THEIR CHANCE {06/APRIL/2023}Educational Analysis says BTC USD may go Short according to my technical.
This is not an entry signal. I have no concerns with your profit and loss from this analysis.
Why short?
I have mentioned the reason why it will move down from here.
selling pressure build-up.
I HAVE NO CONCERNS WITH YOUR PROFIT OR LOSS.
ENTRY - 28,523.85
STOP-LOSS - 28,754.65
TAKE PROFIT - 15,767.21
THE RISK-TO-REWARD RATIO IS 1:55.27

BITCOIN Keep it simple. 1W RSI above 70 = rally!Bitcoin (BTCUSD) on the 1W time-frame is about to see its RSI break above the 70.00 overbought barrier. A simplistic yet reliable historical way of viewing the current situation is that every time the RSI broke above this level, BTC was either starting a mega Parabolic Rally or was in the middle of a smaller rally. On five occasions the rallies were very aggressive, on four there were less, the kind of rallies we see at the start of a Bull Cycle.
What is it going to be this time? Feel free to let us know in the comments section below!
-------------------------------------------------------------------------------
** Please LIKE 👍, FOLLOW ✅, SHARE 🙌 and COMMENT ✍ if you enjoy this idea! Also share your ideas and charts in the comments section below! **
-------------------------------------------------------------------------------
💸💸💸💸💸💸
👇 👇 👇 👇 👇 👇

BITCOIN has started riding 'The Bollinger Wave'. Fullspeed rallyBitcoin (BTCUSD) is witnessing a strong green week, following three straight weeks of flat price action that got many questioning the strength and durability of the rally since the start of the year. A simple indicator comes to give the answer on the 1W time-frame. It is the Bollinger Bands that display a very distinct characteristic during BTC rallies (similarly during downtrends as well).
We call that "The Bollinger Wave" and it is the upper Bollinger Band (blue trend-line) on the 1W time-frame that Bitcoin rides as a "wave" during a Bull Rally. The chart on the left shows the last two such rallies, with the current being the 3rd one as the price has been "riding" the upper Bollinger since the week of January 16.
The chart on the right shows all such rallies since 2010. It is easily noticeable that when such rallies start there is now easy or quick stop to them and they are supported by the Bollinger's Basis (orange trend-line). This is the exact same trend-line that offered the strong rebound of March 6th.
How high the current rally can go before getting exhausted is anybody's guess but two things are a fact: a) It has only just started and b) the Bollinger Basis has risen to 22435 and is now the long-term Support.
So what do you think? Will Bitcoin continue to "ride the Bollinger wave"? Feel free to let us know in the comments section below!
-------------------------------------------------------------------------------
** Please LIKE 👍, FOLLOW ✅, SHARE 🙌 and COMMENT ✍ if you enjoy this idea! Also share your ideas and charts in the comments section below! **
-------------------------------------------------------------------------------
💸💸💸💸💸💸
👇 👇 👇 👇 👇 👇

BTCUSDI think bitcoin running bullish. But now market is ranging. So now i waiting support line. If market goes down and hit that support line, i will enter long.

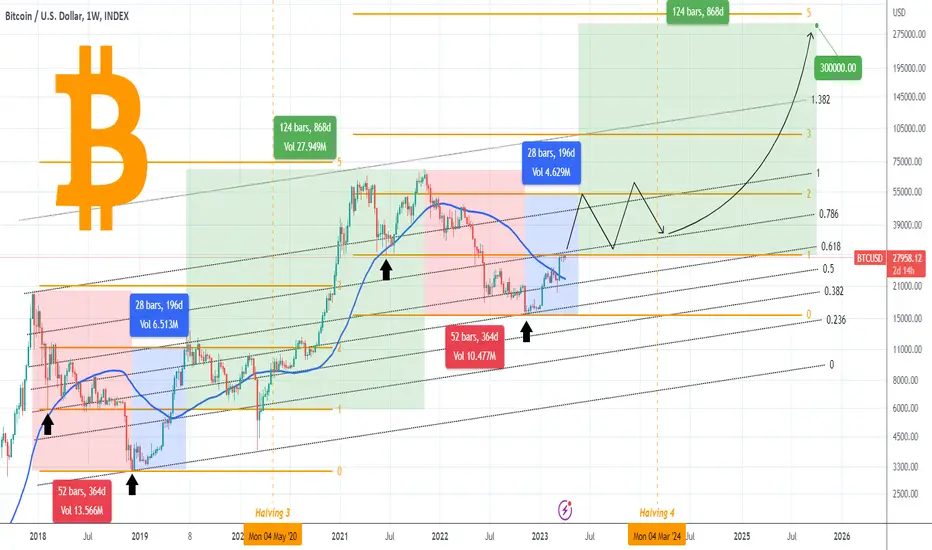
BITCOIN Is 300k the true potential of this Cycle?Bitcoin (BTCUSD) isn't backing down, withstanding to perfection so far any noise in the stock market, a development that establishes that its new Bull Cycle is well underway. Having broken above the 1W MA50 (blue trend-line) and what will most likely be the 4th straight weekly closing above it, we can see that it is testing (and so far struggling to break) the key former Support of the Bear Cycle (Fibonacci 1.0).
The previous Cycle made an aggressive rally to the 2.0 Fib extension after it broke above the Bear Cycle's Support (Fib 1.0) and peaked 28 weeks after the bottom. In an amazing act of symmetry, we see that these last two Bear Cycles lasted for 52 weeks each. Since so far the moves are proportional, we cannot easily dismiss the probability of this '1st Rally Phase' being also 28 weeks and reaching as high as the 2.0 Fib, which is a little over $53k.
Beyond this, a year of basically ranged trading wouldn't be unrealistic, until the Halving 4 event (which is programmed for March 2024) that will inflict a huge supply shock and as it did in May 2020, initiate the final, mega parabolic rally of the Bull Cycle. That part of the previous Cycle, from the time BTC reached the 0.2 Fib until its November 2021 peak, lasted 124 weeks. The peak was achieved a little under the 5.0 Fibonacci extension.
A repeat of makes $300000 by October 2025 a plausible target. Does this reveal Bitcoin's true potential for this Cycle? Feel free to let us know in the comments section below!
-------------------------------------------------------------------------------
** Please LIKE 👍, FOLLOW ✅, SHARE 🙌 and COMMENT ✍ if you enjoy this idea! Also share your ideas and charts in the comments section below! **
-------------------------------------------------------------------------------
💸💸💸💸💸💸
👇 👇 👇 👇 👇 👇
Intraday BUY Bitcoin (06 APR 2023)BTCUSD intraday trading alert
3 simple steps to find a quality setup !
Risk Reward Ratio 1: 2
Anyone same idea with me?
BUY BTCUSD
Good luck traders..

BITCOIN About to wave goodbye to 30k for good if broken?Bitcoin (BTCUSD) is ahead of a critical breakthrough on the 1W time-frame. The former Support of the first half of the Bear Cycle is around 30k and is currently being tested. History has shown that when this level gets tested as a Resistance and breaks during the start of a new Bull Cycle, it never gets retested (cannot count the irregularity of a once in 100 years event like the COVID pandemic in March 2020.
At the same time time, when it breaks the 9°Lower Highs trend-line, the Parabolic Rally starts and doesn't look back. All this while the 1W LMACD is on perfect symmetry with the previous Support tests.
Are we about to wave 'bye bye' to 30k for good? Feel free to let us know in the comments section below!
-------------------------------------------------------------------------------
** Please LIKE 👍, FOLLOW ✅, SHARE 🙌 and COMMENT ✍ if you enjoy this idea! Also share your ideas and charts in the comments section below! **
-------------------------------------------------------------------------------
💸💸💸💸💸💸
👇 👇 👇 👇 👇 👇

BTC USD Chart H1Here is my view for BTCUSD on H1. The price could go bullish, you can put a pending order on the Order block or find an entry on LTF within OB Zone. Trade Safe!

Bitcoin next huge volatility is comingBYBIT:BTCUSDT.P
4hr time frame
-
Bitcoin is consolidating as a symmetrical triangle and approaching to the end.
It will make continuation no matter break upside or downside.
I personally tend to see it break below this triangle, and do not miss the good opportunity.

BITCOIN Inverse Head & Shoulders gives historic bull runs!Bitcoin (BTCUSD) is in the process of completing a peculiar Inverse Head and Shoulders (IH&S) pattern on a bullish slope. This has historically been extremely bullish for BTC. For reference, we post the most recent such formation (June - August 2021) and the whole 2017 Parabolic Rise which contained 5 similar patterns. The technical target is the 2.0 Fibonacci extension, currently a little over $38000.
Do you think that's BTC's immediate target? Feel free to let us know in the comments section below!
-------------------------------------------------------------------------------
** Please LIKE 👍, FOLLOW ✅, SHARE 🙌 and COMMENT ✍ if you enjoy this idea! Also share your ideas and charts in the comments section below! **
-------------------------------------------------------------------------------
💸💸💸💸💸💸
👇 👇 👇 👇 👇 👇

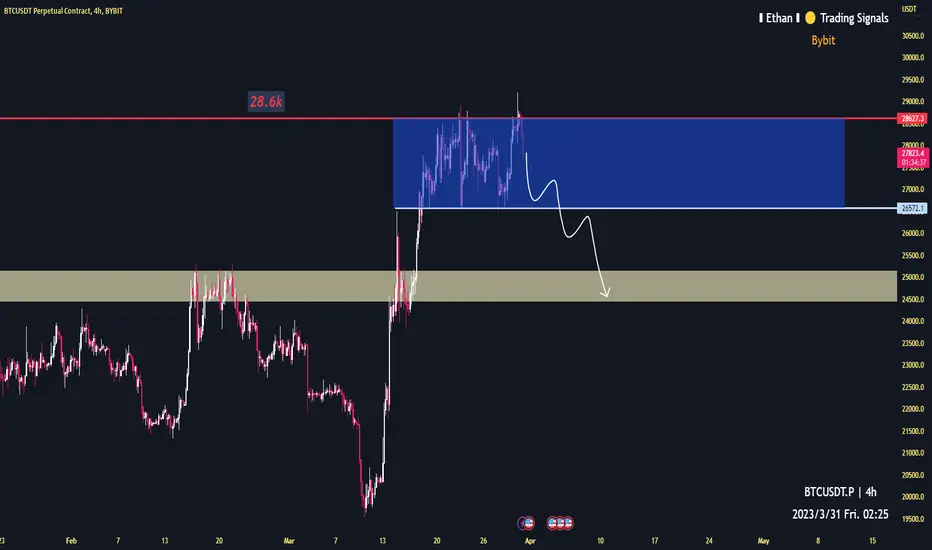
Short Bitcoin with this Great RRR!BYBIT:BTCUSDT.P
1h time frame
-
Bitcoin is getting from the range high again.
My recommended short zone is 28.5~28.8k, and target at 26.6k
Try this low risk and high return trading!

Bitcoin BTC Next MovePair : Bitcoin BTC
Description :
Consolidation Phase in LTF if Breaks the Upper Trend Line then BUY and If Reject then SELL
Divergence
Completed " 12345 " Impulsive Wave and " ABC " Corrective Wave
Break of Structure
Falling Wedge as an Corrective Pattern in Short Time Frame as an Correction in Short Time Frame with the Breakout of the UTL

BITCOIN So much for Resistances...Bitcoin (BTCUSD) broke yet another Resistance level, this time the Lower Lows Pivot trend-line that started from the Lower Lows of the Bear Cycle. When this happened during the previous Cycle in early May 2019, BTC skyrocketed to the next Pivot trend-line (upper dashed) and consolidated there before the next one (dotted). Of course the fundamentals aren't the same, and Bitcoin doesn't have the Libra euphoria to ride but still this technical symmetry is an indication.
Notice also now correlated the LMACD sequences are. Both bottomed around the same (2D tf) level at -0.18 to -0.16 and faced Resistance above the 0.00 mark on the previous Highs. Do you expect Bitcoin to continue rising and hit the next Pivot trend-line around $39000? Feel free to let us know in the comments section below!
-------------------------------------------------------------------------------
** Please LIKE 👍, FOLLOW ✅, SHARE 🙌 and COMMENT ✍ if you enjoy this idea! Also share your ideas and charts in the comments section below! **
-------------------------------------------------------------------------------
💸💸💸💸💸💸
👇 👇 👇 👇 👇 👇

Best buying timing once Bitcoin break downward this!BYBIT:BTCUSDT.P
4h time frame
-
I tend to see Bitcoin break below this box and reach 25,000 in near future.
And it'll be Great opportunity to buy!
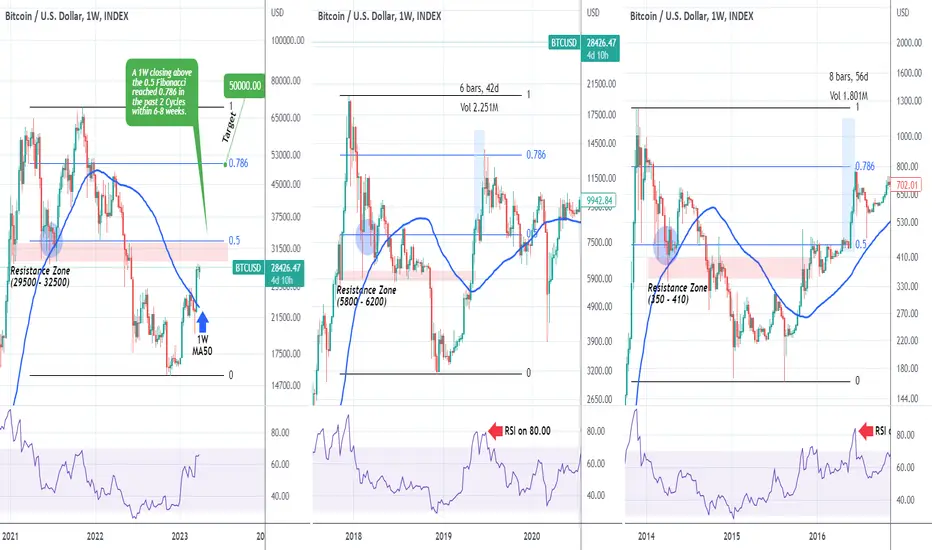
BITCOIN What happens if 30k breaks?A lot of market participants are calling for a firm end to Bitcoin's (BTCUSD) rally around the 30k mark. Who can blame them? Bitcoin has been on a very aggressive rally since the start of the year with its price in the low 16000s at the time. As we pointed out at an earlier analysis however, the breaking and closing of a 1W candle above the 1W MA50 (blue trend-line), set in motion the 2nd phase of this rally towards $30000.
** Former Support Zone turned into Resistance **
This is the level that most are afraid of and rightly so as the broader range of 29500 - 32500 is the former Support Zone (now Resistance) of the Bear Cycle, the Zone that initially supported the first sell-off and closed all candles above it for many months. When it finally gave in in May 2022, BTC entered the 2nd, most aggressive but final phase of the Bear Cycle. In fact, such Zones were present in BTC's previous Cycles. The Resistance Zone in 2019 was within 5800 - 6200 while in 2015 with 350 - 410.
** The 0.5 Fibonacci **
What's perhaps more important than this Zone itself, is the 0.5 Fibonacci retracement level since the Cycle's top. On the current Cycle that's at $32800. In these past two Cycles, when Bitcoin closed a 1W candle above the 0.5 Fib, the price rallied and hit the 0.786 Fib in 6 and 8 weeks respectively! The 0.786 Fib on the current Cycle is at $50000.
But why do we give more weight to the 0.5 Fib instead of the Resistance Zone around the 30k mark? Because even though in the previous Cycle on the week May 06 2019, BTC broke above it and aggressively extended the rally, in the Cycle before on the week of November 02 2015, it broke (even above the 0.5 Fib) but got sold massively only to close the 1W candle back below it. As a result, a closing above the 0.5 Fib would be a more accurate signal.
Notice also that by the time the post 0.5 Fib rally reached the 0.786 level and peaked, the 1W RSI was at or slightly above 80.00 (obviously massively overbought). A strong medium-term sell/ take profit signal.
But what do you think will happen if 30k breaks? Will it rally to 50k and the 0.786 Fibonacci or pull-back and and consolidate for a multi-week period until it does so? Feel free to let us know in the comments section below!
-------------------------------------------------------------------------------
** Please LIKE 👍, FOLLOW ✅, SHARE 🙌 and COMMENT ✍ if you enjoy this idea! Also share your ideas and charts in the comments section below! **
-------------------------------------------------------------------------------
💸💸💸💸💸💸
👇 👇 👇 👇 👇 👇
BITCOIN closed below the 4H MA50 and can drop lowerBitcoin (BTCUSD) broke below the 4H MA50 (blue trend-line) with both the 4H RSI and MACD under their neutral limit. This indicates short-term weakness and as with the February 05 and February 22 4H MA50 break-outs, we may see a re-test of the 4H MA50 as a Resistance where a new rejection may cause a bigger pull-back.
The previous two break-outs made a Lower Low within the 1.618 - 1.786 Fibonacci extensions. Of course the March 10 low on the 1D MA200 (red trend-line) took place in the aftermath of the Silicon Valley Bank collapse, a fundamental event outside of the technical sphere. Better us the 4H MA200 (orange trend-line) as the targeted Support, by early next week it should be within the 1.618 - 1.786 Fib Zone.
The 4H RSI also has a clear Support Zone. Technically a Low within 25300 - 25000 seems a fair technical value with a Higher High at 30000, representing a solid short-term target. Do you also think such a pull-back would be healthy at this stage? Feel free to let us know in the comments section below!
-------------------------------------------------------------------------------
** Please LIKE 👍, FOLLOW ✅, SHARE 🙌 and COMMENT ✍ if you enjoy this idea! Also share your ideas and charts in the comments section below! **
-------------------------------------------------------------------------------
💸💸💸💸💸💸
👇 👇 👇 👇 👇 👇

BTC, Laught now, Cry laterBTC last correction is ending, next is heading to negative value
As we can see, comparing to oil chart during the covid crash, when in extreme market conditions, too much "dumb money" on same side, sharks take use of that to make big money while all the dumb money bets on the same side.
100k+ calls are a good example of the dumb money here in this market conditions when DXY is preparing a next leg to the upside.
I expect same conditions as it happened on oil during 2020, more the price falls, more longs will be added to the market, market will get irrational and drop as much as it needs to get all longs out, bellow 0 is a good number to get everyone out of longs
A good trade now, a short at any price, SL placed above 30k
And TP bellow 10k
Check previous charts as I predicted euro crash before it happened as well during 2021

Bitcoin BTCUSD next MovePair : BTCUSD ( Bitcoin / U.S Dollar )
Description :
Break of Structure
Divergence
Symmetrical Triangle
Bullish Channel in LTF as an Corrective Pattern
Completed " 1234 " Impulsive Wave
Breakout the S / R Level

Bitcoin H1Here is my view for BTCUSD on H1. The price could go bullish, you can put a pending order on the Order block or find an entry on LTF within OB Zone. Trade Safe!

BITCOIN Cycle comparison and how China bonds initiate new Bull!This is not the first time we incorporate the Chinese bond yields element (CN02Y/CN20Y) to Bitcoin (BTCUSD) analysis, but it is the first time we do so in such an illustrative way by displaying all Cycles from a common starting point. We have made a case in the past how strong of a correlation the Chinese bond market has with Bitcoin and how efficiently that can predict its Cycles.
As you see on the chart, each Cycle portrays a certain period: Red = Cycle 1 -2 (2010 - 2014), Blue = Cycle 2 - 3 (2015 - 2018) and Orange = Cycle 3 - 4 (2019 - now). The CN02Y/CN20Y ratio is displayed in Grey. A key characteristic is that all Cycles have a common start, the bottom of the previous one. We see the effect of diminishing returns as each Cycle is less aggressive (naturally) from the previous one.
We also see the strong connection with CN02Y/CN20Y, as when the ratio starts declining, BTC enters a Bear Cycle, and once the ratio starts rising, BTC initiates a Bull Cycle. Right now it appears that we are at the point where the CN02Y/CN20Y ratio typically peaks and consolidates, which for BTC is translated to the time it breaks above its 1W MA50 and practically starts a new aggressive rally, the first of the new Bull Cycle.
Based on this model, Bitcoin should extend the rally it started this year. Do you agree? Feel free to let us know in the comments section below!
-------------------------------------------------------------------------------
** Please LIKE 👍, FOLLOW ✅, SHARE 🙌 and COMMENT ✍ if you enjoy this idea! Also share your ideas and charts in the comments section below! **
-------------------------------------------------------------------------------
💸💸💸💸💸💸
👇 👇 👇 👇 👇 👇

BTCUSD- Upcoming Big Reversal on Bitcoin!!! hey everyone, BITCOIN spiked up due to collapsed of SVB BANK alongside gold, this is due to the uncertainty that market created. As we are looking for upcoming moves we are expecting prices to be bullish until 28k after we have where we believe that price will reject.
GOOD LUCK AND HAPPY TRADING.
