Current BTC Trend Analysis and Trading RecommendationsToday's overall BTC market rebounded after hitting a low of 102,614 in the early trading session, with Bitcoin's price maintaining a slow upward trend throughout the day. The intraday high reached 105,912 but encountered resistance. As the weekend approaches, historical market data shows limited volatility during weekends, so range-bound fluctuations are expected for the weekend.
From the current overall market rhythm, the price has rebounded slightly today after the previous decline. The hourly chart shows consecutive upward candles, though the price movement remains relatively slow. As time progresses, the price is expected to sustain an upward trend after pullbacks, and breaking through the short-term resistance level is only a matter of time. In terms of short-term structure and pattern, despite slight resistance and minor pullbacks, the downward momentum has weakened. We can still focus on long positions at lower levels, paying attention to the 106,000 resistance level.
BTCUSD
buy@104000-104500
tp:106000-107000
Investment itself is not the source of risk; it is only when investment behavior escapes rational control that risks lie in wait. In the trading process, always bear in mind that restraining impulsiveness is the primary criterion for success. I share trading signals daily, and all signals have been accurate without error for a full month. Regardless of your past profits or losses, with my assistance, you have the hope to achieve a breakthrough in your investment.
Btcusdsignals

BTC/USD – Bearish Continuation from Rising Channel BTC/USD – Bearish Continuation from Rising Channel 🚨🧱
This chart indicates a bearish market structure with the following key technical features:
🔍 Chart Analysis:
Change of Character (CHoCH) 🔄
A shift from bullish to bearish was confirmed by a strong breakdown after the CHoCH marked at the top.
This breakdown invalidated previous bullish structure.
Bearish Flag Formation 📉📐
After the impulsive drop, price formed a bearish flag (rising channel), suggesting a potential continuation move to the downside.
Resistance Rejection 🚫
Price is currently testing and rejecting the 105,800–106,500 resistance zone, previously a support turned resistance.
The rejection from this level adds further bearish confluence.
Downside Projection ⬇️📍
If the pattern plays out, the projected move shows a potential drop toward the major support zone at 100,000–101,000.
📌 Key Levels:
Resistance Zones:
105,800–106,500 🧱
109,500–111,000 🧱
Support Zone:
100,000–101,000 💚
🧠 Conclusion:
The chart suggests that BTC/USD is in a bearish continuation phase, with strong rejection from key resistance and a confirmed breakdown from a bearish flag. Traders should watch for confirmation of continuation below 104,500 to target the 100k support level. Risk management is crucial near volatile zones.

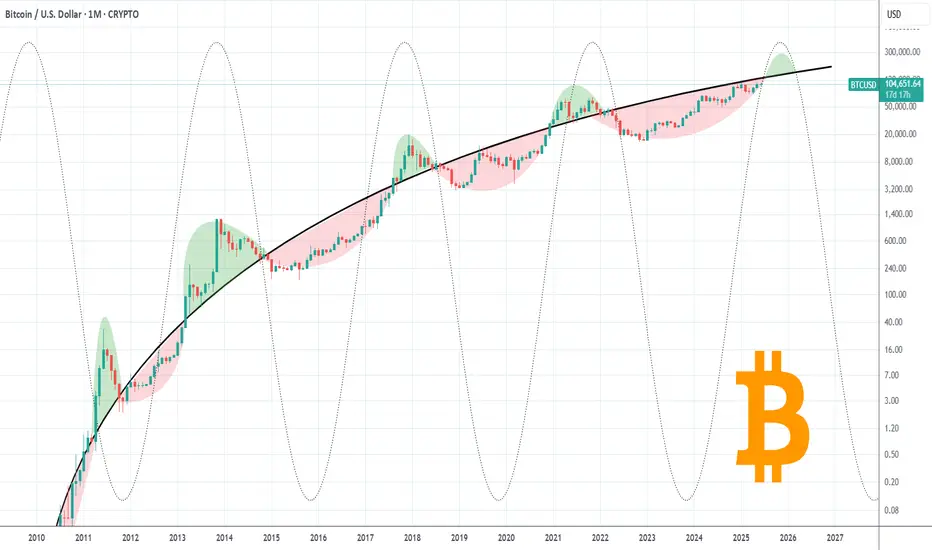
BITCOIN is only now starting the final Cycle rally!Bitcoin (BTCUSD) took a hit overnight following the Israel attack on Iran and at the moment the consequences of that action can't be quantified in great detail but on the long-term the bullish trend seems intact.
In fact it remains below the historic Pivot Growth Curve (PGC) that has separated BTC's peak pattern (green Arcs) from bottom and accumulation (red Arcs), and could be tested by next month.
Once broken, the real rally towards the Cycle's peak can start, with most previous studies we conducted showing that $150000 is a fair (if not modest) estimate.
Are you worried about the latest geopolitical conflict or this chart is enough to give you long-term assurances? Feel free to let us know in the comments section below!
-------------------------------------------------------------------------------
** Please LIKE 👍, FOLLOW ✅, SHARE 🙌 and COMMENT ✍ if you enjoy this idea! Also share your ideas and charts in the comments section below! This is best way to keep it relevant, support us, keep the content here free and allow the idea to reach as many people as possible. **
-------------------------------------------------------------------------------
💸💸💸💸💸💸
👇 👇 👇 👇 👇 👇
BITCOIN Megaphone is the last step before $150k.Bitcoin (BTCUSD) is repeating almost to the exact point the 2023/ 2024 uptrend, as right now it is in the process of forming a Megaphone pattern similar to the one during December 2023 - January 2024.
Before that, both patterns started the uptrend when a 1D Death Cross formed the bottom. After the 1st Bullish Leg, a Channel Up on a 1D Golden Cross marked the transition to the 2nd Bullish Leg that eventually led to the Megaphone.
In 2024, when BTC broke above the Megaphone, it started the final Bullish Leg that peaked a little above the 1.786 Fibonacci extension from the bottom. During that process, the 1D RSI sequences among the two fractals have been similar.
As result, aiming for the $150000, which is marginally below the 1.786 Fib ext, is a solid target.
Do you think the pattern will continue to be repeated? Feel free to let us know in the comments section below!
-------------------------------------------------------------------------------
** Please LIKE 👍, FOLLOW ✅, SHARE 🙌 and COMMENT ✍ if you enjoy this idea! Also share your ideas and charts in the comments section below! This is best way to keep it relevant, support us, keep the content here free and allow the idea to reach as many people as possible. **
-------------------------------------------------------------------------------
💸💸💸💸💸💸
👇 👇 👇 👇 👇 👇

Evening BTC Trend Analysis and Trading RecommendationsDuring the morning session, the Bitcoin price continued its upward momentum from the previous night, surging to an intraday high of 110,653. Subsequently, as bullish momentum gradually waned, the price entered a volatile downward channel. Consecutive bearish candles triggered a significant retracement of earlier gains. In the afternoon, supported by the hourly moving average, Bitcoin saw a brief rebound, climbing to 109,852 as U.S. stocks opened. However, bears quickly regained control, pushing the price down to 108,282 before stabilizing, after which it entered horizontal consolidation. The current price remains around 109,000. Notably, our previous short strategy at 109,800 precisely aligned with the trend, successfully realizing the expected profit.
Current trading advice: Consider light short positions within 109,400–109,700, targeting around 108,500. If the price effectively holds support and stabilizes at 108,500, you may attempt light long positions to speculate on a rebound.
BTCUSD
sell@109400-109700
tp:108500-107500

BTC/USD Technical Outlook – Potential Bearish Continuation BelowBTC/USD Technical Outlook – Potential Bearish Continuation Below Resistance 📉🧊
Chart Overview:
The chart illustrates a clear bearish rejection from a major resistance zone (⚠️ 110,000–111,000 USD), followed by the emergence of a bearish engulfing candle 🔻 marked in orange. This move suggests selling pressure has returned after a short-term bullish rally.
Key Zones & Levels:
🔵 Resistance Zone: 110,000–111,000 USD
Price was rejected from this region with a strong bearish reaction.
🟣 Mid-level Support: 105,531 USD
Currently acting as an interim level — if broken, it may lead to deeper declines.
🔵 Support Zone: 100,500–101,500 USD
This is the next strong demand area — price previously rebounded strongly from here.
Technical Signals:
✅ Double Top Structure formation at the resistance zone, indicating trend exhaustion.
❌ Bearish Engulfing Candle near resistance, confirming reversal strength.
📉 Downward Momentum Arrow suggests possible continuation toward support.
🔻 Lower Highs Formation reinforces bearish sentiment after failed breakout attempts.
Projection 🎯:
If the price closes below 105,531, a bearish continuation is likely, targeting the support zone at 101,000–100,500.
Conversely, a strong bounce above this level could delay the drop, but upside is capped below 110,000 unless a breakout occurs.
Summary:
🧭 Bias: Bearish below 105,531
📍 Targets:
Immediate: 105,531 (key level)
Bearish Target: 101,000
Invalidated if: price reclaims and closes above 110,000 with strength
📊 Trader's Note: Look for confirmation of breakdown with volume or candle close before short entry. Set tight risk management due to volatility.

BTCUSDT – Bearish signs emerge below resistanceAfter a strong bullish run, BTCUSDT is now showing clear signs of weakness near the resistance zone around 109,600–112,000. Price action has formed a cluster of rejection candles at the top, failing to break above this key level – signaling that selling pressure is gaining control.
The current structure suggests a potential trend reversal, especially as the latest bearish candle came with rising volume, confirming selling interest from the supply zone. If the price breaks below the 101,500 support, BTC may continue dropping toward the 93,500–84,500 range – a high-liquidity area on the volume profile.
The previous bullish momentum appears to have lost strength, and this pullback may be confirming a shift after reaching its upper limit. As long as BTC remains below the 112,000 resistance, the bearish bias remains dominant.

BITCOIN Is 'Bullish June Seasonality' about to kick-in?Bitcoin (BTCUSD) has started June on a very promising note, recovering most of last week's losses and is potentially headed for a new All Time High (ATH). This however, should be no surprise as BTC has exhibited amazing strength during the month of June and onwards since 2013.
As this chart shows, the market has historically rallied on June, in fact it is the month that kick-started Bitcoin's final rallies towards the Top on its last three Cycles.
Based on the 2W RSI, which is ranging within the 0.236 - 0.618 Fibonacci levels, we can argue that the price action is closer to June 2017 than other Cycles. As to how high it can get to, we've analyzed that on other studies, the current analysis only serves to show you that historically we are set for a strong 'Bullish June Seasonality' effect.
Do you agree that this is about to kick-in? Feel free to let us know in the comments section below!
-------------------------------------------------------------------------------
** Please LIKE 👍, FOLLOW ✅, SHARE 🙌 and COMMENT ✍ if you enjoy this idea! Also share your ideas and charts in the comments section below! This is best way to keep it relevant, support us, keep the content here free and allow the idea to reach as many people as possible. **
-------------------------------------------------------------------------------
💸💸💸💸💸💸
👇 👇 👇 👇 👇 👇

Technical Analysis – BTC/USD Technical Analysis – BTC/USD
📅 Date: June 11, 2025
🔍 Key Observations:
🔴 Resistance Zone – $110,000 to $111,800
Price has tested this resistance block twice (🔴 red arrows) and rejected both times, indicating strong selling pressure in this zone.
Rejection candles show long upper wicks, suggesting failed attempts by bulls to break above.
🟢 Support Zone – $101,800 to $103,500
This demand zone has been respected multiple times (🟢 green arrows), showing a solid base for potential bounces.
Price action previously rallied strongly after touching this level.
📦 Supply to Demand Play
Price made a sharp bullish move from support to resistance (📘 blue box shows the impulsive move).
After reaching resistance, the price is failing to break above, indicating possible exhaustion of bullish momentum.
📉 Potential Move:
🔽 Short-Term Bearish Bias
If price fails to hold current levels and breaks below the small consolidation (after blue box), we may see a drop to ~$105,583 (🔵 purple line = key level).
If that breaks, next likely destination is the support zone around $102,000 (⬇️ downward arrow path).
⚠️ Risk Notes:
🔁 Watch for any false breakouts or liquidity grabs above resistance.
📉 If bearish momentum increases below $105,583, sellers may take control in the short term.
✅ Trade Idea (Hypothetical):
Sell/Short near resistance (⚠️ confirmation needed like bearish engulfing or failed breakout)
Target 1: $105,583
Target 2: $102,000 zone
Stop-loss: Above $111,800 (invalidates setup)
📌 Summary:
BTC/USD is currently stuck between a well-defined resistance and support range. Unless bulls break above $111,800 with strong momentum, the structure favors a potential pullback toward the demand zone. ⚖️

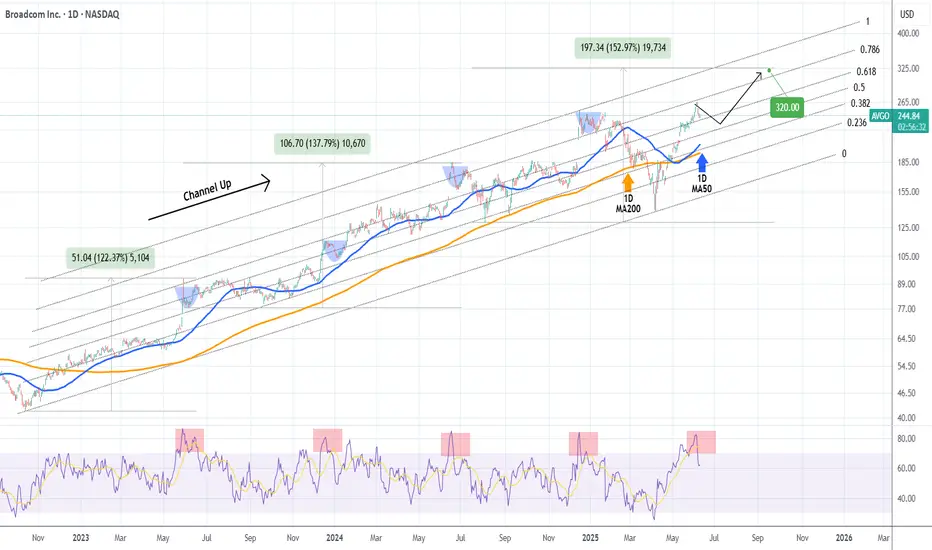
BROADCOM Pull-back to demand zone possible before new High.Broadcom Inc. (AVGO) is currently on a 3-day pull-back that started right on the 0.786 Fibonacci level of the 2.5 year Channel Up. The 1D RSI got heavily rejected from deep inside the overbought zone (>70.00) to back down below it and the only times that happened within this pattern, was during short-medium term pull-backs towards its 1D MA50 (blue trend-line).
As a result, the current pull-back can extend a little more towards the 1D MA50 and then rebound. Given a +15% added increas on each Bullish Leg of the Channel Up, we expect to see $320 next.
-------------------------------------------------------------------------------
** Please LIKE 👍, FOLLOW ✅, SHARE 🙌 and COMMENT ✍ if you enjoy this idea! Also share your ideas and charts in the comments section below! This is best way to keep it relevant, support us, keep the content here free and allow the idea to reach as many people as possible. **
-------------------------------------------------------------------------------
💸💸💸💸💸💸
👇 👇 👇 👇 👇 👇
Analysis of the Current BTCUSD Trend and Trading RecommendationsFrom a technical perspective, the bearish trend in BTC is temporarily dominant. On the four-hour chart, the price has trended downward with consecutive negative candles after being pressured, clearly indicating a bearish trend. Although small lower shadows suggest that bulls and bears are still locked in a tug-of-war, the RSI indicator is near the overbought zone at 70, and while the MACD remains positive, its momentum continues to weaken—both signals imply insufficient upward momentum and lingering adjustment pressure.
On the hourly chart, BTC has entered a consolidation phase with alternating positive and negative candles after a unilateral downward move. Currently, the Bollinger Bands are narrowing and moving sideways, indicating that future volatility may be limited. The price is now hovering near the upper band of the range, facing technical resistance.
In terms of the afternoon trading strategy, given the bearish dominance and fading upward momentum, the focus should remain on shorting at highs. Aggressive traders can lightly position for short-term rebounds but must use small positions and set strict stop-losses; prudent traders should wait patiently for higher levels to initiate short positions.
BTCUSD
sell@109800-110300
tp:108500-107500
Investment itself is not the source of risk; it is only when investment behavior escapes rational control that risks lie in wait. In the trading process, always bear in mind that restraining impulsiveness is the primary criterion for success. I share trading signals daily, and all signals have been accurate without error for a full month. Regardless of your past profits or losses, with my assistance, you have the hope to achieve a breakthrough in your investment.

BITCOIN The beauty of structured patterns. $150k is next.Bitcoin (BTCUSD) has invalidated all bias calling for a deeper pull-back after May's new All Time High (ATH), as yesterday it broke above the previous ATH Resistance, invalidating the short-term Head and Shoulders pattern, while rebounding last week exactly on the dashed Lower Highs trend-line, confirming it as a Support level.
Within BTC's 3 year Channel Up pattern, we have seen this price action structure another 3 times. The minimum rise on such pattern has been +101% and that wasn't even a Lower Highs rebound. The other two that were exactly like the current formation, increased by a lot more.
As a result, we expect Bitcoin to complete a minimum +101% rise from the April 07 bottom, which translates to a clean $150000 Target.
Do you think the structure ill continue to hold up to $150k and possibly beyond? Feel free to let us know in the comments section below!
-------------------------------------------------------------------------------
** Please LIKE 👍, FOLLOW ✅, SHARE 🙌 and COMMENT ✍ if you enjoy this idea! Also share your ideas and charts in the comments section below! This is best way to keep it relevant, support us, keep the content here free and allow the idea to reach as many people as possible. **
-------------------------------------------------------------------------------
💸💸💸💸💸💸
👇 👇 👇 👇 👇 👇

BTC Bears Eye 100000 Break; Short at 107000 -108000 ResistanceBTC's downward movement failed to break through 100,000📉, but there is a clear downward trend, and breaking below 100,000 is only a matter of time⏳. In the short term, shorting at high levels can be considered📉. The upward resistance currently has difficulty breaking through 110,000🚧, and shorting can now be considered in the resistance range of 107,000-108,000📉
⚡️⚡️⚡️ BTCUSD ⚡️⚡️⚡️
🚀 Sell@ 107000 - 106000
🚀 TP 102000 - 98000
Accurate signals are updated every day 📈 If you encounter any problems during trading, these signals can serve as your reliable guide 🧭 Feel free to refer to them! I sincerely hope they'll be of great help to you 🌟 👇

BITCOIN Log Channel and Waves show we're nowhere near the top.This is Bitcoin (BTCUSD) on its Logarithmic Growth Channel with the use of Rainbow Waves on it. This model accounts for the Halvings (light blue vertical lines) and with the use of Fibonacci Time extensions, it estimates the potential Cycle Bottoms (green vertical lines) and Tops (red vertical lines) within the Parabolic Growth Curve.
A fair value is estimated around the purple trend-line (zone top and bottom) as well as a maximum (red trend-line) and minimum (light blue trend-line) wave.
Interestingly enough, BTC hit that minimum wave trend-line on the April 07 2025 Low for the first time since June 17 2017, making it the strongest buy signal we could get at this stage of the Cycle.
So based on all the above, Bitcoin is nowhere near the top of its Cycle and this isn't just because it hasn't yet touched the next red vertical line (Time Fib 4.382) which is on October 27 2025, but also because it is currently trading below the Fair Value Zone (even below its bottom half).
Both previous Cycles topped considerably above that Fair Value Zone and almost hit the maximum wave. Even if by October 27 2025, Bitcoin 'only' hits the purple (Fair Value) trend-line, it would have reached $135000 and if earlier it can even hit $145000. That is the bare minimum based on that model. If it hits the top of the Fair Value Zone by October 27, then we can see prices as high as $180000 even.
Which price do you think we are more likely to see? Feel free to let us know in the comments section below!
-------------------------------------------------------------------------------
** Please LIKE 👍, FOLLOW ✅, SHARE 🙌 and COMMENT ✍ if you enjoy this idea! Also share your ideas and charts in the comments section below! This is best way to keep it relevant, support us, keep the content here free and allow the idea to reach as many people as possible. **
-------------------------------------------------------------------------------
💸💸💸💸💸💸
👇 👇 👇 👇 👇 👇

Bitcoin (BTC/USD) 1H Chart Analysis – Double Top Signals BearishPattern Formed: DOUBLE TOP
⚠️ Bearish Reversal Pattern Spotted!
📍 Formed near 111,794.8
⬆️ Price tested the top twice and failed – strong resistance confirmed!
Key Zones:
🔶 SUPPLY ZONE (Resistance):
🟧 111,794.8 - 111,829.8
🔼 Expect selling pressure here!
🔷 SUPPORT Zone (Broken!):
🔻 Price fell below this level, confirming a bearish breakout
🟩 TARGET ZONE:
🎯 102,500.0
✅ This is the likely drop target based on the pattern
🧊 Other minor supports:
* 102,820.6
* 102,750.8
* 102,227.0.
Indicators:
📈 Trend Line
* Supported the price during the uptrend
* ❌ Now broken — indicates momentum shift
📉 EMA 70 (Red Line)
* Current Price (108,238.6) is below EMA 70 = 109,245.0
* Indicates bearish pressure.
Trade Setup:
🔽 Short Entry Idea: After support break
🛑 Stop Loss: 111,829.8
🎯 Take Profit: 102,500.0
⚖️ Risk-Reward looks attractive!
Summary:
📉 Bearish bias confirmed by:
* Double Top pattern
* Supply zone rejection
* Support break
* EMA crossover
🚨 Traders Watch Out: Bears are in control — next major stop likely at 102,500.0!

BITCOIN under brutal 4H squeeze. Buyers or sellers will prevail?Bitcoin (BTCUSD) is currently under the strongest squeeze we've seen this year as it's being compressed between the 4H MA50 (blue trend-line) and 4H MA200 (orange trend-line). Such tight price action usual precedes explosive moves.
Technically two patterns prevail: a long-term Channel Up and a short-term Head and Shoulders (H&S). Naturally, as long as the Channel Up holds (and is still valid), the pattern will attempt to push the price to he 2.0 Fibonacci extension at $121500 (and higher). If on the other hand it breaks (4H MA200 would be an early signal), the H&S may push the price to the -1.0 Fibonacci extension at $95000.
So what do you think? Which pattern will prevail? Feel free to let us know in the comments section below!
-------------------------------------------------------------------------------
** Please LIKE 👍, FOLLOW ✅, SHARE 🙌 and COMMENT ✍ if you enjoy this idea! Also share your ideas and charts in the comments section below! This is best way to keep it relevant, support us, keep the content here free and allow the idea to reach as many people as possible. **
-------------------------------------------------------------------------------
💸💸💸💸💸💸
👇 👇 👇 👇 👇 👇

BITCOIN Will it catch up to the rising Global Liquidity again?Bitcoin (BTCUSD) is attempting to stage yet another short-term rally on its Tariff War recovery Bullish Leg but the picture is even more interesting on the long-term.
This is a simple yet very powerful and explanatory chart where it shows that every time the Global Liquidity (blue trend-line) led the uptrend and started rising before BTC on this Bull Cycle (since the November 2022 bottom), BTC eventually caught up to the trend and closed the Gap.
This time Global Liquidity has been rising since the start of the year (early January) while Bitcoin only started to do so since April 07. Even if the Global Liquidity pauses here, Bitcoin still has the potential to continue rising irrespectively.
How high do you think this can go? Feel free to let us know in the comments section below!
-------------------------------------------------------------------------------
** Please LIKE 👍, FOLLOW ✅, SHARE 🙌 and COMMENT ✍ if you enjoy this idea! Also share your ideas and charts in the comments section below! This is best way to keep it relevant, support us, keep the content here free and allow the idea to reach as many people as possible. **
-------------------------------------------------------------------------------
💸💸💸💸💸💸
👇 👇 👇 👇 👇 👇

BITCOIN Is this even a possibility?Bitcoin (BTCUSD) is currently on a short-term pull-back, following the impressive rally to new All Time Highs (ATH) from the April 07 bottom. This first 'serious' short-term relief correction has stopped on the former Lower Highs trend-line, which previous acted as a Resistance and is now holding the price from further downfall, acting potentially as Support.
This is the exact same price action that BTC had during its break-out from the previous Lower Highs trend-line last October. The symmetry between the two fractals is remarkable as not only did they both form their 1D Death Cross patterns on their bottoms and their 1D Golden Cross patterns on the Lower Highs break-out but also their Phase 1 rallies (1st Bullish Leg) have been exactly the same: +49.58%.
As a result, as long as the Pivot holds, there is a good chance we see a strong rebound, which if it holds the same total symmetry of the previous fractal, it should peak at +120%, which gives a $164000 Target.
Do you think that's even a possibility? Feel free to let us know in the comments section below!
-------------------------------------------------------------------------------
** Please LIKE 👍, FOLLOW ✅, SHARE 🙌 and COMMENT ✍ if you enjoy this idea! Also share your ideas and charts in the comments section below! This is best way to keep it relevant, support us, keep the content here free and allow the idea to reach as many people as possible. **
-------------------------------------------------------------------------------
💸💸💸💸💸💸
👇 👇 👇 👇 👇 👇

earish trand analysis Read The ChaptianSMC trading point update
Technical analysis of (BTC/USDT) based on the 4-hour timeframe. Here’s a detailed breakdown of the analysis and the idea behind it:
---
Key Components of the Analysis:
1. Resistance Zone (FVG - Fair Value Gap):
The yellow zone marked as “fvg resistance level” indicates an area where price previously dropped quickly, suggesting inefficiency or imbalance in the market.
Price is approaching this zone again, which acts as a strong resistance.
2. Trendline & Lower Highs:
A descending trendline (with red arrows) shows consistent lower highs, indicating ongoing bearish pressure.
Each rejection from the trendline reinforces sellers’ dominance.
3. CHOCH (Change of Character):
The label “choch” signifies a market structure break, where bullish structure turned bearish.
This marks the transition to a downtrend.
4. EMA 200 (Exponential Moving Average):
The EMA (currently around 102,753) acts as dynamic support.
Price is currently trading above it, but a rejection from the resistance may push it below.
5. Target Zone:
A yellow box near 100,817.99 is labeled “target point”, indicating a possible short-term bearish target if price gets rejected at resistance.
6. RSI (Relative Strength Index):
RSI is around 47.11, slightly below neutral (50), suggesting bearish momentum could be building.
No clear oversold or overbought conditions yet.
---
Trade Idea Summary:
Bias: Bearish
Scenario:
If price reaches the resistance zone (~106,800–107,500) and fails to break above, a sell-off is expected.
First target: 100,800–101,000 zone
Price may also dip below EMA 200 confirming bearish strength.
Confirmation:
Rejection candle or bearish engulfing pattern near resistance.
RSI staying below 50 and starting to dip.
Invalidation:
Clean breakout and close above the resistance zone and trendline (~108,000+).
Mr SMC Trading point
---
Conclusion:
This chart sets up a high-probability short trade around the resistance area, leveraging both structural and momentum indicators. It suggests waiting for confirmation of rejection before entering, targeting the previous support and imbalance zone below.
Pales support boost 🚀 analysis follow)

BITCOIN Can the 4H MA200 hold and kickstart the next rally? Bitcoin (BTCUSD) almost hit on Saturday its 4H MA200 (orange trend-line), which has been holding since April 16, and immediately rebounded. So far the bullish reaction is moderate as the price action is still being restricted below the 4H MA50 (blue trend-line), which is now acting as the short-term Resistance.
The blue Arc pattern that BTC has formed in the past 3 weeks, resembles the last two peak formations and pull-backs since the early April bottom. On top of all this, the 4H RSI got oversold (30.00) actually for the first time since the April 07 bottom.
With the weakest rally of this long-term Bullish Leg being +16.06%, if the 4H MA200 holds and a 4H MA50 break-out confirms it, we can expect a minimum short-term rise of almost $120k (+16.06%).
Do you think that's what's coming next? Feel free to let us know in the comments section below!
-------------------------------------------------------------------------------
** Please LIKE 👍, FOLLOW ✅, SHARE 🙌 and COMMENT ✍ if you enjoy this idea! Also share your ideas and charts in the comments section below! This is best way to keep it relevant, support us, keep the content here free and allow the idea to reach as many people as possible. **
-------------------------------------------------------------------------------
💸💸💸💸💸💸
👇 👇 👇 👇 👇 👇

BTCUSD Bearish Signal | Technical + Custom AlgoSmart Trend Signal | Technical Analysis + Custom Algorithm
This signal is the result of a combination of classic technical trend analysis and a proprietary software I personally developed.

BITCOIN (BTCUSD): A Deeper Correction?!
After Bitcoin updated the All-Time High, the market became
weak and exhausted.
A violation of a support line of a rising channel and a breakout
of a key horizontal support indicate a highly probable continuation
of a correction.
Our closest demand zone is 103200. It can be the goal for the sellers for now.
❤️Please, support my work with like, thank you!❤️

BITCOIN targets 165k based on VIX's 10-year SupportBitcoin (BTCUSD) has started a new (and possibly last for this Cycle) Bullish Leg following April's bottom and has already made a new All Time High (ATH).
The BTC/VIX ratio on that very same day (April 07 2025) hit and rebounded on its 10-year Higher Lows trend-line, a Support level that has been holding since the August 24 2015 market bottom.
Every rebound on this Higher Lows trend-line, has produced a strong medium-term rally, the 'weakest' of which has been the most recent (August - December 2024), which rose by +121.44%. If BTC repeats this 'minimum', we are looking at a $165000 High, which aligns perfectly with the majority of projections for this Cycle's Top.
Do you think we will see that price by October? Feel free to let us know in the comments section below!
-------------------------------------------------------------------------------
** Please LIKE 👍, FOLLOW ✅, SHARE 🙌 and COMMENT ✍ if you enjoy this idea! Also share your ideas and charts in the comments section below! This is best way to keep it relevant, support us, keep the content here free and allow the idea to reach as many people as possible. **
-------------------------------------------------------------------------------
💸💸💸💸💸💸
👇 👇 👇 👇 👇 👇
