BITCOIN Desperately needs that weekly closing!Bitcoin (BTCUSD) broke last week above its January Resistance, effectively making a new All Time High (ATH). Technically, within BTC's dominant 2.5-year Channel Up, that is not enough to generate a bullish extension on its own and the reason is that a 1W candle closing above the Resistance level is needed and not just a break.
At least that's what happened during the last two Bullish Legs, where it required a convincing 1W candle close considerably above the Resistance, to confirm the Bullish Extension. In fact the break-out candles on both previous Bullish Legs is fairly identical.
The minimum % rise on the pattern's three Bullish Legs has been +96.75% with the others not falling way off that range (+98.74% and +106.94%). As a result, the bare minimum Target we can be expecting, in the event of a 1W candle closing above the $109500 Resistance, is $147000.
Do you think that' within the market's immediate reach? Feel free to let us know in the comments section below!
-------------------------------------------------------------------------------
** Please LIKE 👍, FOLLOW ✅, SHARE 🙌 and COMMENT ✍ if you enjoy this idea! Also share your ideas and charts in the comments section below! This is best way to keep it relevant, support us, keep the content here free and allow the idea to reach as many people as possible. **
-------------------------------------------------------------------------------
💸💸💸💸💸💸
👇 👇 👇 👇 👇 👇
Btcusdsignals

BITCOIN No different than all the Bullish Legs since 2023!Bitcoin (BTCUSD) has just completed a Golden Cross on the 1D time-frame, the 4th such pattern since February 05 2023. All those Golden Crosses have been formed marginally after the Channel Up bottoms and start of their respective Bullish Legs.
The current pattern is no different than any other of those Bullish Legs. On top of that, the 1W MACD has also formed its usual Bullish Cross that has technically always preceded the 1D Golden Cross.
Given that, when this happens, BTC tends to be at least near the 0.5 Fibonacci level from the eventual top, we can estimate that the next peak might be around $165000. This is another indicator that makes our $150k Target for this Cycle more than realistic.
But what do you think? Are you also expecting the market to explode past $150k? Feel free to let us know in the comments section below!
-------------------------------------------------------------------------------
** Please LIKE 👍, FOLLOW ✅, SHARE 🙌 and COMMENT ✍ if you enjoy this idea! Also share your ideas and charts in the comments section below! This is best way to keep it relevant, support us, keep the content here free and allow the idea to reach as many people as possible. **
-------------------------------------------------------------------------------
💸💸💸💸💸💸
👇 👇 👇 👇 👇 👇

BITCOIN repeating every Cycle's final rally!Bitcoin (BTCUSD) has been on a strong rally since the April 2025 bottom on the 1W MA50 (blue trend-line) and that's perfectly aligned with the 1W MA50 rebound it had on the previous two Cycles in June 2021 and June 2017.
As you can see, those (blue circles) where the All Time High (ATH) Pivot trend-line test before the final (parabolic) rally of the Cycle started, which was its most aggressive part.
In 2017 it was much stronger and the price rallied much higher, which is natural as the market was much less mature (institutionally) than today, but it is not improbable to get a rally similar to July - November 2021.
Can that be enough to push BTC to $150k and beyond? Feel free to let us know in the comments section below!
-------------------------------------------------------------------------------
** Please LIKE 👍, FOLLOW ✅, SHARE 🙌 and COMMENT ✍ if you enjoy this idea! Also share your ideas and charts in the comments section below! This is best way to keep it relevant, support us, keep the content here free and allow the idea to reach as many people as possible. **
-------------------------------------------------------------------------------
💸💸💸💸💸💸
👇 👇 👇 👇 👇 👇

BITCOIN $119k coming shortlyBitcoin (BTCUSD) has been trading within a 6-week Channel Up and Friday's tariff threats led pull-back was its latest Bearish Leg. That pull-back hit the 4H MA50 (blue trend-line) yesterday and rebounded. As long as the 4H MA100 (green trend-line) which is directly below the Channel Up holds, the current rebound is technically the pattern's new Bullish Leg.
All 4 previous Bullish Legs have ended on fairly similar % rises but the weakest has been +11.41%. With the 4H MACD just now completing a Bullish Cross (which has always been a strong buy signal), a repeat of the +11.41% minimum, gives us an immediate $119000 Target.
Do you think that's coming shortly before the beginning of June? Feel free to let us know in the comments section below!
-------------------------------------------------------------------------------
** Please LIKE 👍, FOLLOW ✅, SHARE 🙌 and COMMENT ✍ if you enjoy this idea! Also share your ideas and charts in the comments section below! This is best way to keep it relevant, support us, keep the content here free and allow the idea to reach as many people as possible. **
-------------------------------------------------------------------------------
💸💸💸💸💸💸
👇 👇 👇 👇 👇 👇

BTC/USD) Make some trand analysis Read The ChaptianSMC trading point update
Technical analysis of Bitcoin (BTC) against USDT on a 4-hour timeframe using key price action concepts. Here's a breakdown of the idea conveyed:
Key Elements in the Chart:
1. Support and Resistance Zones:
Support Level (Yellow Boxes): Indicate areas where buying interest is strong enough to prevent the price from falling further.
Resistance Level: Zones where selling interest is strong enough to halt upward price movement.
These zones have been respected multiple times and serve as potential trade entry or exit points.
2. Breakout Strategy:
The chart highlights breakout points (black circles) above resistance zones, signaling strong bullish momentum.
After breaking resistance, price typically retests the zone as new support before moving higher—this is a classic breakout and retest structure.
3. Target Projection:
The vertical lines represent measured move projections, likely using the height of the prior consolidation range to estimate the next move.
The target point is marked around $112,559.59, indicating a bullish target following the breakout.
4. 200 EMA (Exponential Moving Average):
The 200 EMA at $96,827.38 acts as dynamic support, showing the overall bullish trend is intact.
5. RSI (Relative Strength Index):
RSI values (54.97 and 52.87) suggest neither overbought nor oversold conditions, implying room for further upside.
Mr SMC Trading point
---
Conclusion:
The analysis suggests a bullish continuation setup:
BTC has broken out from a consolidation range.
Retesting previous resistance as support.
The bullish target is $112,559.59 based on the breakout projection.
The trend remains bullish as long as price stays above the support zone and 200 EMA.
Pales support boost 🚀 analysis follow)

BTCUSD SHORT OPPORTUTY FOR THE WEEKENDBITCOIN SUPPLY ZONE TARGETED - SELL LIMIT SET 🔥
BTC/USD has made a strong move upward but is now approaching a major supply zone, where a Sell Limit is placed at 110997. This level aligns with previous highs and signs of distribution, signaling a potential reversal ahead.
With current price action consolidating around 109034, we are watching for rejection and a possible drop towards the next demand zones at 108551 and 106178.
This setup is ideal for smart traders looking to short the top and ride the retracement. As always, risk management is key. Let’s see how the market reacts.
Precision over prediction. Strategy over emotions.
#BTCUSD #BitcoinAnalysis #CryptoTrading #SellLimit #SmartMoneyConcepts #SupplyAndDemand #TechnicalAnalysis #DayTrading #CryptoSetup #BTCTrade #BearishSetup #PriceAction #CryptoSniper #BitcoinReversal #TradingStrategy #CryptoTraders #MarketStructure #XAUkingCharts

BTCUSDT 4H Analysis BTC ~ 4H Analysis
#BTC Let's start Long/Buy back at this support block with long term target of $120K - $130K - $140K - $150K above this is just bonus for you.

Trump Tariffs Risk Triggering BTC Crash as Capital Flows to GoldOn May 23rd's U.S. session, Trump's EU/Apple tariff plans sparked market chaos:
Gold surged 💥 as a safe haven.
The euro plunged on EU tariff fears.
If tariffs persist, capital may flood into gold/forex, likely triggering a BTC crash.
⚡⚡⚡ BTCUSD ⚡⚡⚡
🚀 Sell@110000 - 109000
🚀 TP 106500 - 104500
👇Accurate signals are updated every day 📈 If you encounter any problems during trading, these signals can serve as your reliable guide 🧭 Feel free to refer to them! I sincerely hope they'll be of great help to you 👇

BITCOIN is attempting to converge with past Cycles!Bitcoin (BTCUSD) is experiencing the weakest Bull Cycle in its history, a natural product of the Theory of Diminishing Returns (TDM).
This chart couldn't have put it better as we show all Cycles since BTC's first day, one on top of the other. Naturally the first Cycles were the most aggressive, witnessing extraordinary gains as the upside potential of a fresh market was enormous in its early days.
The 2015 - 2017 (blue trend-line) and 2019 - 2021 (black trend-line) Bull Cycles have been harmonized to a more traditional capital market state and this is obvious on their trend-lines, which exhibit similar parallel price action. Whenever the two diverged, they converged at some point during the Cycle.
The current Cycle (2023 - 2025) following the late February 2025 divergence, is now attempting to converge again with its strong rebound in the past 6 weeks. Being however within a Channel Up throughout the entirety of the Cycle, it appears that it will do so in a structured way and as the TDM suggests, will offer weaker gains.
What we can project, as we've shown on previous studies in great detail, is the timing of the Cycle Top. Based on past Cycles, it should be within October - December 2025. Timing your exit strategy can perhaps be more effective than assigning a certain Target, even though the peak is expected to be anywhere within the $150k - $200k range.
So do you agree that the rise we're witnessing is the Cycle's attempt to converge with past ones and close the gap before it tops? Feel free to let us know in the comments section below!
-------------------------------------------------------------------------------
** Please LIKE 👍, FOLLOW ✅, SHARE 🙌 and COMMENT ✍ if you enjoy this idea! Also share your ideas and charts in the comments section below! This is best way to keep it relevant, support us, keep the content here free and allow the idea to reach as many people as possible. **
-------------------------------------------------------------------------------
💸💸💸💸💸💸
👇 👇 👇 👇 👇 👇

BITCOIN made new ATH but still much time left before a Cycle topBitcoin (BTCUSD) is about to enter the final week of May, with the month mostly likely to close on a strong green candle, the 2nd straight. Though it made yesterday a new All Time High (ATH) above 109k and many are already talking about a bearish reversal, this chart shows that there is still plenty of time left before the current Bull Cycle tops.
If fact a simple measurement of the Bottom to Bottom and Bottom to Top ranges of the last 3 Cycles is enough to present all the evidence that are needed for this case.
As you can see, the previous 2 Bull Cycles lasted for 35 months (1065 days) from Bottom to Top. Similarly, the Bottom to Bottom (Bear Cycle to Bear Cycle) measurement has been 47 months (1430 days).
This amazing symmetry suggest that BTC is more likely than not to repeat this feat on the current Cycle as well. A 35 month range from Top to Top indicates that the Bull Cycle is expected to peak on October 2025, while a 47 month Bottom to Bottom range indicates that the next Bear Cycle should bottom in October 2026! As far as a potential price top is concerned, various of the previous analyses we've conducted show that $200k is a fair maximum, but the current study focuses on the timing of profit taking and not specific price levels.
So are you willing to book your profits by this October? Feel free to let us know in the comments section below!
-------------------------------------------------------------------------------
** Please LIKE 👍, FOLLOW ✅, SHARE 🙌 and COMMENT ✍ if you enjoy this idea! Also share your ideas and charts in the comments section below! This is best way to keep it relevant, support us, keep the content here free and allow the idea to reach as many people as possible. **
-------------------------------------------------------------------------------
💸💸💸💸💸💸
👇 👇 👇 👇 👇 👇

Bitcoin: Bullish Momentum Tests 109k, Eyes 110k
The Bitcoin price fluctuated in a narrow range near the 106,000 level 😊. After touching the 106,800 level, it failed to break through the 107,000 resistance level and subsequently fell back to consolidate near the 106,200 level 😐. Shortly after, the bulls regained momentum, pushing the price rapidly higher to hit a high of 109,410 🚀! Currently, the price is consolidating near the 109,100 level 🔄.
From a technical perspective, the 107,000 resistance level has turned into support after being broken, with short-term momentum favoring the bulls 👊. If the price can hold above 109,000, it may further challenge the psychological barrier of 110,000 🌟. However, caution is warranted regarding potential pullbacks from high levels 🚨. Key support below lies in the 107,000–106,200 range ⚠️.
For trading strategies: Short-term traders may consider light-position entry after the price stabilizes above 109,000, targeting 110,000 🎯. If the price pulls back and holds at the 107,000 support level, dip-buying opportunities may emerge 💰. Medium-term investors should adjust positions flexibly based on whether the 110,000 level is breached 📊.
Overall, market sentiment remains optimistic 😃, but attention should be paid to trading volume confirmation and unexpected news events 📢. Strict risk control and cautious operations are recommended ⚖️!
Buy@108000-108500
tp:109500-110500
Professional trading strategies are pushed daily 📊
Lock in precise signals amid market fluctuations 🚀
Confused about market trends? Stuck in strategy bottlenecks?
Real-time strategies serve as your "trading compass" 🌐
From trend analysis to entry/exit points, dissect market logic comprehensively
Refer now 📲
Help you move steadily forward in investments ✨
👇👇👇

BITCOIN Ultimate Cycle Zones breakdown! See when to sell!Bitcoin (BTCUSD) is extending its amazing rebound on its 1W MA50 (blue trend-line), having recovered all of the losses sustained following the U.S. - Chine Trade War. Based on this Cycle's pattern, this 1W MA50 rebound is technically the new Bullish Leg, essentially its 4th of this Cycle.
Among all this, we managed to identify another cyclical pattern, separating the Cycle in terms of Activity Zones:
Naturally its very bottom is what we call the 'Best Buy Zone' (green), where BTC's earliest and most optimal buy opportunities existed. That ranges within the 0.0 and 1.0 Fibonacci levels.
Above that it's the 'Final Buy Zone' (yellow) where in relative efficieny terms, the last long-term buy opportunities existed. That Zone consists of the 1.0 and 2.0 Fibonacci levels.
Third in line is the 'First TP Zone' (orange) where long-term investors who seek lower risk, can start taking profit on their positions. The range on that is the 2.0 - 3.0 Fibonacci levels.
Lastly it's the 'Fina TP Zone' (red) where obviously it is the last opportunity (and with the greatest return but also elevated risk) to take profits before the Cycle prices its Top. This consists of the 3.0 - 4.0 Fibonacci range.
As you may have noticed, each Zone has a .618 interval (highlighted in blue). Zone 1 has the 0.618 Fib, Zone 2 the 1.618 Fib, Zone 3 the 2.618 Fib and one 4 the 3.618 Fib. This is where (so far) the price has made a first consolidation - correction after the start of the new Bullish Leg and before it gets completed at the top Fib. The last such consolidation was from mid December 2024 to late January 2025 and as you see those tend to be significant marks.
This model shows that the current Bullish Leg should prepare us for the Final TP Zone and its first stop is the 3.0 Fib at $135k. This is the bottom of the Final TP Zone and the first region that long-term investors should consider taking profits. The key 3.618 Fib extension is at $210k and in our opinion is the absolute max level we should look to sell all positions as chronologically Cycle wise the trend falls there towards the end of the year, which is where all Cycles topped. A 4.0 Fib test is highly unlikely to take place within this Cycle, unless macroeconomic fundamentals (extreme adoption and/or monetary intervention) kick in and that sits at $280k.
But what do you think? Do you agree with this Zones break-down and if yes are you considering taking profits at 135000? Feel free to let us know in the comments section below!
-------------------------------------------------------------------------------
** Please LIKE 👍, FOLLOW ✅, SHARE 🙌 and COMMENT ✍ if you enjoy this idea! Also share your ideas and charts in the comments section below! This is best way to keep it relevant, support us, keep the content here free and allow the idea to reach as many people as possible. **
-------------------------------------------------------------------------------
💸💸💸💸💸💸
👇 👇 👇 👇 👇 👇

Shorting Analysis on Bitcoin - Fxdollars- {15/04/2025}Educational Analysis says that BTCUSD may give countertrend opportunities from this range, according to my technical analysis.
Broker - BITSTAMP
So, my analysis is based on a top-down approach from weekly to trend range to internal trend range.
So my analysis comprises of two structures: 1) Break of structure on weekly range and 2) External pushback to fill the remaining fair value gap
Let's see what this pair brings to the table for us in the future.
Please check the comment section to see how this turned out.
DISCLAIMER:-
This is not an entry signal. THIS IS ONLY EDUCATIONAL PURPOSE ANALYSIS.
I have no concerns with your profit and loss from this analysis.
I HAVE NO CONCERNS WITH YOUR PROFIT OR LOSS,
Happy Trading, Fx Dollars.

BITCOIN This Cycle's peak zone is $150k - $200k.Bitcoin (BTCUSD) is extending its gains week after week since the April 07 bottom on the 1W MA50, which as we've analyzed extensively its a new Higher Low launchpad for the new (current) Bullish Leg, the way it's been consistently doing on the Higher Lows trend-line since the start of this Bull Cycle.
It's in fact the very same Higher Lows trend-line it had during both previous Cycles, which ended up peaking on the Logarithmic Growth Curve's (LGC) top 2 zones (red), breaking also above the 2 SD above band (orange) of the Mayer Multiple Bands (MMB).
This time the price has 'only' broken above the 1 SD MMB (grey), while having breached into just the lower pink LGC zone. This highlights the theory of Diminishing Returns but at the same time also shows the strong upside potential of the market while subject to these conditions.
So assuming it won't hit by the end of this Cycle the 2 SD MMB nor the top 2 zones of the LGC, the bad case scenario seems to be topping the lower pink LGC zone and the good case scenario topping the upper pink LGC zone. Those two give a profit taking range of 150 - 200k respectively and based on the Sine Waves, we should peak around October 2025.
Is that your profit taking zone as well for this Cycle? Feel free to let us know in the comments section below!
-------------------------------------------------------------------------------
** Please LIKE 👍, FOLLOW ✅, SHARE 🙌 and COMMENT ✍ if you enjoy this idea! Also share your ideas and charts in the comments section below! This is best way to keep it relevant, support us, keep the content here free and allow the idea to reach as many people as possible. **
-------------------------------------------------------------------------------
💸💸💸💸💸💸
👇 👇 👇 👇 👇 👇

BITCOIN forming 1st 1D Golden Cross in 7 months! New ATH ahead??Bitcoin (BTCUSD) is about to form its first Golden Cross on the 1D time-frame in 7 months (since October 27 2024). This comes with the price very close to its $109k All Time High (ATH), following a relentless rebound and recovery from the Trade War correction.
Within the Bull Cycle's 2.5-year Channel Up, all 1D Golden Crosses have delivered higher prices instantly and the minimum % rise one has given before a new 1D MA50 (blue trend-line) pull-back, has been +33.11%.
This gives us an immediate Target of $135000 and is very much in line with a number of previous projections that the date show within this Target Region. Notice also how on all 3 last 1D Golden Crosses, a 1W MACD Bullish Cross precedes it. Basically that is the double confirmation of the medium-term bullish extension.
So do you think this 1D Golden Cross is such a strong buy signal and if yes, is $135k the bare minimum Target short-term? Feel free to let us know in the comments section below!
-------------------------------------------------------------------------------
** Please LIKE 👍, FOLLOW ✅, SHARE 🙌 and COMMENT ✍ if you enjoy this idea! Also share your ideas and charts in the comments section below! This is best way to keep it relevant, support us, keep the content here free and allow the idea to reach as many people as possible. **
-------------------------------------------------------------------------------
💸💸💸💸💸💸
👇 👇 👇 👇 👇 👇

BTC/USD 1-Hour Range Analysis: Key Levels & StrategieBTC/USD 1-Hour Chart Analysis 📊
Currently, BTC/USD is oscillating within the 101,500–105,000 range on the 1-hour chart 📈.
Key Levels
Support: 101,500 acts as short-term support 🛡️. Below that, the strong support lies at 100,600 — a breach of this key level could trigger a sharp price decline.
Resistance: 105,000 is a tough resistance level 🚧, with multiple failed upward attempts. The area above 106,000 forms a resistance zone, which bulls must overcome to initiate a significant uptrend.
Trend
The price is in a downward consolidation phase, with recent highs and lows gradually decreasing. However, chart patterns suggest a potential rebound after testing support, hinting at a possible short-term trend shift 🤔.
⚡⚡⚡ BTCUSD ⚡⚡⚡
🚀 Sell@105000 - 106000
🚀 TP 102500 - 101500
🚀 Buy@101500 - 102500
🚀 TP 105000 - 106000
Accurate signals are updated every day 📈 If you encounter any problems during trading, these signals can serve as your reliable guide 🧭 Feel free to refer to them! I sincerely hope they'll be of great help to you 🌟

BITCOIN Stairway to 134k.Bitcoin (BTCUSD) is unfolding a very interesting pattern since its April 07 bottom. That was at $74500 and since that level, it has been consistently targeting all 10k intervals above it: From 74k to 84k, 94k and is now on 104k.
Once it hit all those levels, the price consolidated, forming a very structured Channel Up. Now, the Channel Up may not hold forever but this consistency gives us the idea that it can continue targeting all those levels above it: 114k, 124k, 134k. If this pattern continues to hold for as much time as it has since the bottom, then we may see $134k by late June/ early July.
Do you think it is possible to stay this consistent for that long? Feel free to let us know in the comments section below!
-------------------------------------------------------------------------------
** Please LIKE 👍, FOLLOW ✅, SHARE 🙌 and COMMENT ✍ if you enjoy this idea! Also share your ideas and charts in the comments section below! This is best way to keep it relevant, support us, keep the content here free and allow the idea to reach as many people as possible. **
-------------------------------------------------------------------------------
💸💸💸💸💸💸
👇 👇 👇 👇 👇 👇

BITCOIN 's 'Final 6 months rally' kickstarts the Altseason!This isn't the first time we show you this chart but it couldn't be more relevant than today. We have established on previous analyses how Bitcoin (BTCUSD) has most likely started the final rally of its Cycle, historically the parabolic rally of the last 6 months of the Bull Cycle that ends with its Top.
The addition of today's analysis is that with Bitcoin Dominance (orange trend-line) approaching its 8-year Lower Highs trend-line, this 'Final 6 months rally' of BTC is what technically also starts the Altseason. This is when lower cap coins see massive gains compared to the high cap ones.
At the same time, we get one more confirmation of why a $150k BTC Target is realistic, as by the end of 2025, this price would still be on the 0.618 Fibonacci level of the 8-year Fib Channel Up, a rather 'bad case' scenario based on this pattern.
So what do you think? Will BTC's Final 6 months rally spark a massive Altseason too? Feel free to let us know in the comments section below!
-------------------------------------------------------------------------------
** Please LIKE 👍, FOLLOW ✅, SHARE 🙌 and COMMENT ✍ if you enjoy this idea! Also share your ideas and charts in the comments section below! This is best way to keep it relevant, support us, keep the content here free and allow the idea to reach as many people as possible. **
-------------------------------------------------------------------------------
💸💸💸💸💸💸
👇 👇 👇 👇 👇 👇

"Bearish Reversal Setup with Target at Key Support Zone (95,440 1. EMA Indicators:
50 EMA (red line): Currently at 103,112.73.
200 EMA (blue line): Currently at 98,739.46.
The price is above both EMAs, typically a bullish sign, but the analysis suggests a potential reversal.
2. Support Zone (Top Pink Box):
Around the 105,000–106,000 USD range.
Labeled as "support" but is likely being interpreted as a resistance now due to failure to break higher.
3. Target Zone (Bottom Pink Box):
Around the 95,000–96,000 USD range.
Marked as the "target point" for a potential drop.
4. Bearish Projection:
A curved arrow suggests a rejection from the current levels (~104,000 USD) leading down toward the target zone.
Large blue arrow emphasizes expected bearish momentum.
Interpretation:
The chart suggests a reversal from the recent highs and expects a decline toward the 95,440.94 USD support.
This could be driven by:
Rejection from resistance.
Overbought conditions.
Price losing momentum near the upper level.
Confirmation may be awaited via a break below the 50 EMA or loss of key support.
Strategy Implication:
Short bias if price fails to reclaim the resistance.
Take profit potentially near the 95,440 level.
Invalidation of the bearish scenario may occur on a strong breakout above the resistance zone (~105,700 USD).

BITCOIN making the FINAL PUSH! Only 6 months of BULL left!Bitcoin (BTCUSD) has had n astonishing symmetry among its Cycles in the past 11 years, as all three of the Bear Cycles have had identical durations (13 and 12 months twice) as well as the two Bull Cycles (both 35 months).
As a result, there is no reason to assume otherwise for the current Bull Cycle as well, which if it also lasts for 35 months, it will peak in October 2025. This means that BTC might 'only' have another 6 months of Bull Cycle ahead of it but that's not bad news as historically this phase tends to be the most aggressive part.
Even if it's not, various studies we've done before point out that a price around $150k would be more than fair and practically a 'pessimistic' scenario for the Cycle High.
Do you think that will be the case? Feel free to let us know in the comments section below!
-------------------------------------------------------------------------------
** Please LIKE 👍, FOLLOW ✅, SHARE 🙌 and COMMENT ✍ if you enjoy this idea! Also share your ideas and charts in the comments section below! This is best way to keep it relevant, support us, keep the content here free and allow the idea to reach as many people as possible. **
-------------------------------------------------------------------------------
💸💸💸💸💸💸
👇 👇 👇 👇 👇 👇

(BTC/USD) Short Trade Setup: Key Resistance Rejection with Targe1. Entry Point: 104,855
This is where the trader plans to enter a short position (sell).
Price is slightly below this level at the moment (103,775).
2. Stop-Loss Zone: ~104,807
Highlighted in purple above the entry.
Indicates where the trader will exit if the market moves against them to limit losses.
3. Resistance Point: 103,086
This level has been tested multiple times and may act as a ceiling for prices.
If broken and held, it might invalidate the short setup.
4. Target Point: 93,159
This is the take-profit level for the short trade.
Represents a drop of approximately -10.76% from the entry point.
5. Trend Analysis:
The chart shows an uptrend leading into a potential distribution or topping pattern near the resistance zone.
A potential bearish move is anticipated, hence the short strategy.
6. Support Zones:
Highlighted in purple near the target area (around 93,159).
Historically strong buying areas.
Interpretation:
The trader expects the current resistance level to hold, prompting a downward correction toward the target zone at 93,159. If price moves above 104,807, the setup is invalidated, hence the stop-loss placement.

BITCOIN on similar spot as before the U.S. elections! 155k next?Bitcoin (BTCUSD) broke last week above the Lower Highs trend-line of its December 2024 High and so far on the current 1W candle, it's consolidating on it.
This is the exact same price action we saw on the October 21 2024 1W candle, which after breaking above that Lower Highs trend-line at the time, it spend 2 weeks consolidating on it before the November 05 U.S. election result started a relentless 7 week rally just below the 2.0 Fibonacci extension.
Note that on both fractals, the Lower Highs break-out and then re-test, took place on the 0.786 Fibonacci retracement level. If BTC manages to close above it at all times, we will have a strong case to expect again a Bullish extension as last December. The symmetrical level just below the 2.0 Fib ext in today's terms is $155000.
Do you think that will be next after a short-term consolidation? Feel free to let us know in the comments section below!
-------------------------------------------------------------------------------
** Please LIKE 👍, FOLLOW ✅, SHARE 🙌 and COMMENT ✍ if you enjoy this idea! Also share your ideas and charts in the comments section below! This is best way to keep it relevant, support us, keep the content here free and allow the idea to reach as many people as possible. **
-------------------------------------------------------------------------------
💸💸💸💸💸💸
👇 👇 👇 👇 👇 👇

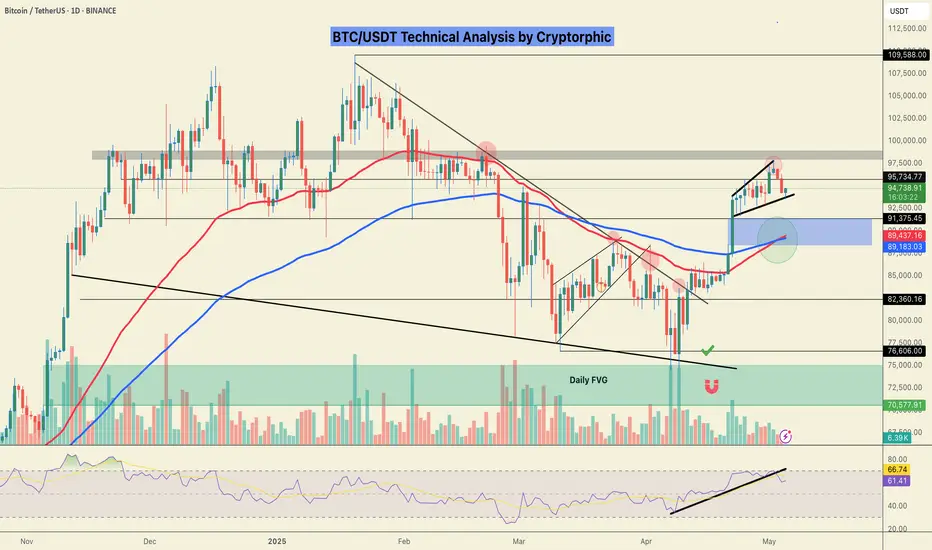
#BTC/USDT Bullish Crossover in Play!CRYPTOCAP:BTC Update: Bitcoin is currently holding support and showing signs of strength with a bullish EMA crossover — the 50 EMA crossing above the 100 EMA, which historically signals upward momentum based on past fractals.
The lower support zone is marked in blue, in case the price dips further.
Immediate resistance remains at the GETTEX:98K level — a confirmed close above this could trigger a move toward $103K.
Stay tuned for more real-time updates.
Do hit the like button if you like it, and share your views in the comments section.
Thank you