Bitcoin (BTC/USD) 2H Analysis: Potential Bullish Continuation or30 EMA (Red, 86,440): Indicates short-term momentum.
200 EMA (Blue, 85,153): Represents long-term trend support.
Support and Resistance Zones
Support Zone (Purple Box - ~86,271 to 85,153): Price is likely to bounce from here.
Resistance Zone (~87,149 and above): Breakout above this could push price higher.
Trade Setup
Entry Consideration: The price is currently testing a demand zone (purple) after a pullback.
Target (Take Profit - 90,118): Expecting a bullish move.
Stop Loss (~86,658 or lower): To manage risk.
Potential Price Action
If Bitcoin holds above the purple demand zone and 30 EMA, it could rally to 90,118.
A breakdown below 86,271 could push it toward 84,366 or lower.
Conclusion
Bullish Bias: If price holds above the support level.
Bearish Risk: If it breaks below the purple zone.
Recommendation: Monitor support at 86,271 and 85,153, as a bounce from these areas could confirm an uptrend.
Btcusdsignals

S&P500 This is the buy opportunity of the year for a 7000 TargetThe S&P500 index (SPX) is in the process of posting its 2nd straight green 1W candle, following a streak of 4 red weeks since the February 17 peak. That streaκ was technically the Bearish Leg of the 1.5-year Channel Up and as you can see, it made a direct contact with its bottom (Higher Lows trend-line).
As the same time, the 1W RSI almost touched the 40.00 Support that priced the October 23 2023 Low, which was the previous Higher Low of the Channel Up. The similarities don't stop there as both Bearish Legs had approximately a -10.97% decline, the strongest within that time-frame.
The Bullish Leg that followed that bottom initially peaked on a +28.85% rise, almost touching the 2.236 Fibonacci extension. Assuming the symmetry holds between the Bullish Legs as well, we can be expecting the index to start the new Bullish Leg now and target 7000 by the end of the year, which is marginally below both the 2.236 Fib ext and a potential +28.85% rise.
This may indeed be the best buy opportunity for 2025.
-------------------------------------------------------------------------------
** Please LIKE 👍, FOLLOW ✅, SHARE 🙌 and COMMENT ✍ if you enjoy this idea! Also share your ideas and charts in the comments section below! This is best way to keep it relevant, support us, keep the content here free and allow the idea to reach as many people as possible. **
-------------------------------------------------------------------------------
Disclosure: I am part of Trade Nation's Influencer program and receive a monthly fee for using their TradingView charts in my analysis.
💸💸💸💸💸💸
👇 👇 👇 👇 👇 👇

BTCUSD:Wait for a rebound before going shortThe fluctuations are not big now, judging from the structure of the 30M icon. The probability of rebounding and then falling later is relatively high. My trading idea is to wait for the rebound to go short. The short orders entered near 88K yesterday are now generally profitable. They can be closed first and then entered after the rebound to prevent the price from rising directly.
Losing profits is a trivial matter, but turning from profit to loss would be very uneconomical.

BITCOIN historically sees huge rally when Gold peaks. This time?Bitcoin (BTCUSD) is coming, slowly but surely, out of a consolidation following the test and hold of its 1W MA50 and one of the reasons it is about to rally strongly may be flying under the radar for the majority.
That reason has to do with Gold (XAUUSD) and its long-term Cycles. As you can see on this 1W chart, every time Gold peaked in the past 10 years, BTC started the parabolic rally of its Bull Cycle. Equally during Gold's past 2 Cycles, when it revisited that peak and tested that Resistance, it made a Double Top and declined again, which for Bitcoin was translated into a Bear Cycle confirmation.
With the help of the Sine Waves, we can be expecting that Gold Double Top in early April 2026, which means that by that time BTC will already be in its new Bear Cycle. As a result, it is suggested be already out of the market with our profits by the end of 2025.
So based on all that, if Gold makes its Cycle Top now, which is highly likely, Bitcoin will start a parabolic rally. Now, will it be the strongest of its Bull Cycle as the past Cycles suggested? Could be, but even if its not, it should be enough to replicate the late 2024 one and give one final opportunity for profit making.
But what do you think? Is Gold's potential peak here give a very favorable rally to Bitcoin? Feel free to let us know in the comments section below!
-------------------------------------------------------------------------------
** Please LIKE 👍, FOLLOW ✅, SHARE 🙌 and COMMENT ✍ if you enjoy this idea! Also share your ideas and charts in the comments section below! This is best way to keep it relevant, support us, keep the content here free and allow the idea to reach as many people as possible. **
-------------------------------------------------------------------------------
💸💸💸💸💸💸
👇 👇 👇 👇 👇 👇

BTCUSD LOOKING MORE BULLISH market take sell side liquidity now going for kill buy side liquidity .we have fvg in daily tf we will use confirmation in daily fvg

Whether BTC can reach 90KWhether BTC can reach 90K
Our strategy has made a profit and now BTC is testing the 88K resistance, let's see if we can break it today

BTC Today's strategyHi guys, it's a new week and the charts show it's moving up the channel
Looking back on the trading strategy we developed last week, we were undoubtedly successful. Now that the price has exceeded 87K, we still need to pay attention to the resistance of 88K, as it is the determinant of whether the upside can be
btcusdt buy@84.5K-85K
tp:87.5K-88K
We share various trading signals every day with over 90% accuracy.
Fans who follow us can get high rewards every day
If you want stable income, you can contact me.

BTCUSD: ShortToday's bulls have won a great victory. After completing the target of 86K, the targets near 87K and 88K have also been achieved. The current indicator forms a short position. It should fluctuate and fall near 88K, so the transaction can be mainly short.

BITCOIN just broke above 4H MA200 for the 1st time in 1.5 month!Bitcoin (BTCUSD) broke today above its 4H MA200 (orange trend-line) for the first time in more than 1.5 month (since February 04). This is on its own a major bullish signal but fortunately for buyers, it is not the only one.
Just yesterday, the price also broke above the February 21 Lower Highs trend-line, the first medium-term Resistance of the market that basically started the brutal sell-off of late February and breaking above it technically restores the bullish sentiment back to the market and at the same time formed a 4H MA50/100 Bullish Cross for the first time in more than 2 months (January 18).
Obviously the complete confirmation will come if BTC breaks above its Channel Down but given the fact that 2 Resistance levels already broke and that the bottom looks like a W-shaped recovery pattern, we can already set a Target on the 99500 Resistance, which just so happens to be marginally below the 2.0 Fibonacci extension.
But what do you think? Is this 4H MA200 break-out the bullish signal the market needed after such a long time? Feel free to let us know in the comments section below!
-------------------------------------------------------------------------------
** Please LIKE 👍, FOLLOW ✅, SHARE 🙌 and COMMENT ✍ if you enjoy this idea! Also share your ideas and charts in the comments section below! This is best way to keep it relevant, support us, keep the content here free and allow the idea to reach as many people as possible. **
-------------------------------------------------------------------------------
💸💸💸💸💸💸
👇 👇 👇 👇 👇 👇

3/24 BTCUSD Trading Signal: LongThis is a relatively healthy rebound. After breaking through the first resistance, it slowly rose to the second resistance, where it has been tested many times. The current shape is good and there is room for further rise.
Therefore, in the current transaction, it is recommended to take long as an important reference direction, and the target is near the resistance of 86K.
When the price rises to this point, the market is likely to confirm the validity of the area near the 85K support. If the support is confirmed to be valid, the price may rise to 86.8K-88K.

BTC Today's strategySo far, BTC has fluctuated around 84K today, and it still fluctuates within our marked range. The strategy of selling high and buying low still works.
Today's BTC trading strategy:
btcusdt buy@83K-83.5K
tp:84.5K-85.5K
There is no large-scale selling by long-term holders in the market. Short-term holders have a significant impact on short-term movements. At present, geopolitical conflicts continue, trade frictions continue, and bitcoin and gold have historically performed well in times of economic uncertainty
Our investment strategy has achieved significant returns in the past two weeks. If you also want to double your capital, you can click on my link to get my trading strategy

BTC/USD hourly trend using Market Timing AnalysisAccording to the analysis, the BTC/USD looks bearish. Trade with the stop loss.

BITCOIN Will this historic level break too?Bitcoin (BTCUSD) remains supported on its 1W MA50 (blue trend-line), which is its main Bull Cycle Support, despite the recent volatility. As mentioned numerous times, in periods of uncertainty it helps you maintain an objective long-term perspective if you zoom out and look on the wider time-frames.
On this 1W chart, we can see that so far all of BTC's Cycle's have followed the same pattern. The Bear Cycle bottoms and the first bounce of the Bull Cycle aims at breaking above the ATH Lower Highs trend-line (blue Arc). It is what we call the 'Growth Channel' that guides the market from its Cycle bottom to break above the ATH Lower Highs and when it does the Parabolic Rally Phase (green Rectangle) starts. The most aggressive part is when the price breaks also above its Growth Channel.
This is the only Resistance level that has yet to be broke on this Cycle. If it does, the market will explode to Targets above $200k that will start putting it to capitalization levels that would require earth shattering catalysts in terms of adoption. A continuation of expansion within the boarders of the Growth Channel however can easily target $150k. Notice that throughout the whole process of the Growth Channel expansion on all Cycles historically, the 1W MA50 (blue trend-line) tends to hold and support.
So what do you think will happen this time? Will Bitcoin break above the Growth Channel and offer us another proper Parabolic Rally or will it be a more standard rise within it? Feel free to let us know in the comments section below!
-------------------------------------------------------------------------------
** Please LIKE 👍, FOLLOW ✅, SHARE 🙌 and COMMENT ✍ if you enjoy this idea! Also share your ideas and charts in the comments section below! This is best way to keep it relevant, support us, keep the content here free and allow the idea to reach as many people as possible. **
-------------------------------------------------------------------------------
💸💸💸💸💸💸
👇 👇 👇 👇 👇 👇

BTC Today's strategyToday, BTC still fluctuates within our marked range, and the strategy of selling high and buying low still works
Today's BTC trading strategy:
btcusdt buy@83K-84K
tp:85K-86K
There are risks in trading. If you are not sure about the timing, it is best to leave me a message. This will better confirm the timing of the transaction, It can also better expand profits and reduce losses

BTC Today's strategyAt present, the support range continues to move upward and the fluctuations have exceeded the previous range. This is a new direction. We only need to make appropriate adjustments and trade within the range, selling high and buying low.
Today's BTC trading strategy:
btcusdt buy@83K-84K
tp:86K-87K
There are risks in trading. If you are not sure about the timing, it is best to leave me a message. This will better confirm the timing of the transaction, It can also better expand profits and reduce losses.

BITCOIN The Ultimate Cycle Model calls for $160k!Bitcoin (BTCUSD) is rebounding following yesterday's Fed Rate Decision. Technically the rebound has already started 10 days ago after the market nearly bottomed on the 1W MA50 (red trend-line). This is the strongest long-term Support level, as it is where BTC priced Lows and rebounded on August 05 2024 and September 11 2023, but it is not the only one.
With the current 2023 - 2025 Bull Cycle pattern being a Channel Up, this is the absolute and ultimate model that has been guiding the price action and can help estimate any future moves. Given that, it's also the 0.382 Fibonacci retracement level that supported both Lows (as well as the current one) on the 1W MA50 mentioned above. As a result, we are so far on a double Support cluster.
The 1W RSI comes in as the 3rd Support, as it hit and is rebounding now on its 2-year Support level, where the bounces of September 07 2024 and September 11 2023 happened. It is also important to mention that the Channel Up can be divided into two phases, Phase 1 (green Channel Up), which traded within the 0.0 - 1.0 Fibonacci range and Phase 2 (blue Channel Up), which trades within the 0.5 - 1.5 Fibonacci range.
The symmetry within those patterns are so high that the two Bullish Legs of Phase one have both rallied by +100.64%. If Phase 2 follows the same dynamic, and there is no reason to assume it won't as the Bearish Legs have been almost identical, we can assume that the Bullish Leg that has just started will rise by +121.48%, same as the previous one (Aug - Dec 2024). That gives us a Target estimate of $160000.
So do you think that BTC has bottomed on this Triple Support Cluster and if so, can it reach $160k by the end of this Cycle? Feel free to let us know in the comments section below!
-------------------------------------------------------------------------------
** Please LIKE 👍, FOLLOW ✅, SHARE 🙌 and COMMENT ✍ if you enjoy this idea! Also share your ideas and charts in the comments section below! This is best way to keep it relevant, support us, keep the content here free and allow the idea to reach as many people as possible. **
-------------------------------------------------------------------------------
💸💸💸💸💸💸
👇 👇 👇 👇 👇 👇

BITCOIN (BTCUSD): Bullish Reversal Confirmed?!
Bitcoin turned bullish after the yesterday's FOMC.
The price broke and closed above a significant daily resistance.
I see a confirmed bullish reversal pattern now:
a cup & handle with a broken horizontal neckline.
I think that the market will continue growing and reach at least 90500 level soon.
❤️Please, support my work with like, thank you!❤️

BTC Today's strategyToday, BTC trading is relatively stable and has been fluctuating in the 80K-85K range. We are still buying near support points and selling near resistance points. Once there is a new breakout range, we can simply adjust it
Today's BTC trading strategy:
btcusdt sell@85K-87K
tp:83K-81K

(BTC/USDT) Analysis: Supply Zone Rejection & Potential Drop to SSupply Zone (~85,296 - 84,835):
The price has reached a supply zone, which is acting as resistance. A rejection from this area could push BTC down.
Support Zone (~82,260 - 81,977):
This is a demand area where buyers might step in if the price declines.
Indicators:
EMA 30 (Red Line - 83,553.82): Short-term trend indicator.
EMA 200 (Blue Line - 83,743.52): Long-term trend indicator, currently above the price, indicating potential resistance.
Price Action & Prediction:
The price has touched the supply zone and is showing signs of rejection.
The blue projected path suggests a potential pullback followed by a drop toward the support zone (~82,260).
If price breaks below the support zone, further downside could be expected.
Potential Trade Idea:
Short Setup: If rejection at the supply zone continues, a short position could target the 82,260 support zone.
Long Setup: If price reaches the support zone and shows bullish reactions, a long position could aim for a rebound toward resistance.

BITCOIN The 2021 Pivot trend-line that is coming to its rescue.Bitcoin (BTCUSD) has stayed stable after last week's rebound on the 1W MA50 (blue trend-line), which has been the level that offered support on the Bull Cycle Channel's previous Higher Low (August 05 2024).
Technically however, that is not the only major Support level that may be coming to BTC's rescue as we've identified the Pivot trend-line that started on the April 12 2021 High as a Resistance and since then made another 2 contacts (as rejections). This is the first time now that is being tested as Support.
During the previous Cycle (2018 - 2021) a similar Pivot trend-line was the level that supported Bitcoin during the last year of its parabolic rally on January and June 2021. The June 2021 contact in particular tested the 1W MA50 as well, which is the exact situation we're in right now. That double support hold initiated the final rebound towards the Cycle's new All Time High (ATH).
Check also how similar the 1W CCI patterns between the two fractals are and based on that, a 1W CCI reading at 200.00 would be a solid level to sell and take profit. As a result, we expect this Cycle's Channel Up to accelerate the current rebound, technically its Bullish Leg and make a new ATH, which would be the Cycle's new Top, ideally with a CCI at 200.00.
So do you think this cyclical Pivot trend-line is coming along with the 1W MA50 to BTC's rescue? Feel free to let us know in the comments section below!
-------------------------------------------------------------------------------
** Please LIKE 👍, FOLLOW ✅, SHARE 🙌 and COMMENT ✍ if you enjoy this idea! Also share your ideas and charts in the comments section below! This is best way to keep it relevant, support us, keep the content here free and allow the idea to reach as many people as possible. **
-------------------------------------------------------------------------------
💸💸💸💸💸💸
👇 👇 👇 👇 👇 👇

BTCUSD SELL signal. Don't forget about stop-loss.
Write in the comments all your questions and instruments analysis of which you want to see.
Friends, push the like button, write a comment, and share with your mates - that would be the best THANK YOU.
P.S. I personally will open entry if the price will show it according to my strategy.
Always make your analysis before a trade

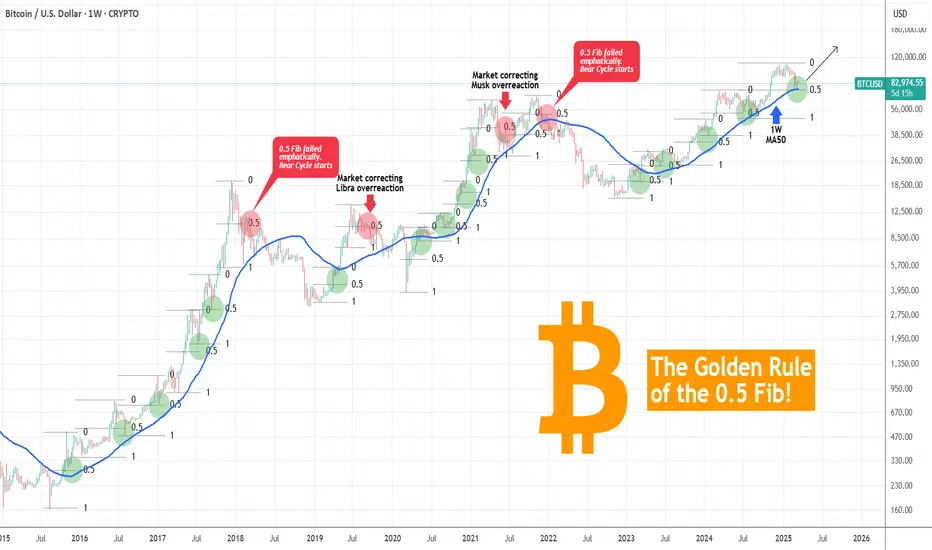
BITCOIN The 0.5 Fib Golden Rule! This is not a Bear Market yet!Bitcoin (BTCUSD) shook the bullish market sentiment last month, as late February saw it drop aggressively not just from the 109k All Time High (ATH) but also below the key psychological Support of $90000. We have discussed already how the 1W MA50 (blue trend-line) coming to its rescue, is the critical Support and rightfully so, but there is also another critical condition that is currently showing incredible strength, keeping BTC into Bull Cycle territory (for now).
That is the 0.5 Fibonacci retracement level Golden Rule. This suggests that BTC's corrections/ pull-backs up to the 0.5 Fib level are technical and perfectly systemic, especially with the 1W MA50 supporting. If anything, such pull-backs during a Bull Cycle are the most optimal buy opportunities. We are currently on an exact such opportunity as the price hit last week both the 1W MA50 and the 0.5 Fib.
In the past 10 years since the August 2015 Bear Cycle bottom, every correction up to the 0.5 Fib was a buy. In the 4 cases it broke, 2 were the signals of the 2018 and 2022 Bear Cycles and the other 2 signals of the market correcting the bullish overreaction to the Libra (2019) and Musk (2021) rallies. The latter though was still contained above the 1W MA50 and so would the 2019 one if it wasn't for the March 2020 COVID crash.
As a result, we still see no cause for concern (yet) and so far this is the best buy opportunity for Bitcoin since last year and the August 05 2024 Low.
But what do you think? Is this 0.5 Fib Golden Rule coming to push Bitcoin higher to its next ATH? Feel free to let us know in the comments section below!
-------------------------------------------------------------------------------
** Please LIKE 👍, FOLLOW ✅, SHARE 🙌 and COMMENT ✍ if you enjoy this idea! Also share your ideas and charts in the comments section below! This is best way to keep it relevant, support us, keep the content here free and allow the idea to reach as many people as possible. **
-------------------------------------------------------------------------------
💸💸💸💸💸💸
👇 👇 👇 👇 👇 👇