Bitcoin Weekly: Bullish & Bearish ScenariosThis is the definitive analysis based on the weekly timeframe. Depending on how the weekly session closes the market trend will be defined. Bitcoin is both bearish and bullish. Let me explain.
» If Bitcoin can move and close weekly above $110,000, market conditions are considered bullish and we can expect higher prices.
» If Bitcoin moves and closes weekly below $100,000, market conditions are considered bearish and we can expect lower prices.
» Any trading between $100,000 and $110,000 can be considered consolidation. Since the main move is an advance starting 7-April, the consolidation has a bullish bias; makes sense?
It is a bullish bias but a bullish continuation is not confirmed. Bitcoin peaked the 19-May week, a new all-time high. Then it produced a lower high this week. This implies bearish potential and bearish pressure.
» If this week closes above last weeks high, around $107,000, we can say the bulls are gaining ground.
» If this week closes at the open or lower, say $105,000 or lower, then the bears are gaining the upper-hand a lower low becomes more likely.
It has not been decided, anything goes. Anything can happen because Bitcoin will not die, trading won't end if prices move below 100K. This would simply lead to a bounce and a recovery later down the road.
It also works in reverse, if Bitcoin moves higher, nothing happens, the market will continue to be and exist, it will continue to grow and evolve.
Right now we are mixed, this is a decision point. The action is determined by the price, depending on what prices we get we can know what comes next. Since the week is yet to close, we remain in doubt but the bearish bias has the upper-hand short-term.
Short-term bearish potential is strong based on the ath, triple-top and lower high.
Mid-term the market is in a bullish trend facing resistance. The wave from 7-April through present day.
Retraces and corrections are normal.
Long-term Bitcoin is bullish, because it has been growing since November 2022.
Thank you for reading.
👉 If you would like to see an update when the week closes hit boost!
Namaste.
BTCUSDT

$BTC correction has just started. What is coming next?As I previously stated in my CRYPTOCAP:OTHERS , CRYPTOCAP:BTC.D , and CRYPTOCAP:TOTAL2 analysis — this move was expected. Check out my other ideas for more detailed breakdowns.
So, what’s happening?
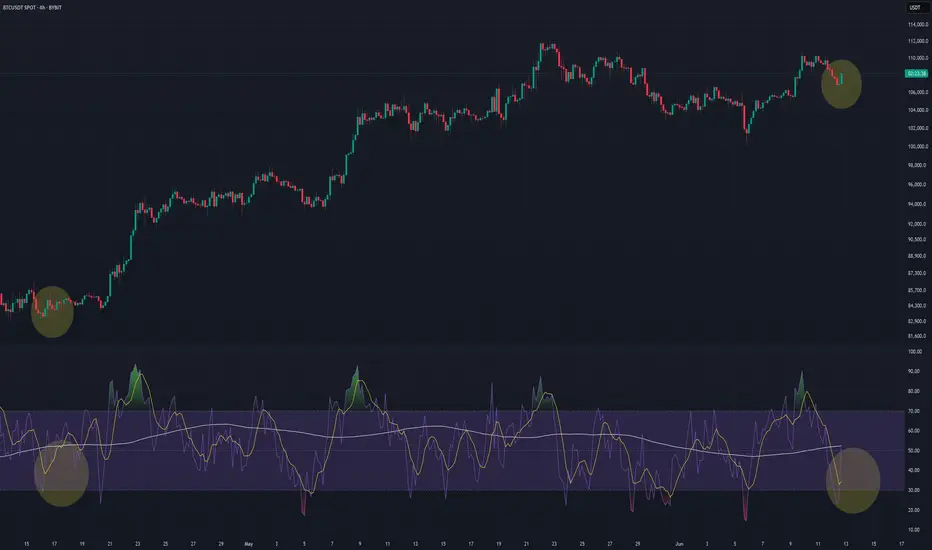
Bitcoin maximalists have been buying heavily at the top, right when RSI and MACD were in overbought territory, creating a clear bearish divergence.
Something Saylor and others seem to ignore: you can't defy mathematics — what needs a correction will correct.
CRYPTOCAP:BTC still looks bullish on the weekly timeframe, so we’re not entering a bear market. However, the pump is over, key supports have broken, and altcoins are correcting — some by -25% in a single day.
Purely from a charting perspective, we can identify multiple potential support levels for CRYPTOCAP:BTC :
$101K, $94K, $89K, $87K, with a lower-probability retest down to $75K.
We’re likely entering a 2-week correction, after which CRYPTOCAP:BTC could resume its uptrend — potentially closing June at a new all-time high.
DYOR.
#Bitcoin #BTC #Altcoins #CryptoCrash #TechnicalAnalysis #BTCdominance #TOTAL2 #BearishDivergence #Saylor #RSI #MACD #ATH #DYOR

Bitcoin (BTCUSDT) - Price Consolidating Inside Sym. Triangle - DBITCOIN (BTCUSDT) price has recently bounced up from above the 50EMA (yellow line).
Since May 2025, price has been consolidating sideways and has now formed a symmetrical triangle (blue lines). 10% to 20% volatility could be incoming for Bitcoin this summer.
The key resistance prices that Bitcoin has yet to breakout above are: $110000, $112000, $115000, and $120000+.
Support prices are holding at this time, such as $105000, $104000, $102000, and $100000, $95000.
If price holds above $100,000 to $105,000, there is still a chance that Bitcoin can continue to uptrend and rally higher this year in 2025.
However, if $100,000 price and support levels are lost, a new downtrend could occur and price could possibly test the 200EMA zone (red line).

Bitcoin At Resistance: OMG! Not Another 20X SHORT!Sell at resistance; buy at support.
Good morning my fellow Cryptocurrency trader, I hope you are having a wonderful day.
Being able to adapt to changing market conditions is one of the signs of being a great trader. Being able to spot changes on a chart is also indicative of someone that can produce great results in this and other markets. How are you feeling today?
It is no secret, we let everyone know; We sell when prices are high, we buy a lot when prices are low.
Bitcoin is now trading below its 20-Jan 2025 peak price. And it is also producing a lower high. Both bearish signals that are pointing to a lower low.
If the first drop settled around 100K, the second one should settle in the low 90s or right below 90K. It can go lower of course but we go step by step. I am not saying GO SHORT 20X again. This would only be possible for people who are smart, experienced traders and those that can take advantage of a changing situation without breaking their portfolio or long-term plans. Those can definitely SHORT this setup and profit short-term.
A trader trades, it is what he/she does. You sell when prices are high if a drop is incoming, you buy when prices are low if a rise is next.
This is a friendly reminder and it carries great entry prices and timing. Follow the chart.
Trading volume is super low as Bitcoin trades near resistance and this is one of the biggest exchanges in the world. Low volume at this point reveals a pattern of distribution, distribution means lower of course.
Both the MACD & RSI move on the bullish zone but trending lower, bearish at this point.
What will it be: Will Bitcoin move down next? Will Bitcoin move up?
My money is on down.
Leave a comment if you agree.
Thanks a lot for your continued support.
Namaste.

The FVG above isn’t the target. It’s the bait.This is a classic Smart Money sequence. Most are watching the imbalance at 106.5k–108.7k and expecting immediate delivery. But that’s not how this game works.
The setup:
Price broke down violently, then reversed with momentum — stopping right beneath the daily FVG block. That alone tells me it’s not ready. It’s gathering.
Below? Multiple fib levels that haven’t been tested — 104.4k (0.236), 102.6k (0.0), and a volume-backed rejection wick that still holds weight.
The market is likely to dip again — pull into deeper discount, reset the low timeframe narrative — and only then attack the FVG and upper sweep zones.
What I expect:
Sweep of 102.6k (final liquidity run)
Reaction → reclaim 104.4k
Push into the FVG toward 106.5k (0.5) and possibly 107.4k (0.618)
No emotional reaction to the red candles — this is structure playing out, not weakness unfolding.
Plan:
Ideal Entry: 102.8k–103.2k range
SL: Below 102.6k
TP1: 105.6k
TP2: 107.4k
Final: 108.7k clean inefficiency fill
Let it dip. Let it breathe. That’s where conviction is built.
Final thought:
“The real move starts when they convince you it’s done.”

HelenP. I Bitcoin may continue to decline to trend lineHi folks today I'm prepared for you Bitcoin analytics. The chart began with a steady rising movement near the trend line, where the price consistently respected upward support and showed healthy momentum. After each test of the trend line, BTC managed to rebound strongly, confirming this level as dynamic support. One of the key reactions came when the price bounced from the 100300 zone, forming a solid base and continuing its bullish leg toward the resistance area. However, buyers lost momentum after breaking through intermediate support levels and reaching the resistance zone between 110700 and 111700. This resistance zone acted as a ceiling, halting further upside and triggering a local reversal. Since then, the price has been gradually retreating, printing lower highs and showing early signs of weakness. Currently, BTCUSDT is retracing, and the structure suggests that the market is leaning toward another test of the trend line. Given the previous reactions and technical setup, I expect the price to pull back toward the 102500 points, which aligns closely with the trend line. That’s why my current goal is set at this zone. If you like my analytics you may support me with your like/comment ❤️

BTC will be 74k soon/i sell all my altcoins I found fractals that confirm my idea, let's call this pattern “dragon wings.” I think the price will fall to $74k at best, and from there I will consider buying.

btc weeklyCRYPTOCAP:BTC will literally unleash explosive power
pullbacks serve as a force for the next upswing

btc movement in 45minAfter the formation of strong bullish candles, in my opinion, an upward movement can be expected. The targets are shown on the chart.

BTC/USDT 4H Chart Update –BTC/USDT 4H Chart Update –
After a strong rejection from the $110K+ zone, Bitcoin is now retesting a critical trendline support on the 4-hour chart.
Key Highlights:
Price dropped sharply to $103K, almost tagging the key ascending support zone.
The previous breakout from the descending trendline is now being retested, which is a classic bullish retest pattern.
If bulls defend this region successfully, expect a potential bounce towards $108K–$ 114 K.
However, a clean breakdown below $102K would shift short-term momentum bearish.
Eyes on this zone. High-probability decision area.
Watch for reaction candles and volume spikes to confirm the next move.
Thanks for your support!
DYOR. NFA

BTCUSDTBTCUSDT price is now near the resistance zone 110259-112265. If the price cannot break through the 112265 level, it is expected that the price will drop. Consider selling the red zone.
🔥Trading futures, forex, CFDs and stocks carries a risk of loss.
Please consider carefully whether such trading is suitable for you.
>>GooD Luck 😊
❤️ Like and subscribe to never miss a new idea!
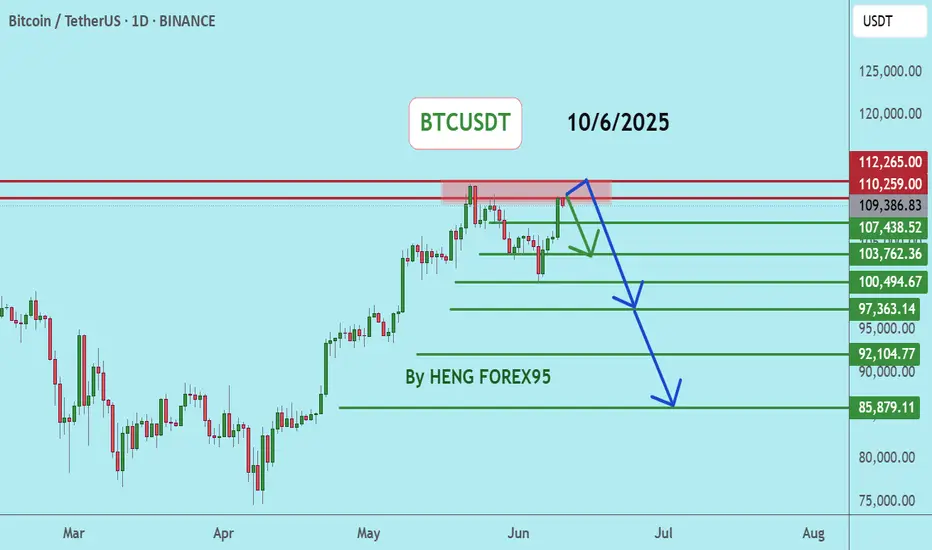
Bitcoin's Correction Confirmed, 93-97K Next TargetBitcoin's bearish continuation is now confirmed with three consecutive days of bearish action, today being a full red candle.
Good afternoon my fellow trader, how are you feeling today?
Opportunities are endless in this market, and if you trade, you can profit from the bullish as well as the bearish waves. Good entry timing is all that is needed for a successful trade, the right map and mindset.
So the lower high is confirmed and today's action confirms an incoming lower low. The 100K support is very likely to break but this is not written in stone. This is a high probability scenario. We are aiming for a price range of $97,000 - $93,000. But this isn't necessarily the end. Depending on how this level is handled, we will be able to know if prices will go lower or what.
$88,000 is a good level in the case there is strong bearish volume when the above price range is challenged as support. Now it is all a wait and see. Patience is key.
Once the a new support zone settles, we adapt to the market and focus on green. The next step is red. Down we go.
Thank you for reading.
Namaste.

BTC losing momentum but support needs to holdBTC is showing some bearish signs. However, as long as the price can stay above $101k, the bias is still up.
Full TA: Link in the BIO


BTC Triple JumpRSI Fired ✔ Breakout Above $110,200 Next ➜ Targeting 140K
BTC is entering a critical phase on the 4H chart, and this setup looks remarkably similar to previous moments that led to sharp bullish continuation. Price is steadily forming higher lows and now pressing right up against the key resistance at $110,200 — the last confirmed swing high. 🧱
What makes this moment particularly interesting is what’s happening beneath the price: momentum is quietly shifting. Using a custom triple RSI setup — with short, medium, and long lengths — I’m seeing a familiar pattern unfold. The white line (longer-term RSI) has already crossed above the 50 level ✅, a strong signal of building trend strength. Meanwhile, both the short and medium RSIs are deep in the oversold zone 🔻 — a dynamic that, in the past, has front-run explosive rallies.
This exact structure has preceded multiple breakout moves over the past months. The RSI alignment acts as an initiative confirmation, and now price is approaching the final confirmation level: a break and 4H close above $110,200. If that happens, I expect a swift push toward $112,500–$114,000, with potential for much more.
🔥 This aligns perfectly with my previous idea, where I laid out a case for a major breakout in June that could drive BTC toward $140K. That outlook was based on higher-timeframe expansion patterns and macro structure — and what we’re seeing now could be the moment where it all starts.
As of now, it’s too early to talk about invalidation. The structure remains intact. Momentum is shifting. All that’s left is the breakout.
If you haven’t seen my 140K projection yet, check it out — this could be the first real ignition point. 🚀
MANTA Holding Rising Support — Eyes on BreakoutMANTA is once again respecting the rising support line and showing early signs of holding the structure.
Price action remains constructive — despite recent volatility, buyers are still defending the trendline well. As long as this rising support continues to hold, the setup remains bullish.
The next key area to watch is the resistance zone above. A breakout through that level could open the door for a much larger move, as visualised in the projected path.
For now, MANTA is in a healthy consolidation phase along the trendline. If momentum builds from here, it could trigger the next leg higher.

ASRUSDT Forming Falling WedgeASRUSDT is gaining strong bullish traction after a successful breakout from a falling wedge pattern. This setup is widely recognized in technical analysis as a bullish reversal structure, and the breakout here is backed by consistent price action above the key resistance zone highlighted in red. ASR has now flipped this zone into support, and the trendline structure suggests a continuation move is underway.
The recent candles are forming a clear uptrend, and the momentum is being supported by healthy volume flow, indicating that accumulation might be happening behind the scenes. With the breakout fully confirmed, a potential 40% to 50% upside move is projected based on the measured target approach, aligning with price ranges between $2.5 and above. Traders should watch for continuation patterns or bull flags as the uptrend evolves.
The ASR token is part of a growing fan-token economy that has started to attract fresh attention in 2025. As investor interest increases, demand for utility-driven and fan-based tokens could fuel further upside. This positions ASR as a strong candidate for both speculative and long-term plays. If the broader altcoin market continues to move positively, ASR could outperform thanks to both technical strength and thematic interest.
With its current setup, ASRUSDT looks set to rally further and may present a compelling opportunity for traders who position early. Keep an eye on pullbacks to key support levels as potential re-entry zones if missed on the initial breakout.
✅ Show your support by hitting the like button and
✅ Leaving a comment below! (What is You opinion about this Coin)
Your feedback and engagement keep me inspired to share more insightful market analysis with you!

$BTC - Possible CME Gap FillBINANCE:BTCUSDT | 4h
Watching 106.2k-106k for a potential bounce taking those singleprints/imbalances.
However, if 108.3k rejects, CME gap below likely gets filled around 104k to 102k zone (pink squiggly)


BTC is reviving for a new bull runBTCUSD is correcting to 108000 as it hits the sell zone at 101200. At 108000 it is quite clear to set up BUY signals. Another area to watch for BUY is 106500. BUY SL points are not above 700 price for BTC. Currently the uptrend is still going to continue so any pullback to support is considered a buying opportunity.

EURUSD BULLISH OR BARISH DETAILED ANALYSISEURUSD is showing strong bullish momentum after a clean bounce from the key support zone around 1.12. Price structure confirms higher lows and strong bullish candle formations on the daily chart, suggesting the bulls are in control. This recent move is backed by a textbook retest and rejection from the previous resistance-turned-support zone, giving confidence in a potential continuation toward the 1.19 level. With the current price trading near 1.15 and pushing higher, the market is positioned for a strong bullish wave in the coming sessions.
From a fundamental perspective, the Euro has gained fresh support after the ECB’s decision last week to proceed with a measured and data-dependent rate cut cycle. While the ECB delivered its first cut, the tone was cautious and far less dovish than anticipated, which kept EUR strength intact. On the USD side, traders are pricing in a more dovish outlook for the Federal Reserve, especially with recent CPI and PPI data pointing toward cooling inflation. This divergence in policy outlook continues to favor EURUSD upside in the medium term.
Technical indicators are also confirming the bullish bias. The pair is riding an ascending trendline, and momentum indicators like RSI remain in bullish territory without yet being overbought. A daily close above the 1.1550 area strengthens the case for a continuation move. The price is aiming for the next major resistance around 1.1770–1.19, where bulls are likely to take profit or scale out. Until then, dips are likely to be bought aggressively, as long as the 1.12 support remains intact.
This setup presents a high-probability opportunity in a trending market backed by both fundamentals and technical confluence. As long as the bullish structure holds, I remain long-biased on EURUSD with eyes on the 1.19 zone as the next key level. With increasing market interest, low volatility on the downside, and strong trend-following signals, this pair is set for a continued rally.

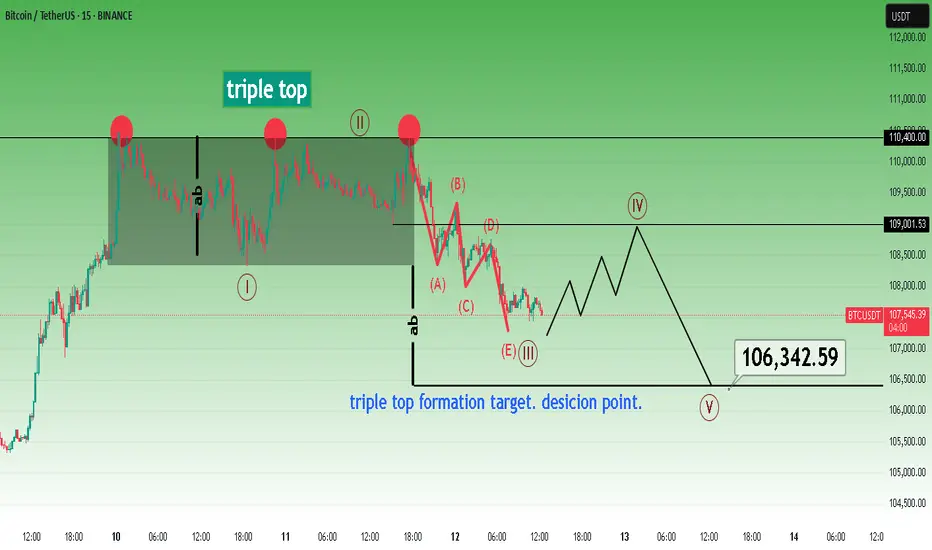
Bitcoin short term triple top pattern target.The most likely scenario in my opinion.
* The purpose of my graphic drawings is purely educational.
* What i write here is not an investment advice. Please do your own research before investing in any asset.
* Never take my personal opinions as investment advice, you may lose your money.