Bitcoin### Bitcoin Price Analysis (June 21, 2025)
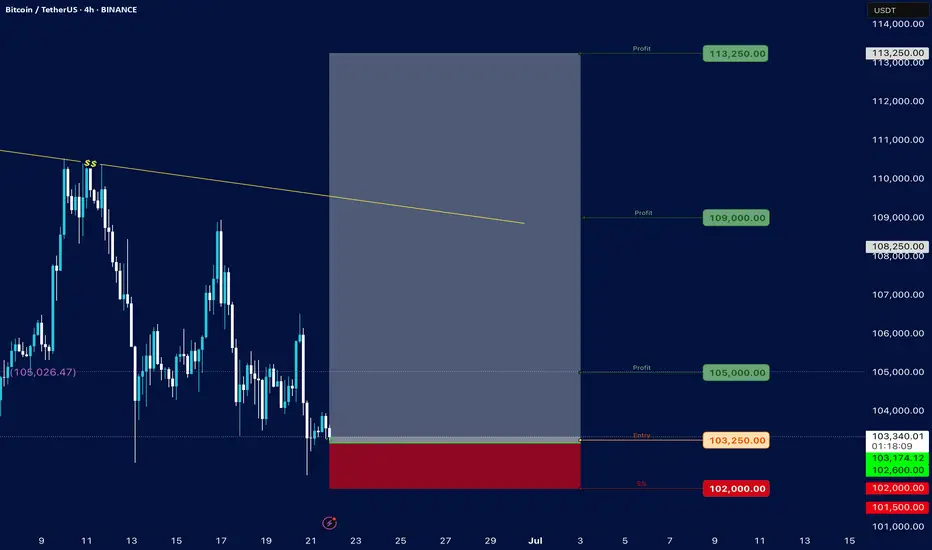
#### **Current Price**: $103,236.15 (as of the snapshot)
- The price is hovering near the lower end of the recent range, with key support at **$102,000** (marked as "S/s" on the chart).
- Resistance levels are visible at **$105,000**, **$107,000**, and **$110,000–$114,000**.
#### **Key Observations**:
1. **Support and Resistance**:
- **Strong Support**: $102,000 (critical level; break below could signal further downside).
- **Immediate Resistance**: $105,000 (previous entry point and psychological level).
- **Higher Targets**: $110,000–$114,000 (if bullish momentum returns).
2. **Price Action Context**:
- The price recently rejected the $105,250 level ("Entry") and is now testing lower support.
- The "Profit" markers at $105,000 and $105,026 suggest these were take-profit zones for traders.
3. **Trend and Sentiment**:
- The chart shows consolidation between $102,000–$110,000, with no clear breakout yet.
- A hold above $102,000 could lead to a retest of $105,000, while a break below may target $100,000 or lower.
4. **Volume and Timeframe**:
- The snapshot lacks volume data, but the date range (June–July) suggests a medium-term view.
- Key dates to watch: June 25–28 and early July for potential volatility.
#### **Conclusion**:
- **Bullish Case**: Hold above $102,000 and reclaim $105,000 to aim for $110,000+.
- **Bearish Risk**: Break below $102,000 could accelerate selling toward $100,000 or $99,000.
**Actionable Insight**: Watch the $102,000–$105,000 range for a breakout or breakdown. A rebound from support with volume could signal a buying opportunity, while a drop below $102,000 may indicate further downside.
*(Note: The analysis is based on limited data from the snapshot. For a full assessment, additional indicators like RSI, MACD, and volume would be needed.)*
BTCUSDT
BTC Consolidates 104000-105000: Bearish Breakdown Looming?BTC Technical Update: Bitcoin has been consolidating within the 104000-105000 range for an extended period, with the overall trend showing a downward bias. With the overall trend tilting bearish, traders should watch for a break below 103500 to confirm the next leg down. 📉
⚡️⚡️⚡️ BTCUSD ⚡️⚡️⚡️
🚀 Sell@ 105000 - 104500
🚀 TP 102500 - 101500
Accurate signals are updated every day 📈 If you encounter any problems during trading, these signals can serve as your reliable guide 🧭 Feel free to refer to them! I sincerely hope they'll be of great help to you 🌟 👇

$BTC - Protected LowBINANCE:BTCUSDT | 1D
Price got strongly rejected at 106.5k
It deviated below the 4-hour mini-range. We now need to see a reclaim of 105–105.1k. If not, a retest of the value area low at 101.4k is likely.
100k remains to be the protected low, and it would be critical if we won't get a valid retest at 101.4k
local resistance: 105-105.5k
local support: 101.4k
protected low: 100k

Solana:Daily free signalhello friends👋
As you can see, after the drop that we had, insider buyers showed and were able to support the price well.
But it was not enough, and as you can see, a noisy pattern has formed, which can indicate a further decrease in the price.
Now we can take advantage of this opportunity and make step-by-step purchases with risk and capital management in the support areas that we have obtained for you and move to the specified goals.
🔥Follow us for more signals🔥
*Trade safely with us*

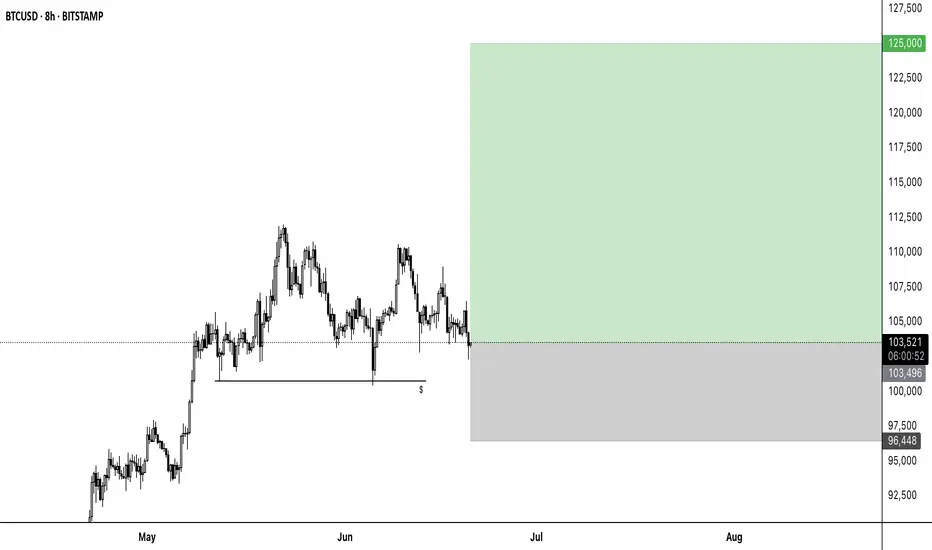
BTC to 125000📈 BTCUSD Long Setup – Maximum Fear Often Marks the Bottom
Timeframe: 8H
Entry: ~103,500
SL: 96,448
TP: 125,000
RR: ~3:1
🧠 Market Sentiment:
The current environment is dominated by extreme fear – sentiment is heavily bearish, and interest from retail investors is strikingly low. Most market participants appear to be short or sitting in hedged positions, which ironically sets the stage for a potential short squeeze if price breaks to the upside.
🔍 Technical Context:
BTC has been ranging for weeks – support has held repeatedly.
Liquidity has been swept below previous lows – possible spring formation.
A reclaim of the 104k–105k zone could act as a launchpad.
Setup anticipates a contrarian move against the prevailing bearish bias
BTC, will hibernate for a few weeks from here to sub 100k.BTC rise has been impressive the last few weeks with market triggering excitement after hitting a series of ATH and finally punching the elusive100k levels, and pushing it further to 110k as a bonus.
But like with any overheated parabolic move, a cool down will need to transpire eventually. And that season is ripe now for the king of coins.
From the diagram we are seeing some curve fitting price action, with horizontal ranging at the upper channel -- indicating a bull saturation scenario.
A corrective phase to 0.5 fib levels maybe expected in the next few weeks. It did the same behavior last time. This hibernation would be healthy in the long run - and it needed to happen.
Spotted at 104k.
Target sub 100k levels / or 0.5 fib at 94k.
TAYOR.
Trade safely.

#Bitcoin is approaching a strong demand zone!#Bitcoin is approaching a strong demand zone!
This level has acted as solid support several times in the past.
According to the Fibonacci levels, we’re currently at the 0.5 level, which makes this area even more significant.
In my opinion, we’re likely to see a bounce from here.
However, if the price fails to hold this level, there’s a good chance we’ll retest the $92K zone.
But for that to happen, we need a daily close below $100K.
Until then, we’re still in a safe zone.
I’ll keep you updated as things develop.
If you find my updates helpful, don’t forget to like and follow for more!
DYOR, NFA

FROM ATH TO ATH BTC FRACTAL use 3.14The graph is fractal and cyclical. I used the number pi to predict where the atx plus might be, taking into account the fractals for bitcoin from previous ideas and the idea for xrp, where the number pi worked perfectly.

btcusd two weeks trump time scale bearishTrump TACO time scale two weeks looks reasonable time scale
2W candle of #Bitcoin closing this weekend.
If CRYPTOCAP:BTC will not hold the 104000 - game over we visit margin call level of Saylor's Strategy 60 000 and most possibly lower 30 000

Become Rich Trading Bitcoin Strategy Simplified Correction NullIs this a shakeout or a rejection?
A rejection implies no bullish action short-term thus lower prices. It is still early on the current move.
A shakeout implies a bear-trap and bullish action soon to follow, as soon as the shakeout is complete.
Daily and weekly close
Let's be fair and honest, it is too early to say. To determine if the current move is either a rejection or a shakeout we have to wait for the close today.
Price action
Why are these two in question? Because the daily session moved higher today reaching $106,500 followed by lower prices. The low hit $102,309, lower than 13-June but higher than 5-June, a higher low. More information can be acquired once the trading session closes but, we can move ahead and see what the chart has to say based on other signals.
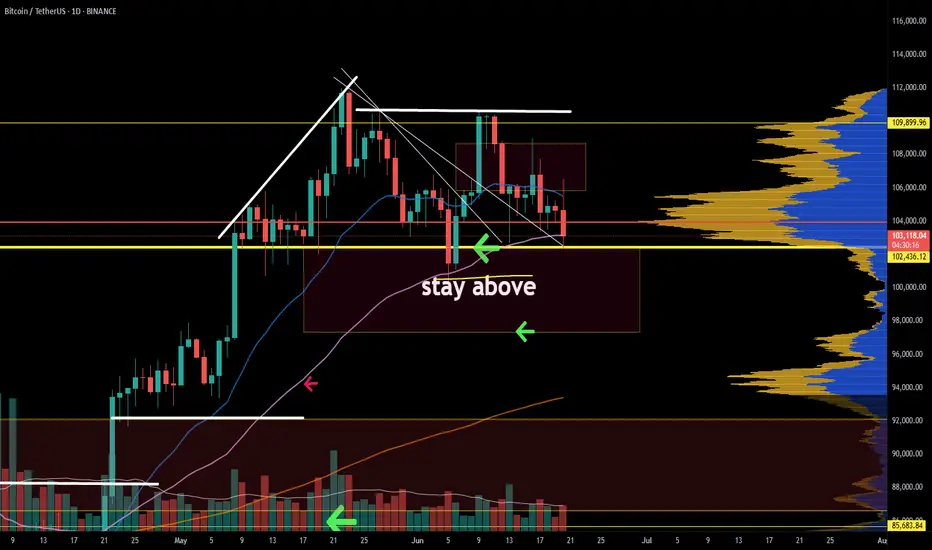
The volume is low on the bearish side, on all sides. The higher low so far is strong. As long as $102,000 holds Bitcoin is ultra-hyper bullish, very strong. Even if we are considering the short-term it doesn't matter, if the action is happening above this level the bulls are wining and that's what we have.
If the action is happening above $100,000 we already know what this means and this level is not in question right now. Being price oriented that is why I say is still early, do you agree?
So, more shakeouts, more sideways, more retrace—a non-event; short-term noise.
We are looking for the next major move, not the next $1,000 drop.
Market conditions do not change
Rest easy, Bitcoin will continue bullish even if it wicks below 100K. As long as it trades above this level, or the $100,000 to $102,000 price range, the action is safe (coming from the bulls).
If the week closes above this range but starts red next week and goes below, no need to panic because the week can start red just to recover and this would only be a continuation of the shakeout; we take information from the weekly close and not the intra-week action makes sense?
Questions —Leave a comment
So, what is your take?
Just let me know truly, what is your belief?
Do you think Bitcoin is bearish or bullish?
It can be looked at in many different ways.
The bull market
The trend is bullish, mid- to long-term. The action is happening above 100K.
The altcoins market is weak but we all know from the bottom we grow, we are entering the summer now... Ahhh, the beautiful summer, bring the heat. With the summer prices tend to grow.
You can call it a relief rally but that will be only the start. The relief will turn into a major bullish wave and this wave will transform into a major bull run.
Motivation
I love you again wishing you the best forever more.
You deserve the best now and always.
Keep at it and keep trying, persistence is the key. As long as we continue to trade, in the end we are sure to win.
Invest in Crypto, it is very easy.
Think of all the people that joined us (the market) 10 years ago. What are their holdings worth now? Millions upon millions... Now, think of yourself 10 years into the future. Put whatever money in you can afford and watch it grow.
The way to riches is not through frugality or savings, the way to riches is through buying and investing. This is the right market for us. It is fast, it is volatile, it is young; just like most of us. If not young of age, we are young at heart.
Namaste.

BTC has made the perfect market conditions for a trade. BTC setup is very clear. Why? Because the structure is clear. The current price is an inflection point; both bears and bulls are watching to make their next move. May the strongest of the two prevail. 95k or 110k?
Full TA: Link in the BIO
Current BTC Trend Analysis and Trading RecommendationsToday, U.S. markets are closed, leading to light trading activity and relatively limited overall market volatility. From a technical analysis perspective, the 4-hour K-line chart currently shows prices trading below the middle band of the Bollinger Bands, exhibiting a classic range-bound consolidation pattern. Bulls and bears are locked in a tug-of-war between key support and resistance levels, with K-line formations alternating between bullish and bearish patterns.
In terms of chart structure, the lower support zone has demonstrated strong buying conviction, while the upper resistance level has exerted clear restrictive force. Multiple failed upward breakouts have formed a short-term top. This box consolidation—characterized by resistance above and support below—is expected to sustain sideways trading through Friday.
Against the backdrop of no major positive catalysts, bearish momentum may gradually dominate if no substantial bullish triggers emerge. Maintain a trading strategy of selling into strength.
BTCUSD
105000-105500
tp:104000-103000
Investment itself is not the source of risk; it is only when investment behavior escapes rational control that risks lie in wait. In the trading process, always bear in mind that restraining impulsiveness is the primary criterion for success. I share trading signals daily, and all signals have been accurate without error for a full month. Regardless of your past profits or losses, with my assistance, you have the hope to achieve a breakthrough in your investment.

Evening BTC Market Analysis and Trading RecommendationsToday, U.S. markets are closed, leading to light trading activity and relatively limited overall market volatility. From a technical analysis perspective, the 4-hour K-line chart currently shows prices trading below the middle band of the Bollinger Bands, exhibiting a classic range-bound consolidation pattern. Bulls and bears are locked in a tug-of-war between key support and resistance levels, with K-line formations alternating between bullish and bearish patterns.
In terms of chart structure, the lower support zone has demonstrated strong buying conviction, while the upper resistance level has exerted clear restrictive force. Multiple failed upward breakouts have formed a short-term top. This box consolidation—characterized by resistance above and support below—is expected to sustain sideways trading through Friday.
Against the backdrop of no major positive catalysts, bearish momentum may gradually dominate if no substantial bullish triggers emerge. Maintain a trading strategy of selling into strength.
BTCUSDT
105000-105500
tp:104000-103000
Investment itself is not the source of risk; it is only when investment behavior escapes rational control that risks lie in wait. In the trading process, always bear in mind that restraining impulsiveness is the primary criterion for success. I share trading signals daily, and all signals have been accurate without error for a full month. Regardless of your past profits or losses, with my assistance, you have the hope to achieve a breakthrough in your investment.

HelenP. I Bitcoin can correct to trend line and start move upHi folks today I'm prepared for you Bitcoin analytics. In this chart, we can observe how the price developed a gradual upward trend, respecting the trend line as dynamic support multiple times. After each interaction with this line, the price showed a consistent pattern of rebounding and continuing its upward movement. Recently, the price faced a notable correction, which pushed it back toward this trend line once again, a critical zone that has proven its relevance as a support area. Upon touching the line, the market reacted with a bounce, signaling that buyers are still active and defending the structure. The price began to climb again, regaining some momentum, though it hasn’t yet managed to break the previous highs. Now BTCUSD is hovering near the ascending trend line, preparing for what could be another retest. If the trend holds, we may see a short-term decline toward this line, followed by a bullish rebound. I expect the price to push higher from this level, targeting the resistance zone near 108300, which also acted as a rejection area in the past. If you like my analytics you may support me with your like/comment ❤️
Disclaimer: As part of ThinkMarkets’ Influencer Program, I am sponsored to share and publish their charts in my analysis.

Everyone Talks Charts — But the Order Book Knows FirstHello, Traders! 🤓
Everyone watches the chart. But not everyone watches the market itself. If you’ve ever wondered why the price suddenly jumps or stalls just below resistance, you’re likely looking at the surface, not the structure underneath. And that’s precisely what DOM in trading helps to reveal.
What Is DOM Trading?
Let’s start with the basics. DOM stands for Depth of Market, which shows real-time limit buy and sell orders at different price levels. Some traders call this the trading DOM. Unlike a candlestick, which tells you what already happened, the DOM trading view shows what participants intend to do. This makes it useful for those trying to understand short-term moves, liquidity pressure, or even the psychology behind a specific level.
So if you’re asking, “What is DOM in trading?” or “How does DOM work in crypto?” – it’s essentially a live x-ray of the market’s limit order book.
Order Book Trading in Crypto
The order book, the live list of buy and sell orders, acts like a constantly updating roadmap of trader intentions. In order book trading, it’s not just the numbers that matter but how they shift. For example, traders often notice thick sell walls near round numbers (e.g., $70,000 BTC), sudden order pulls, which can fake out breakout traders, and absorption, where big buy/sell orders are filled silently, without noticeable price change… When analyzed properly, this behavior gives context to price action, something traditional indicators can’t always offer.
How to Use Crypto Trendlines… and Then Watch DOM
Drawing trendlines in crypto is common. Everyone has their version of a breakout setup.
But what happens when the price reaches that line? That’s where DOM trading shines.
It doesn’t predict whether the line will hold or break, but it shows whether liquidity is building or backing away right at the critical moment. The combination of crypto trendlines and DOM behavior often exposes subtle market dynamics, a large bid appearing just as price touches support, for instance, or offers vanishing before a breakout.
That’s not about strategy. It’s about market structure awareness, watching both the levels and the surrounding behavior.
Chart vs DOM: Two Sides of the Same Story
The crypto psychology chart tells you what’s happened — highs, lows, closes. The DOM, on the other hand, shows live trader psychology. And that’s where the psychology of crypto trading gets interesting.
When everyone’s waiting for BTC to hit $100K, for example, you might already see: Buyers are stacking bids at $95K, hoping for a retrace. Sellers layering offers at $99.9K, defending the level. And the sudden orders near $100K, a possible trap. In this way, round numbers in trading aren’t just emotional, they’re structurally significant. Especially in crypto, where the market cap is still heavily influenced by sentiment.
Final Thought
Some traders find it useful to spend a few sessions just observing the DOM. Psychological numbers in trading, like $10K, $20K, or even the famous 100K BTC milestone, are often surrounded by unusual order book behavior. So, the next time price seems to move “out of nowhere,” ask yourself: Was it really out of nowhere… or did the DOM in trading already whisper it?
You don’t need to trade based on it. But knowing how to draw trendlines in crypto and then pairing that with DOM behavior can offer a sharper view of where the market might hesitate, reverse, or run. Sometimes, seeing how others are placing their bets matters more than where. What do you think?

HYPER ANALYSIS🔮 #HYPER Analysis - Update 🚀🚀
💲 We can see that there is a formation of Falling Wedge Wedge Pattern in #HYPER and we can see a bullish movement after a good breakout. Before that we would see a little retest and and then a bullish movement.
💸Current Price -- $0.1087
📈Target Price -- $0.1358
⁉️ What to do?
- We have marked crucial levels in the chart . We can trade according to the chart and make some profits. 🚀💸
#HYPER #Cryptocurrency #Breakout #DYOR

TSLA JUNE 20 2025 READ NOTESThis is momentum based price targeting & Tesla can easily do $390 but before that 342 is a solid resistance. From there we can get a dip and then price can continue the up move further
ANY NEWS IS TO BE AVOIDED
Now price action which is way superior is clearly suggesting the same up move.
I fact RSI is saying $400++ can come but it would be super dafe to exit around $390
If you nave any doubts then you can leave a comment.

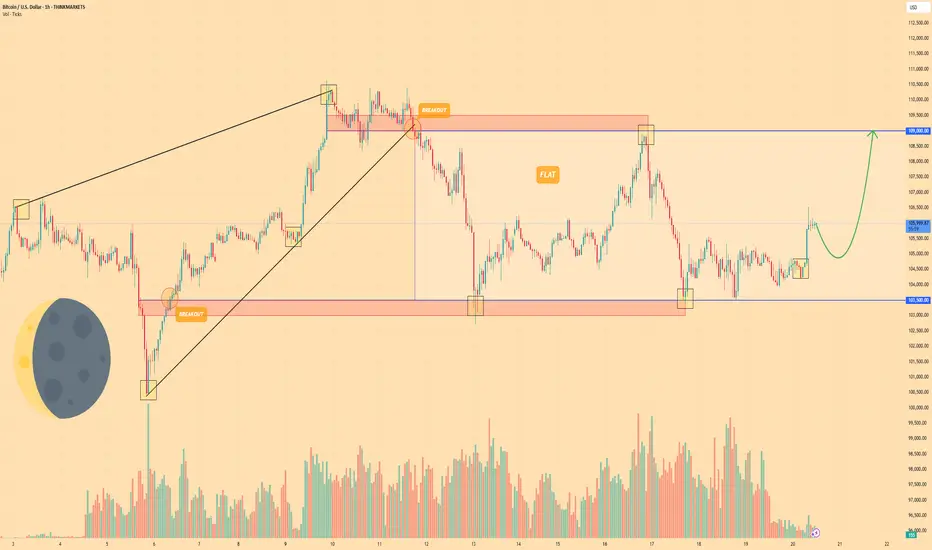
BITCOIN - Price can continue grow inside flat to $109000 levelHi guys, this is my overview for BTCUSD, feel free to check it and write your feedback in comments👊
A few days ago, the price entered a wedge, declining below the $103500 level and then making a strong impulse up.
Next, price broke $103500 level one more time and rose to resistance line of wedge, after which started to decline.
BTC broke $109000 level and started to trades inside a flat, where it declined to support level and then bounced up.
Price rose to resistance level, which is top part of flat, and then at once dropped back and started trading close.
But some time later, price bounced from this level and started to grow, and even now it continues to grow.
So, I think that BTC can make a small correction movement and then continue to grow to $109000 level.
If this post is useful to you, you can support me with like/boost and advice in comments❤️
Disclaimer: As part of ThinkMarkets’ Influencer Program, I am sponsored to share and publish their charts in my analysis.
Good moment for try to Buy BTCGood moment for try to Buy BTC. Very good down movement and now we make small step of the up. This point can be point for start to move new up trend with update local highest high. Stop to previous local low bar. Will see...

BTC will get doomed to 96k?NO not now, but you can see it ditto follows the movement as said earlier and shown. with little liquidity left on the top of it!

BTC bouncing of Support. BTC bouncing of the 1D diagonal support line at $104k but needs to flip $106k to continue the rally , don’t see it happening until July .

The Importance of the 104463.99 Point
Hello, traders.
Please "Follow" to get the latest information quickly.
Have a nice day today.
-------------------------------------
(BTCUSDT 1D chart)
This volatility period is around June 22nd (June 21-23rd).
Therefore, waves can be generated at any time during the volatility period.
The 104463.99 point is the DOM (60) indicator point of the 1W chart, which corresponds to the end of the high point of the 1W chart.
Therefore, it seems that the price defense is being done well.
I think that defending the price at the high point is significant because it raises expectations for further increase.
-
If it falls after a period of volatility, there is a possibility that it will meet the M-Signal indicator of the 1W chart, and I think the important point at that time is the 99705.62 point.
Therefore, when it falls, you need to check whether the M-Signal indicator of the 1W chart rises to around 99705.62 and whether it is supported.
-
Even if it rises after receiving support near 104463.99, the key is whether it can maintain the price by rising above 108316.90.
The 108316.90 point is the HA-High indicator point of the 1D chart, which corresponds to the middle value of the high point range.
Therefore, in order to continue the uptrend, it must be supported and rise in the 108316.90-111696.21 range.
Currently, both the Low Line and High Line of the auxiliary indicator OBV are showing a downward trend.
Therefore, in order for the uptrend to begin, OBV must rise above the High Line and be maintained.
If not, it is highly likely that it will fall due to selling pressure.
One hopeful(?) thing is that the PVT oscillator is showing an overall upward trend.
(Changed from OBV oscillator to PVT oscillator.)
Therefore, we can see how important the area around 104463.99 is playing a role of support and resistance.
-
In my chart, the basic trading strategy is to buy near the HA-Low indicator and sell near the HA-High indicator.
Therefore, it is virtually impossible to create a trading strategy at the current price level.
In such cases, you should conduct trading through day trading or quick response.
If not, you may experience a lot of psychological fear and anxiety.
The basic time frame chart of all indicators is the 1D chart.
Therefore, if you cannot read the flow of the 1D chart, you are likely to end up getting faked and suffer losses.
Therefore, you should read the flow of the 1D chart and create a big picture of how to create a trading strategy, and respond in detail on the time frame chart below the 1D chart.
-
Thank you for reading to the end.
I hope you have a successful trade.
--------------------------------------------------
- This is an explanation of the big picture.
(3-year bull market, 1-year bear market pattern)
I will explain more details when the bear market starts.
------------------------------------------------------

Bitcoin Short-Term 1H Timeframe, Next Target ConfirmedWe have two drops on this chart. The one of the left is more extended and long lasting compared to the one on the right. When a move is sudden with major force, it tends to end suddenly as well.
The recent drop was very steep and the force needed to keep pushing prices lower cannot be maintained, it requires too much energy; for this reason, a higher low is in place and the bulls win the game.
The action is happening above the blue line and space on the chart, this is the 0.618 Fib. retracement support. This is the most important level and so far it holds. Prices went below just to recover. Can be called a failed signal or a bear-trap, whichever you choose, the action is bullish above this level and bearish below.
Bitcoin's main support stands around $102,663, this level was not challenged. Since bears failed to push prices lower, the next logical move is a challenge of higher resistance. And the same pattern repeats, up and down, up and down... This is the short-term noise. When all is set and done, Bitcoin will resolve going up.
Patience is key.
Thank you for reading.
Thanks a lot for your continued support.
Namaste.
