AIN/USDT : IS THIS THE COIN THAT WILL DO IT?? MOON SHOTAfter analyzing this coin, we’ve identified signals suggesting a potential breakout in the near future. As a result, we will continue monitoring it closely for confirmation.
Once confirmation is established, further updates will be provided below.
follow up the $0,30, expecting as first target
BTCUSDT

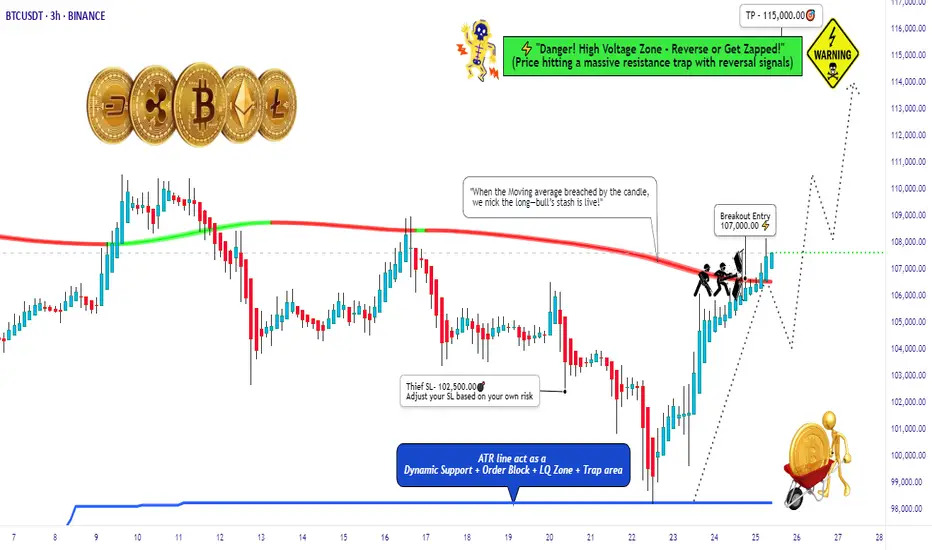
BTC/USD Thief Breakout at $107K – Eyeing $115K!🚨 Thief Entry Setup: BTC/USD Breakout Play 🚨
Overview:
Jump in after the $107 000 breakout—aiming for $115 000 with a tight “Thief SL” at $102 500. Adjust the stop‑loss to match your personal risk tolerance.
🧠 Setup Summary
Pair: BTC/USD
Entry trigger: Breakout above $107 000
Stop‑Loss: “Thief SL” at $102 500 (use your own risk‑based SL)
Target: $115 000
🎯 Why This Setup?
Clear breakout level at $107 000 = fresh momentum
Tight SL cushion (≈‑4.3%) = defined risk
Target ≈ +7.5% potential = strong reward-to-risk (~1.75:1)
📏 Risk Management Tips:
Only risk a small % of your capital—never exceed your comfort zone.
Move your SL to breakeven once mid‑target is hit to lock in profits.
Trailing your stop‑loss could secure bigger gains if BTC surges toward $115 000.
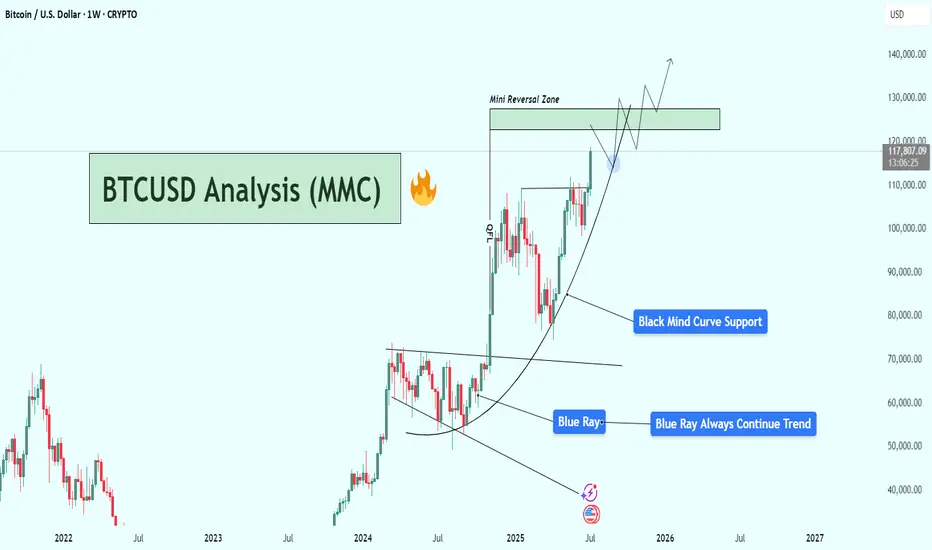
BTCUSD Weekly Analysis : Testing $130K Resistance + Next Target📌 1. Big Picture – Bitcoin is in a Parabolic Uptrend
This chart clearly shows that Bitcoin has shifted from a consolidation phase into a full-blown parabolic rally. That’s not just random growth — it’s an aggressive, momentum-driven market move that usually only happens during major bull cycles.
The curve shown in black — labeled “Black Mind Curve Support” — is your guide here. It's not a simple trendline. It shows how Bitcoin is accelerating upward, and this curve acts as a dynamic support. Every time price dips to it, buyers jump in fast — which shows strong bullish pressure and market confidence.
🔍 2. Blue Ray Broken = Trend Change Confirmed
Earlier, BTC was stuck under the Blue Ray, a long-term resistance trendline. As marked:
“Blue Ray Always Continue Trend”
That means, as long as price stays under it, the market is bearish. But guess what?
BTC broke above it — strongly.
That break confirmed a reversal in long-term structure, and it triggered this massive upward move. This breakout also aligned with a pattern of higher highs and higher lows, further confirming that bulls are now in full control.
🧠 3. Current Situation – Heading Into Mini Reversal Zone
Now BTC is trading around $117,820, and it's approaching the green box labeled Mini Reversal Zone — between $125,000 and $135,000.
Why is this area important?
It’s a psychological zone (big round numbers).
It lines up with historical resistance and previous supply zones.
It’s where smart money might take some profit, so we could see rejection or a short-term pullback here.
🎯 4. Two Scenarios to Watch
✅ Scenario A: Mini Pullback & Retest
BTC hits the Mini Reversal Zone → stalls → pulls back → retests the Black Mind Curve → bounces again.
That’s bullish and normal in a healthy uptrend. If you missed earlier entries, this pullback could be your golden opportunity.
🚀 Scenario B: Breakout of Reversal Zone
If Bitcoin breaks above $135K with strong momentum and closes the weekly candle high, we may see another parabolic rally toward $140K+.
This would mean even stronger buyer interest, possibly driven by FOMO, ETFs, or macro news.
📉 What Could Invalidate the Bullish Move?
Only if BTC:
Breaks below the Black Mind Curve, and
Starts closing weekly candles under $105K–$100K
That would mean the curve is broken, momentum is lost, and we might go into a consolidation or deeper correction.
But for now? No signs of weakness. Trend is strong, volume is rising, and price action is clean.
🧩 Summary of Key Levels
Type Level Notes
Curve Support Dynamic ($105K–$110K) Critical for trend continuation
Mini Reversal Zone $125K – $135K Watch for rejection or breakout
Bullish Target $140K+ If breakout holds above reversal zone
Trend Indicator Black Mind Curve As long as price rides this, bulls are in control
📌 Final Thoughts
This BTC chart isn’t just a random uptrend — it’s a well-structured parabola, powered by strong technical support and clean breakouts. Everything is lining up for a potential monster move, but don’t chase price blindly.
Watch the Mini Reversal Zone closely. If we see rejection, be ready to buy the dip. If we break through with volume — it’s 🚀 time again.
BTC BUY / LONG SCALP TRADEWait for the entry to be filled, must use SL and don't use high margin on any trade. If TPs achieved first then ignore the trade.

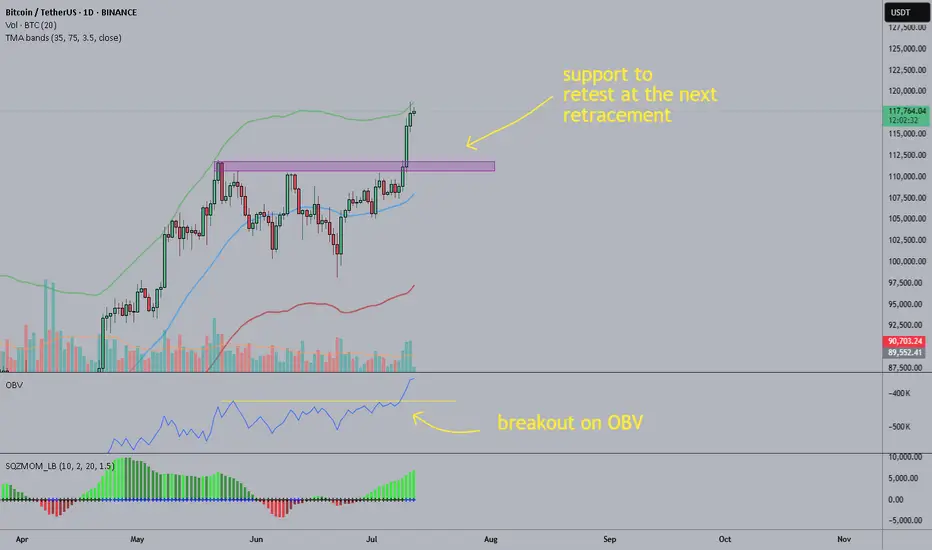
BTC: the breakout should be legitAs you can see the breakout had 3 days of rising volume and OBV also broke out so it should bne legit. On daily the upper band of the TMA bands is being tested, probably soon we'll see a retracement, I suppose the former resistance is now the support to test, however if the euphory continues we could see another peak of the price while RSI stays below the "overbought zone".
I'd look at opportunities to short although I usually don't trade BTC, I use it mostly as indicator on when to buy alts.
Good luck
btcusd bull bear when monthly crossing DMAEvery time monthly closes below DMA 200 (Daily moving average) it could be start of bear market but it came out last times there were more fake (lila arrows).
But when it croses DMA 400 then it goes into multi month sell off to DMA 1400
Currently it is close to top and start of next 400 day sell off.
Bull market lasts 1000 days

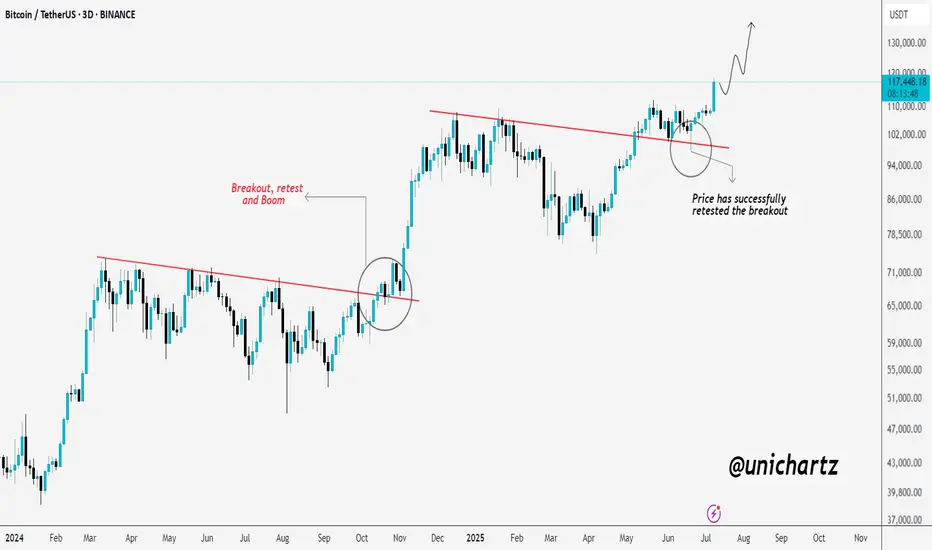
Bitcoin Looks Ready for LiftoffBitcoin is showing a textbook bullish continuation.
After breaking out of a long-term downtrend line, CRYPTOCAP:BTC came back for a clean retest — just like it did during the last breakout phase. That previous breakout led to a massive rally, and now we're seeing a very similar setup again.
The retest around $94K held perfectly, confirming strong demand and validating the breakout. Since then, price has pushed higher with momentum, now trading above $117K.
If this pattern continues to play out like before, Bitcoin could be eyeing $130K and beyond in the coming weeks.
The structure is strong, the trend is intact, and bulls are clearly in control.
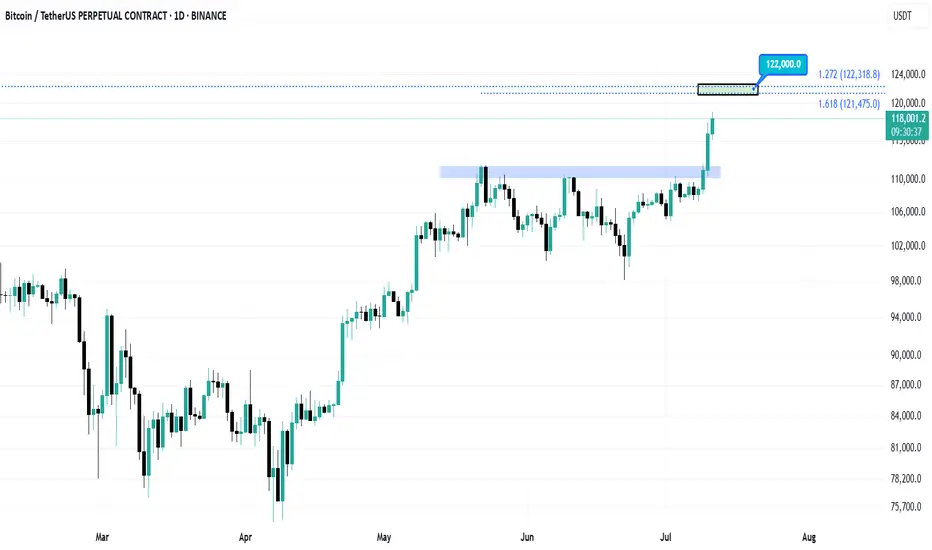
BitcoinThe next target for Bitcoin is $122,000.
I will update the chart when this target is reached.
Follow so you don't miss the next analysis.
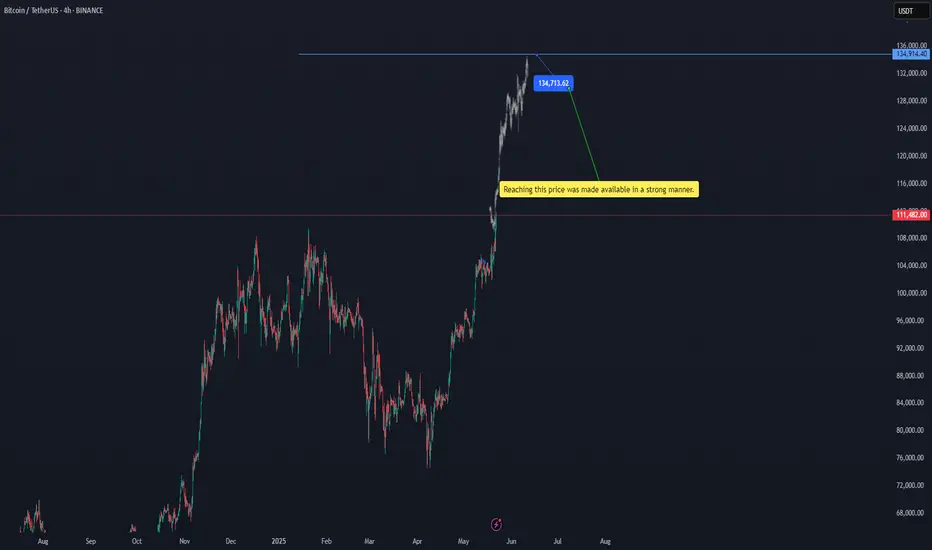
btcusdtReaching this price was made available in a strong manner. 134713.16$ BINANCE:BTCUSDT
Of course, there is a possibility of a temporary correction at the current price, but the target is $134,713.
#btc
Bitcoin Hits New ATH – Is It Time to Short?Bitcoin ( BINANCE:BTCUSDT ) managed to form a new All-Time High(ATH) in the previous one-hour candles .
Do you think Bitcoin can create a new ATH in the coming hours?
Bitcoin is currently trying to break the Heavy Resistance zone($110,720-$105,820) . It has also penetrated the Potential Reversal Zone(PRZ) and Cumulative Short Liquidation Leverage($114,910-$113,850) .
In terms of Elliott wave theory , it seems that the 5 impulsive waves that Bitcoin started in the last 3 days can be completed above the ascending channel and PRZ .
Also, we can see the Regular Divergence(RD-) between Consecutive Peaks.
I expect Bitcoin to drop to at least Cumulative Long Liquidation Leverage($111,563-$110,947) . At least the price zone Bitcoin is in at the time of publishing this analysis is better for short positions , even if the Stop Loss(SL) is touched .
Note: Stop Loss(SL)= $115,023
Please respect each other's ideas and express them politely if you agree or disagree.
Bitcoin Analyze (BTCUSDT), 1-hour time frame.
Be sure to follow the updated ideas.
Do not forget to put a Stop loss for your positions (For every position you want to open).
Please follow your strategy and updates; this is just my Idea, and I will gladly see your ideas in this post.
Please do not forget the ✅' like '✅ button 🙏😊 & Share it with your friends; thanks, and Trade safe.

Do you agree with a big profit in US30?
Hello friend
Do you think the orange line will break?
What if it breaks?
Just wait and collect the money.
If you liked my analysis, please support me by liking, commenting and subscribing. Thanks friend

Do you agree with me for XAGUSD?
Hi my friends
Do you think silver is still bullish?
I think it is bullish for now. Shall we go buy together?

BYCUSDTHello Traders! 👋
What are your thoughts on Bitcoin?
Bitcoin has broken above its descending trendline and formed a new higher high. The price is now in a consolidation phase, taking a short pause after the breakout.
We expect the bullish trend to remain intact. After a pullback to the broken trendline and some consolidation in the support zone, Bitcoin is likely to resume its upward move toward higher levels and new all-time highs.
The overall market structure remains bullish, and this consolidation phase could present a buy-the-dip opportunity.
Is Bitcoin ready for the next leg higher, or will the pullback go deeper? Share your view below! 🤔👇
Don’t forget to like and share your thoughts in the comments! ❤️

Do you agree with a big profit in EURGBP?Hi my dears
The pattern seems to be broken, so let's go up.
Join me with a guaranteed profit.
If you liked my analysis, please support my page.

bitcoin targets in 1h timeframeBased on the price structure created and the price trend, I have identified a possible target for Bitcoin. Let's see what happens.

BITCOIN's PUMPs are Getting LARGER this Bull Market...However, it may take a bit longer to realize those expansionary moves.
If Bitcoin adheres to the established cycle pattern, we can anticipate a minimum surge of 103% that should carry us into the fourth quarter of this year.
Consolidation ----> Fake breakdown ----> then expansion.
Are you ready?

Skeptic | Bitcoin Deep Dive: Rate Hikes, War Tensions & TriggersInterest Rates: The Big Picture
Let’s start with the Federal Reserve’s move—interest rates jumped from 4.25% to 4.5% . What’s the deal? Higher rates mean costlier borrowing , so businesses and folks pull back on loans. This drains liquidity from risk assets like Bitcoin and SPX 500, slowing their uptrend momentum or pushing them into ranges or dips. Now, mix in the Israel-Iran conflict escalating ? Straight talk: risks are sky-high , so don’t bank on wild rallies anytime soon. My take? BTC’s likely to range between 97,000 and 111,000 for a few months until geopolitical risks cool (like Russia-Ukraine became “normal” for markets) and the Fed starts cutting rates. Those two could ignite new highs and a robust uptrend. Let’s hit the charts for the technicals! 📊
Technical Analysis
Daily Timeframe: Setting the Stage
You might ask, “If 100,000 support breaks, does that mean we’ve formed a lower high and lower low, flipping the trend bearish per Dow Theory?” Absolutely not! Here’s why: our primary uptrend lives on the weekly timeframe, not daily. The daily is just a secondary trend. If 100K cracks, it only turns the secondary trend bearish, leading to a deeper correction, but the major weekly uptrend stays intact.
Spot Strategy: No spot buys for now. Economic and geopolitical risks are too intense. I’ll jump in once things stabilize. 😎
Key Insight: A 100K break isn’t a death sentence for the bull run—it’s just a shakeout. Stay calm!
4-Hour Timeframe: Long & Short Triggers
Zooming into the 4-hour chart, here’s where we hunt for long and short triggers:
Long Trigger: Break above 110,513.92. We need a strong reaction at this level—price could hit it early or late, so stay patient for confirmation.
Short Trigger: Break below 101,421.65. Same vibe—watch for a clean reaction to tweak the trigger for optimal entry.
Pro Tip: These levels are based on past key zones, but time outweighs price. Wait for a reaction to nail the best entry. Patience is your edge! 🙌
Bitcoin Dominance (BTC.D): Altcoin Watch
As BTC dips, BTC.D (Bitcoin’s market share) is climbing, meaning altcoins are taking a bigger beating. Don’t touch altcoin buys until the BTC.D upward trendline breaks. They haven’t moved yet—you might miss the first 10-100%, but with confirmation, we’ll catch the 1,000-5,000% waves together. 😏
Shorting? If you’re shorting, altcoins are juicier than BTC—sharper, cleaner drops with more confidence. Patience, patience, patience—it’s the name of the game.
Final Thoughts
My quieter updates lately? Blame the geopolitical chaos, not me slacking . I’m hustling to keep you in the loop with clear, actionable insights. here, we live by No FOMO, no hype, just reason. Protect your capital—max 1% risk per trade, no exceptions. Want a risk management guide to level up? Drop a comment! If this analysis lit a spark, hit that boost—it keeps me going! 😊 Got a pair or setup you want next? Let me know in the comments. Stay sharp, fam! ✌️

Bitcoin : Missed $100K? Don’t Miss What’s Coming Next!!MARKETSCOM:BITCOIN BINANCE:BTCUSDT continues to show exceptional strength and strong bullish momentum. When we look back at the charts from 2023 and 2024, a clear and reliable pattern stands out. Each time Bitcoin touched the 50 EMA on the weekly chart, it triggered a significant rally that led to new all-time highs. That same setup appears to be forming once again.
MARKETSCOM:BITCOIN tested the 50-week EMA around the $75,000 level and has since bounced with conviction. The price has reclaimed the $100,000 mark and is now challenging previous all-time high resistance. Historically, a successful bounce from this key moving average has not only signaled recovery but also sparked explosive upside moves.
Following this repeating pattern, the current cycle target is positioned at $150,000. A clean breakout above the current resistance zone could act as the trigger that launches Bitcoin into uncharted territory. The technical structure remains bullish, momentum is clearly accelerating, and the overall trend continues to favor the upside.
This moment represents a textbook Buy and HODL opportunity. Technical indicators are aligning, market sentiment is turning increasingly optimistic, and all signs suggest that Bitcoin could be preparing for another historic rally. Stay ready for what could be the next big move.
Follow Our Tradingview Account for More Technical Analysis Updates, | Like, Share and Comment Your thoughts

BTCUSDTBitcoin may be looking to complete the downward correction from the $101,000 price range to $99,000 and then begin a long-term upward trend. Pay close attention to the extent of the correction and don't give in to fear or greed.
In any case, it should go to $1300,000.
BINANCE:BTCUSDT

Can Bitcoin see $120,000?
Hi My Dears
If the Bitcoin price closes above $106,602, we can be optimistic about the specified targets.
I think Bitcoin has the potential to reach $120,000. We just have to wait.

Is the currency GBPAUD depreciating?
Hi dears
I think that if the colored trend line is broken, the downtrend will probably continue until it reaches the target.
Thank you for supporting me by liking, commenting, and subscribing.

109K Launch Zone? Bitcoin Update Now LiveHey everyone,
Here's my latest Bitcoin analysis for you. The current price action is unfolding within an ABC corrective wave.
🔍 I've identified the optimal buy zone between 108,349 and 109,682.
📉 Once the price pulls back into this range, my limit orders will be triggered and the position will open.
🎯 In this scenario, my target level is 118,157.
Below are the exact levels for my entry, targets, and stop-loss:
- 🟩 Entry Level: 109,027
- 🟥 Stop-Loss: 105,876
- 🎯 TP1: 111,156
- 🎯 TP2: 113,607
- 🎯 TP3: 118,362
- ⚖️ Risk/Reward Ratio: 3.00
(This is based on a swing trade model, so reaching this level may take some time)
--------
Your likes and support are what keep me motivated to share these analyses consistently.
Huge thanks to everyone who shows love and appreciation! 🙏

BTC - Can it reach 100k?FOR SUREEEEE it can! Just let it close above 120k for it to form in a formed manner or way
