Will it break the all-time high again?
Over the past week, the Bitcoin market has seen volatile trends, attracting widespread attention. In terms of price performance, Bitcoin carried forward the upward momentum from the previous week, opening at $103,500 and continuing its upward trend. On May 22nd, Bitcoin reached a high point, breaking through the $110,000 mark and hitting a record high of $112,000. Its market capitalization also surged to over $2.15 trillion, ranking among the top five global asset market capitalizations.
In terms of market capital flows, Bitcoin ETF products saw a total net outflow of up to $616 million on May 30th, with IBIT alone experiencing an outflow of $431 million, ending a consecutive 10-day net inflow trend. However, BlackRock's iShares Bitcoin ETF recorded a total net inflow of over $6.35 billion in May, with assets under management exceeding $71 billion, indicating that institutional investors maintain a long-term optimistic view of Bitcoin, and the short-term outflows are mostly profit-taking.
Humans need to breathe, and perfect trading is like breathing—maintaining flexibility without needing to trade every market swing. The secret to profitable trading lies in implementing simple rules: repeating simple tasks consistently and enforcing them strictly over the long term.
BTCUSDT
BTC (Daily) Elliot Wave 2 UnderwayBTC appears to have completed a motif wave (1) poking above all time high after printing a triangle for wave 4. Triangles are an ending pattern with a final thrust up afterwards typically breaking all time highs before reversing in wave 2, selling into retail FOMO.
Wave 2 has a $92k target at 0.5 Fibonacci retracement and high volume support node.
Wave 3 should be a powerful move up taking price way into all time high.
Safe trading

Daily BTC/USD Analysis - Smart Money PerspectivePrice recently swept liquidity above the previous weekly high, indicating a classic liquidity grab. After this move, we observed a market structure shift (MSS) to the downside, followed by a break and a mitigation of a bearish imbalance (BAG).
Currently, price is reacting from a small fair value gap (FVG), but this is likely just a retracement. I'm expecting the market to drop further and target the larger FVG zone that aligns on both the weekly and daily timeframes (highlighted in blue). This zone also aligns with a potential POI (point of interest) for smart money accumulation.
📌 Short-term bias: Bearish
🎯 Target: 99,000–97,000 zone
🔍 Watch for rejection at current FVG or possible internal liquidity grab before the drop.
Smart money is likely to seek deeper liquidity before any meaningful bullish continuation. Stay patient and let price come to the premium zone.

$BONK Breakout ConfirmedSEED_DONKEYDAN_MARKET_CAP:BONK Breakout Confirmed
The $1000BONKUSDT 1D chart shows a breakout from a long-term downtrend followed by a successful retest of the key support zone around $0.016390.
This area, previously resistant, is now acting as strong support.
If it holds, BONK could rally up to $0.040830, a potential 150% upside.
Invalidation occurs on a clean break below the support zone. Structure remains bullish for now.
DYRO, NFA

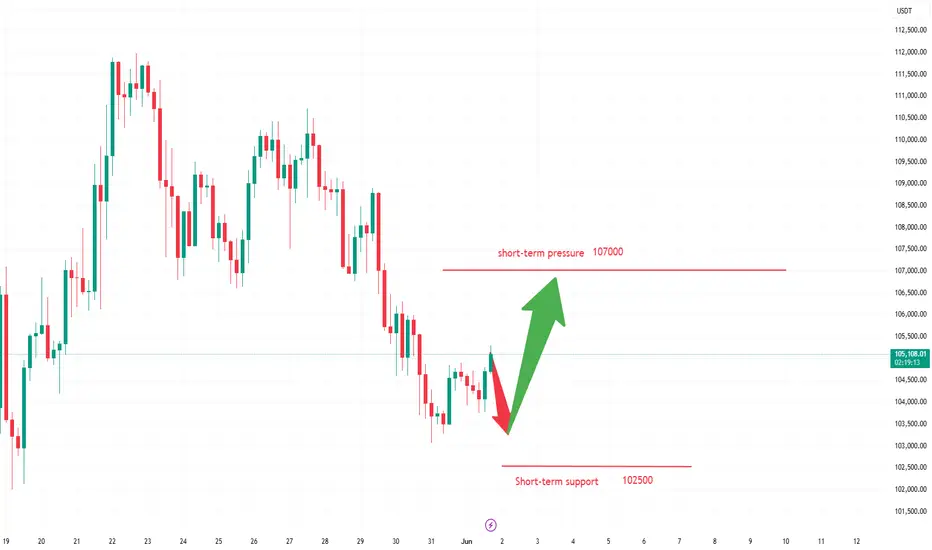
BTC - Mega Scalps to Victory! - Buy from 103.4KMega scalps means mega money hahhaha but i feel this is the ideal scenario to short first buy second or buy on the point stated!!! Although if it breaks the green box its invalidated!

Bitcoin Mixed: Below Resistance, Above Support (Altcoins Update)I hope you are having a good Saturday and weekend my dear friend, I have a quick update on Bitcoin and the Altcoins market today. Good news and bad news.
Let's start with the good news.
The Altcoins are producing a higher low and bullish. This means that we will continue to see growth as expected. The market went through a shakeout, nothing more.
On the Bitcoin side, we have the bad news which is not that bad.
The action is happening above support (grey dashed line on the chart) but below local resistance. The market just went through a major shakeout. I shall explain.
People got greedy and ended up putting too much leverage on their positions, when this happens, the market needs to balance things out because it cannot grow in this way long-term. And thus the shakeout. 1 billion dollars worth of LONGs were liquidated.
The good news is that once this process is over, the market can resume with its usual cycle but...
The situation is tricky now but I can tell you exactly what will happen. Bitcoin will consolidate before additional growth. While Bitcoin consolidates, the Altcoins will move up. Plan and simple.
What happens next with Bitcoin, down or up?
As long as Bitcoin trades above $100,000-$102,000 weekly/monthly the chart and market bias is considered ultra-bullish . This means that Bitcoin is ultra-bullish right now.
If the action moves and closes weekly below 100K, nothing happens. A simple retrace that ends in a higher low followed by additional growth.
The market is bullish now and will continue bullish.
The Altcoins are a good buy and this recent flush gives an opportunity for those that missed early prices.
Market conditions remain the same. We are bullish and set to grow long-term.
We are 100% bullish on Bitcoin and the Altcoins market.
Namaste.

BITCOIN STILL BULLISH ABOVE 97K$HELLO TRADERS
As i can see Bitcion is just created a new ATH 112K$ and now is retracing to downside after a overbought condtions on RSI i am expected a new ATH till design levels if BTC Hold above 97K zone its just a trade idea share your thoughts with us in comments it help many other traders we love ur comments and support Stay Tuned for more updates

Check support: Fibonacci ratio 1.902(101978.54) ~ 2(106178.85)
Hello, traders.
If you "Follow", you can always get the latest information quickly.
Have a nice day today.
-------------------------------------
(BTCUSDT 1M chart)
A new month begins.
The OBV indicator is currently rising again near the High Line.
We need to see if it can continue to rise by breaking above the High Line.
If not, there is a possibility of a decline near the Fibonacci ratio of 1.902 (101978.54) ~ 2 (106178.85).
If it declines with strong trading volume, there is a possibility of a decline near the StochRSI 20 point of 97209.25.
Therefore, we need to respond depending on whether there is support in the Fibonacci ratio of 1.902 (101978.54) ~ 2 (106178.85).
The most important support and resistance area on the current 1M chart is 69000-73499.86.
-
(1D chart)
It is showing a downward trend below the M-Signal indicator of the 1D chart.
Accordingly, the possibility of a short-term downtrend is increasing.
However, as mentioned earlier, the key is whether it can rise with support in the right Fibonacci ratio 1.902 (101978.54) ~ 2 (106178.85) section.
If not, it is likely to fall to around 97226.92.
-
The next volatility period is expected to be around June 6.
Accordingly, the current trend is likely to be maintained until the next volatility period.
In order to turn into an upward trend, the price must rise above the M-Signal indicator of the 1D chart and maintain it.
However, since the HA-High indicator is formed at the point of 108316.90, it is highly likely that the uptrend will begin only when it rises above this point.
Therefore, we need to check if it rises above 108316.90 and receives support.
-
In my chart, the basic trading strategy is to buy near the HA-Low indicator and sell near the HA-High indicator.
However, if it receives support from the HA-High indicator and rises, it is likely to show a stepwise uptrend, and if it receives resistance from the HA-Low indicator and falls, it is likely to show a stepwise downtrend.
The end of the stepwise uptrend is a downtrend, and the end of the stepwise downtrend is an uptrend.
Therefore, in order to establish a buying strategy, we need to meet the HA-Low indicator.
In other words, if the HA-Low indicator is newly created as the price falls, it is important to see whether there is support near it.
-
If it falls below the dotted line indicated on the OBV indicator, it will fall below the previous High Line, so there is a possibility that it will lead to an additional decline.
In particular, if it falls below the Low Line, the price is likely to fall.
However, since the channel of High Line ~ Low Line is still showing an upward trend, I think the overall movement is still maintaining an upward trend.
In order for the channel of High Line ~ Low Line to turn downward, it must fall to the area indicated by the arrow.
-
To summarize the above,
- Check for support in the right Fibonacci ratio 1.902(101978.54) ~ 2(106178.85) section
- The start of the uptrend is when the price rises above 108316.90 and maintains it
- Check for support near 97226.92 in the event of a further decline
- If the HA-Low indicator is newly generated in the event of a further decline, focus on finding the time to buy based on whether there is support near that area
-
Thank you for reading to the end.
I hope you have a successful trade.
--------------------------------------------------
- This is an explanation of the big picture.
(3-year bull market, 1-year bear market pattern)
I will explain more details when the bear market starts.
------------------------------------------------------

Bitcoin Monthly Outlook – Long-Term PerspectiveBitcoin Monthly Outlook – Long-Term Perspective
Regardless of the daily fundamental noise—ranging from institutional interest to global policy shifts—technical analysis also supports the possibility of further growth in Bitcoin over the long term.
Currently, Bitcoin remains in its primary bullish trend and is still moving within a rising channel structure.
Even if a pullback occurs toward the $39,000 level, the overall trend structure would remain intact, and the risk-to-reward ratio could still be considered favorable (approximately 4:1 in this context).
Of course, the market is driven by probabilities, and deeper corrections are always possible. However, both positive news and technical structure continue to signal a potential continuation of the upward movement.
📌 Based on this structure, key long-term support levels to watch are:
$70.000
$50,000
$40,000
📌 This analysis is for educational and informational purposes only and does not constitute financial advice.
📝 Follow for updates and long-term crypto insights.

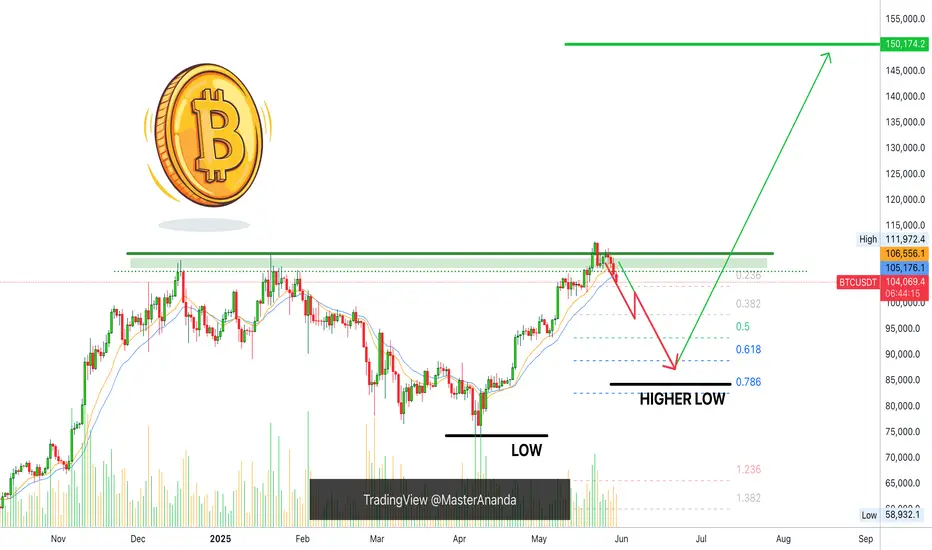
Bitcoin Bullish, Will Not Hit $200,000 This Cycle, $137,000 NextBitcoin is still bullish. A higher low is a bullish development. If Bitcoin stops bleeding at around a price of $88,888.88 this would be a strong, perfect, higher low compared to 7-April and it would match perfectly a classic correction because this price sits at the Fibonacci golden ratio.
Good afternoon my fellow Cryptocurrency trader, timing is important and we got perfect timing on this retrace. How far down will it go?
It is still too early to say but we know that below $74,500 isn't possible because that's the last low. $78,000 is possible but not necessary so we are betting that the lowest ever will be above $80,000. Remember, Bitcoin will never ever trade below $80,000 in its history. Sorry, but these prices are gone, nobody can buy this low again.
There is good news though. You can still buy when the next low is established.
It is impossible to predict the exact price when Bitcoin will stop dropping, but it is possible to see a support level being developed. So when the next support is in, we can cover (close the SHORT) and go LONG again.
Pretty simple. Buy when prices are low, sell when prices are high.
A new all-time high is pretty high and thus we sell (sold).
When the next support level is established, we buy again.
Thanks a lot for your continued support.
Each Altcoin needs to be considered individually because some will grow while others move down. We are more advanced now in this bull market cycle. You can visit my profile for more.
Namaste.
BTCUSDT.P | Multi Timeframe AnalyseHello to my dear friends.
Everything is told in the video.
Enjoy the trading fam.


BTCUSD Bearish Signal | Technical + Custom AlgoSmart Trend Signal | Technical Analysis + Custom Algorithm
This signal is the result of a combination of classic technical trend analysis and a proprietary software I personally developed.

BITCOIN Bearish Signal | Technical + Custom AlgoSmart Trend Signal | Technical Analysis + Custom Algorithm
This signal is the result of a combination of classic technical trend analysis and a proprietary software I personally developed.

BTCUSDT Hello traders, wishing everyone a great weekend!
I’ve identified a sell opportunity on BTCUSDT and decided to share it with you as well.
🔍 Trade Details:
✔️ Timeframe: 15-Minute
✔️ Risk-to-Reward Ratio: 1:2 / 1:4
✔️ Trade Direction: Sell
✔️ Entry Price: 103,826.28
✔️ Take Profit: 103,428.15
✔️ Stop Loss: 104,025.48
🔔 Disclaimer: This is not financial advice. I’m simply sharing a trade I’ve taken based on my personal trading system, strictly for educational and illustrative purposes.
📌 Interested in a systematic, data-driven trading approach?
💡 Follow the page and turn on notifications to stay informed about upcoming trade ideas and advanced market insights.

Be careful with BTC !!!Finally, the price broke the wedge, and the price experienced a significant drop. I think is the time for btc to rise again to 111k after more correction . STRONG SUPPORT 98k
Give me some energy !!
✨We spend hours finding potential opportunities and writing useful ideas, we would be happy if you support us.
Best regards CobraVanguard.💚
_ _ _ _ __ _ _ _ _ _ _ _ _ _ _ _ _ _ _ _ _ _ _ _ _ _ _ _ _ _ _ _
✅Thank you, and for more ideas, hit ❤️Like❤️ and 🌟Follow🌟!
⚠️Things can change...
The markets are always changing and even with all these signals, the market changes tend to be strong and fast!!

BTC/USDT Chart Analysis.
BTC has been in an uptrend since early April 2025, breaking above a strong horizontal resistance line (visible in the chart).
However, we can now observe a descending channel (falling wedge) after the peak, indicating a potential pullback.
Support Levels:
The price has tested the 50-day SMA (red) and is approaching the 200-day SMA (green), which is a strong dynamic support (around $94,740–$98,000).
Horizontal support lines are around the $103,000 and $100,000 levels, acting as immediate support.
Price Pattern:
The pattern resembles a bullish flag or descending wedge, suggesting a possible continuation of the previous upward move if a breakout occurs.
Before a bullish reversal, a retest of support levels (highlighted in the blue circle) near the moving averages is possible.
Future Path (as drawn on the chart):
Possible pullback to around $100,000–$98,000 levels.
Reversal and breakout are expected to be between $112,000 and $115,000 initially, and possibly higher to $125,000–$130,000.
Volume & Momentum:
No volume data is shown, but the price action indicates a correction with weakening momentum.
Trend lines are sloping upwards, indicating underlying strength despite the correction.
Trade Setup Based on This Analysis
Entry Zone: Around $100,000–$98,000 (if price tests support and forms reversal patterns like a bullish engulfing or hammer).
Stop-Loss: Below $94,000 (below the 200 SMA and the trendline support).
Short-Term Target: $112,000–$115,000.
Mid-Term Target: $125,000–$130,000.
Risk Considerations
If BTC breaks below the 200 SMA and horizontal support near $94,000, the trend may weaken.
Thanks for your support!
DYOR. NFA

Bitcoin's at ALL TIME HIGHS and I'm going ALL IN!!As Bitcoin surges to new all-time highs, I've made a pivotal decision: to stop saving in dollars and start holding Bitcoin.
Why Bitcoin? Self-Custody:
Owning Bitcoin means true ownership. With self-custody, I control my private keys, ensuring my wealth isn't subject to third-party risks like bank failures or government seizures.
Declining Dollar Value: The U.S. dollar continues to depreciate due to inflation and economic policies. Holding Bitcoin, a deflationary asset, offers a hedge against this erosion of purchasing power.
Global Accessibility: Bitcoin transcends borders, providing financial inclusion for anyone with internet access, especially in regions with unstable currencies.
Security and Privacy: With proper self-custody practices, my Bitcoin holdings are secure from hacks and offer enhanced privacy compared to traditional financial systems.
As I monitor the BTC/USD daily chart, the trend is clear: Bitcoin isn't just a speculative asset; it's a movement towards financial sovereignty.

Bitcoin Challenges Support —Never Ever Below $80,000 (80K)I updated this chart to show the full support range. This is Bitcoin's main support. Between $100,000 and $103,000. If this level breaks, prepare to see Bitcoin producing another week red then consolidation, on and on, before the next high.
If this support holds, then we can expect a soon and fast recovery.
The most likely scenario is that it will take around 2-3 weeks before the retrace-correction is over followed by new growth.
Remember, always a higher low. Just look back to August 2024. After the major low was in, there was indeed retraces and corrections as part of the bullish phase. It is the same.
Retraces and corrections are just an opportunity to buy-in, rebuy and reload.
If you missed below $80,000 in the last drop, you can get below $90,000 in this drop. But not much lower.
Bitcoin will never ever trade below 80K.
Thank you for reading.
Namaste.

BTCUSDT/IBIT: No Recovery in Sight Yet. Don't Be Fooled.Hello everyone. As I closely examine BTCUSDT and IBIT, I have a significant observation: there are no clear signals yet that selling is slowing down. This means it's too early to speak of a recovery in the market.
As intelligent investors, we look not only at price movements but also at the market's underlying dynamics. Currently, I see no clear indication in either BTCUSDT or IBIT that selling pressure is diminishing.
In such situations, a meticulous examination of the volume footprint is essential. We analyze every detail in the volume to understand if buyers are truly stepping in, and if selling orders are being absorbed. At the same time, I am closely monitoring CDV (Cumulative Delta Volume) divergences. If selling pressure were truly decreasing, we would expect to see clues in the CDV, but as of now, such confirmation is absent.
To confidently state that the market has entered a recovery phase, we need strong and confirmed breakouts on a low timeframe (LTF). Following these breakouts, a successful retest of the broken levels as support would be a reliable signal that the market has shifted direction. However, at present, such a structure has not formed.
As you know, I only trade coins that show a sudden and significant increase in volume. This approach allows me to focus my capital where the market is truly revealing its intentions. My current observation in BTCUSDT and IBIT is that this type of volume increase is not yet signaling a recovery.
Therefore, for those anticipating a market recovery, it is crucial not to act hastily and to await concrete confirmation signals. The market rewards the patient.
📌I keep my charts clean and simple because I believe clarity leads to better decisions.
📌My approach is built on years of experience and a solid track record. I don’t claim to know it all but I’m confident in my ability to spot high-probability setups.
📌If you would like to learn how to use the heatmap, cumulative volume delta and volume footprint techniques that I use below to determine very accurate demand regions, you can send me a private message. I help anyone who wants it completely free of charge.
🔑I have a long list of my proven technique below:
🎯 ZENUSDT.P: Patience & Profitability | %230 Reaction from the Sniper Entry
🐶 DOGEUSDT.P: Next Move
🎨 RENDERUSDT.P: Opportunity of the Month
💎 ETHUSDT.P: Where to Retrace
🟢 BNBUSDT.P: Potential Surge
📊 BTC Dominance: Reaction Zone
🌊 WAVESUSDT.P: Demand Zone Potential
🟣 UNIUSDT.P: Long-Term Trade
🔵 XRPUSDT.P: Entry Zones
🔗 LINKUSDT.P: Follow The River
📈 BTCUSDT.P: Two Key Demand Zones
🟩 POLUSDT: Bullish Momentum
🌟 PENDLEUSDT.P: Where Opportunity Meets Precision
🔥 BTCUSDT.P: Liquidation of Highly Leveraged Longs
🌊 SOLUSDT.P: SOL's Dip - Your Opportunity
🐸 1000PEPEUSDT.P: Prime Bounce Zone Unlocked
🚀 ETHUSDT.P: Set to Explode - Don't Miss This Game Changer
🤖 IQUSDT: Smart Plan
⚡️ PONDUSDT: A Trade Not Taken Is Better Than a Losing One
💼 STMXUSDT: 2 Buying Areas
🐢 TURBOUSDT: Buy Zones and Buyer Presence
🌍 ICPUSDT.P: Massive Upside Potential | Check the Trade Update For Seeing Results
🟠 IDEXUSDT: Spot Buy Area | %26 Profit if You Trade with MSB
📌 USUALUSDT: Buyers Are Active + %70 Profit in Total
🌟 FORTHUSDT: Sniper Entry +%26 Reaction
🐳 QKCUSDT: Sniper Entry +%57 Reaction
📊 BTC.D: Retest of Key Area Highly Likely
📊 XNOUSDT %80 Reaction with a Simple Blue Box!
📊 BELUSDT Amazing %120 Reaction!
📊 Simple Red Box, Extraordinary Results
📊 TIAUSDT | Still No Buyers—Maintaining a Bearish Outlook
📊 OGNUSDT | One of Today’s Highest Volume Gainers – +32.44%
I stopped adding to the list because it's kinda tiring to add 5-10 charts in every move but you can check my profile and see that it goes on..

SUSDT - 1WThe previous bullish analysis failed and I currently expect a correction to the range of 0.3 to 0.33 cents...

BTC/USD Potential Bullish Reversal – Falling Wedge Breakout WatcBitcoin is showing signs of a potential reversal on the 15-minute timeframe. A Falling Wedge pattern is forming, often seen as a possible early signal for upside continuation.
📌 Technical Overview:
Price is currently testing the wedge resistance.
If price breaks out and retests the wedge, it could lead to a continuation toward the 108,995–109,199 zone.
Strong horizontal support seen around 104,636.
Bullish price action forming higher lows.
📈 Breakout Confirmation:
A clear breakout and retest of the descending trendline could initiate momentum toward the upper resistance zone.
🟢 Target Area: 108,995–109,199
🔴 Support Level: 104,636
⚠️ Invalidation: Below 104,300 zone
🔎 Always observe price action and volume confirmation before making decisions. Use proper risk management.

Bitcoin Is Entering Into Very Difficult TimesHello, Skyrexians!
I have been thinking what will happen next with BINANCE:BTCUSDT and it was obvious that correction has been started, you can easily find my recent update on Bitcoin and check it, but what will happen after. Today I decided that the first impulse has not been finessed yet and we need one more small leg up to complete this growth before significant correction.
Let's take a look at the yellow Elliott waves cycle. Awesome Oscillator gave me an idea that only wave 3 has been finished above $110k. Now price is printing wave 4. Wave 4 has a target between 0.38 and 0.5 Fibonacci, but this time it will be definitely 0.38 at $101k. Here was the smaller degree wave's 4 bottom. Wave 5 will be shortened because wave 3 was extended, it's very logically. After $111k retest the major wave 2 will go to $90k approximately. Difficult times ahead for crypto, I think this period will be finished only at the end of June.
Best regards,
Ivan Skyrexio
___________________________________________________________
Please, boost this article and subscribe our page if you like analysis!
