BTCUSDT - UniverseMetta - Analysis#BTCUSDT - UniverseMetta - Analysis
Current market context:
BTC has completed the 5th wave, reaching the 2.618 Fibonacci extension and printing a new ATH. A correction phase now appears likely — and may serve as the foundation for the next bullish impulse.
📆 W1 – Weekly Timeframe
🔹 Price reached $112,200 (2.618 Fibo extension)
🔹 A top fractal has formed – a potential early signal for a short- to medium-term correction
🔹 Key correction zone:
• $97,700 – $93,250 – $88,860
🔹 Weekly close will be important for confirmation — especially if we see a close below the channel
📉 D1 – Daily Timeframe
🔹 A 3-wave corrective structure appears to be forming
🔹 Potential breakdown from the rising channel
🔹 Watch for retracement levels:
• $97,700 (0.618)
• $93,250 (0.5)
• $88,860 (0.382)
🔁 These areas are ideal zones for re-entry and long setups in trend continuation
⏳ H4 – Tactical Entry Opportunity
🔹 Wave 3 is forming to the downside
🔹 Entry possible on channel retest or breakout confirmation
🎯 Trade idea parameters:
Entry: 106,493.44 (or retest confirmation on H4)
Take Profits (TP):
• 103,135.48
• 97,721.82
• 93,250.02
• 88,963.55
Stop Loss: 112,341.18
BTCUSDT

Trading balanceTrading balance The price of the asset has rebounded from the balance zone. With the prospect of growth into the resistance zone.

BTC ANALYSIS🔆#BTC Analysis : Channel Following ⛔️⛔️
As we can see that #BTC is following ascending channel on 4h time frame. We can see a bullish formation here. And if it trade with good volume then we can see a proper bullish move in #BTC
🔖 Current Price: $108700
⏳ Target Price: $115300
⁉️ What to do?
- Keep your eyes on the chart, observe trading volume and stay accustom to market moves.🚀💸
#BTC #Cryptocurrency #ChartPattern #DYOR

BTC Bull time a little correction to $86.5k or a bit lower is possible
and my prediction is BTC will rise afterwards
maybe to $88.9k
BINANCE:BTCUSDT
COINBASE:BTCUSD
𓄀𝓈𝓉𝒶𝓎 𝓉𝓊𝓃ℯ𝒹 𓃓

Whales Wrote the Rules stop your imagination and Lose more Is it true that whales control the charts, or is it just another trading myth?
Why does everything look perfect—until the exact opposite happens?
This analysis reveals how smart money traps retail traders in plain sight.
Hello✌
Spend 3 minutes ⏰ reading this educational material.
🎯 Analytical Insight on XRP:
XRP is showing classic signs of compression, resembling a tightly wound spring ready to release. Momentum is building, and a breakout appears imminent based on current price structure and volume behavior 📈. While my long-term outlook remains significantly bullish, this setup suggests a conservative upside of at least 18%, with a key target in focus at $2.70 🚀.
Now , let's dive into the educational section,
📊 TradingView Tools to Track Whale Behavior
One of the most powerful truths in trading is this:
Smart money always leaves a trace—you just need to know where and how to look. TradingView provides some powerful tools to help you identify those footprints.
Volume Profile (Fixed Range / Session Volume): Use this tool to spot where the most volume was traded in specific ranges. These high-volume areas often signal zones where whales have entered or exited positions.
Smart Money Concepts / Order Blocks : Now natively available in TradingView for Pro+ and Premium plans, these highlight potential manipulation zones, institutional footprints, and key support/resistance levels.
Liquidity Zones: Use custom indicators like Liquidity Pools Detector or combine ATR with price structure to visualize high-risk/high-reward zones—whales love ambushing retail here.
Practical Tip:
Open the Bitcoin chart. Apply the Volume Profile Fixed Range tool across a two-week range. Look for areas with the highest volume concentration—these are likely whale action zones. Now overlay the Order Block indicator. You’ll often find those zones overlap.
🧠 Understanding Whale Behavior
Whales typically act when the crowd is at extreme fear or greed.
They move against the market’s emotional wave—and to do that, they need to mislead the herd. They create setups that look obvious but are designed to trap.
🐟 How Retail Traders Get Hunted
Here’s the classic trap:
The market makes a fake drop → panic selling → retail goes short.
Then whales step in, absorb liquidity, push price up → retail goes long too late.
Finally, whales dump at the top, and price collapses again.
🔄 Whale Playbook: The Four Phases
Silent Accumulation
Fake Breakout Pump
Distribution During Peak Greed
Dump + Liquidity Grab
You’ll find this playbook hidden in plain sight—if you stop chasing noise and start tracking volume, liquidity, and sentiment.
⚠️ Why Retail Always Ends Up on the Wrong Side
Because they’re looking for confirmation, not truth.
Whales exploit this—chart patterns, indicators, and fake breakouts are all part of the trap.
You need more than candles—you need context.
🔍 Chart Patterns or Psychological Traps?
Patterns like Head & Shoulders, Wyckoff Phases, or Triangles?
Whales know you’re watching them. They use these patterns as bait.
Unless combined with volume confirmation and liquidity context, most patterns are psychological illusions.
🧭 How to Follow the Smart Money
Study candle behavior with volume (Volume Spread Analysis)
Drop to lower timeframes to confirm liquidity zones
Use Anchored VWAP from major pivot highs/lows
Watch for divergence between price and volume—especially at highs/lows
💡 Conclusion:
There’s no holy grail in trading—but if you start thinking like a whale instead of chasing them, you’ll stop being the bait.
Use TradingView’s institutional-level tools to decode real market intentions.
Next time you spot a "perfect breakout," ask: who's on the other side of this trade—and why?
always conduct your own research before making investment decisions. That being said, please take note of the disclaimer section at the bottom of each post for further details 📜✅.
Give me some energy !!
✨We invest countless hours researching opportunities and crafting valuable ideas. Your support means the world to us! If you have any questions, feel free to drop them in the comment box.
Cheers, Mad Whale. 🐋

Bitcoin 150k is very likely On weekly timeframe bitcoin broke the yellow resistance few weeks ago, now the support on weekly is about 99.6k and resistance about 148k

$BCHUSDT falling wedge 1H chartSET:BCH is breaking out of a falling wedge on the 1H chart!
Price bouncing from the demand zone with strong bullish momentum.
- Entry: $416 / $418
- SL: $407
- Target: $461+
DYRO, NFA

Btc october 2025 local top?#Bitcoin bull run is not over yet, there is a high probability that we will see a local top by October and also the possibility of the next local bottom in October 2026 is also in the plan.
CRYPTOCAP:BTC

Bitcoin (BTCUSDT) - Consolidation Above Support Trendline -DailyBitcoin (BTCUSDT) price is currently consolidating above a trendline support level (between $107,000 and $109,000).
Bitcoin price has been in an uptrend throughout May 2025.
If Bitcoin price closes below $106,000 a pullback could occur down to $104,000 and $100,000.
Support Levels: $107K, $105K, $103K, $100K, $95K, $90K.
Resistance Levels: $110K, $112K, $120K, $130, $136K, $150.
Stock market correlations and corporate earnings could affect short-term price action for Bitcoin (e.g. S&P500, Nasdaq, Dow Jones, Nvidia, Dell, Marvell, etc).
Breaking News, corporate earnings and announcements, presidential and government law changes, and consumer sentiment can all affect the price of Bitcoin.

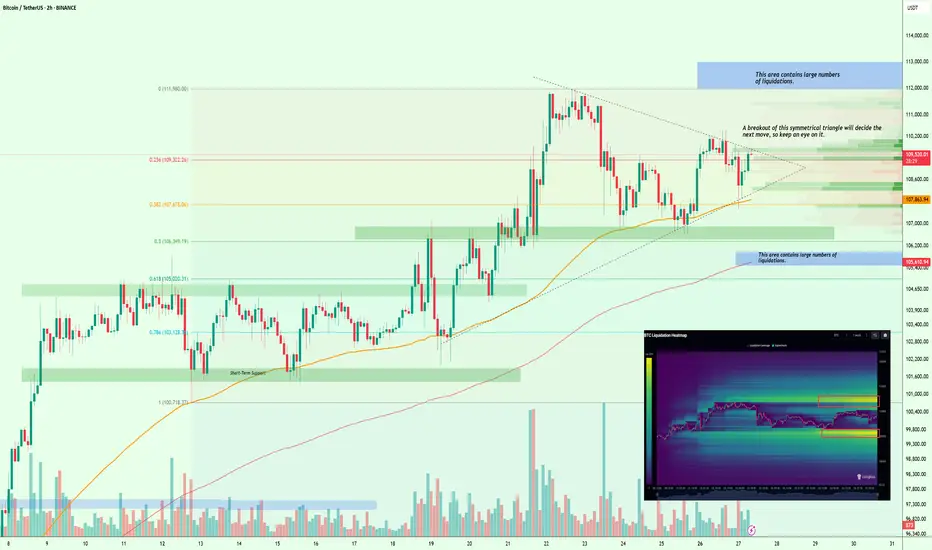
$BTC Liquidity Squeeze Incoming – Breakout or Breakdown?#Bitcoin
According to the liquidation heat map, CRYPTOCAP:BTC is building a large cluster of liquidations on both the upside and downside, creating some confusion in the market. However, the nearest major liquidation zone is around $112K–$113K, which increases the chances of a move toward that range.
Technically, BTC is forming a symmetrical triangle, and the breakout from this pattern will likely determine the next major move.
So keep a close eye on it.
I’ll keep you posted as things unfold.
If you find my updates helpful, don’t forget to like and follow for more!
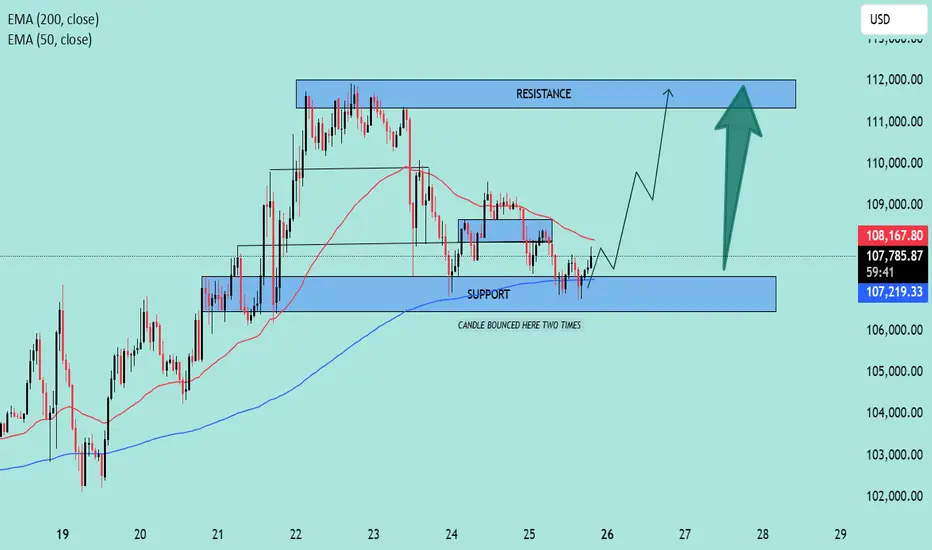
BTC/USD Rebound in Play! | Key Support Holding, Eyes on $112K📊 BTC/USD Technical Analysis
🗓️ Chart Date: May 25, 2025
🔍 Key Levels:
🔵 Support Zone: $106,800 – $107,300
Notably, price bounced twice in this region, indicating strong buying interest.
This area aligns closely with the 200 EMA (currently at $107,213.51), adding further confluence as dynamic support.
🔴 Resistance Zone: $111,800 – $112,300
Previous highs and consolidation make this a significant area where sellers may re-enter the market.
📈 Indicators:
🔵 EMA 200 (Blue): $107,213.51
Acts as a strong dynamic support; price bounced off it recently.
🔴 EMA 50 (Red): $108,182.91
Price is currently below the 50 EMA, suggesting short-term bearish pressure remains until this level is reclaimed.
🧠 Market Structure & Price Action:
After a sharp drop from the resistance zone, price found solid footing at the support zone.
Recent candles show rejection wicks from the downside, hinting at potential bullish reversal.
A breakout above minor consolidation and 50 EMA could trigger a bullish continuation toward the resistance.
📌 Forecast:
✅ If the price holds above the support zone and breaks above $108,200, we can expect a bullish move toward $112,000.
⚠️ However, a failure to break above the 50 EMA could lead to a retest of the support zone.
🧭 Trade Idea (Not Financial Advice):
📥 Long Bias:
Entry: On confirmed breakout above $108,200
SL: Below $107,000
TP: $111,800 – $112,300
📌 Conclusion:
The chart setup suggests a potential bullish reversal 📈 from a key support zone, supported by EMA 200. Watch for a break above the 50 EMA for momentum confirmation.
🧠 Always confirm with volume and wait for confirmation before entering a position.
Still Strong Uptrend!Bitcoin (BTC-USD) Eyes $115K: Can the $10 Trillion Dream Become Reality?
Bitcoin is not pausing. Hovering just under $110,000, BTC-USD is moving with new capital, DeFi expansion, and institutional accumulation behind it—fueling one of the most aggressive pushes since the 2021 cycle. At $109,703, after printing an all-time high of $111,769 last week, the asset is rangebound between $107,500–$109,000 as volatility tightens ahead of the PCE inflation report and the flagship Bitcoin 2025 Conference.
DeFi on Bitcoin: From Digital Gold to Active Financial Infrastructure
A silent transformation is underway. Bitcoin isn’t just the digital gold it once was—it’s becoming programmable capital. The total value locked (TVL) in Bitcoin-based DeFi protocols has surged over 2,000% since 2024, hitting $6.67 billion. That figure isn’t just a milestone—it signals Bitcoin’s usability leap.
DeFi use cases now include collateralized loans, on-chain derivatives, decentralized exchanges, and algorithmic stablecoins—built directly on Bitcoin infrastructure. This is not passive holding; it’s an activated network that attracts capital with yield, utility, and interoperability. Bitcoin’s network is now monetizing time and trust.

a possible massacre.what if i told you that bitcoin could drop 50% before june is over?
i know that probably sounds extreme. maybe even a little unbelievable. and that's okay; most people react that way when faced with a scenario they weren't prepared for.
i’m not here to scare you, and i’m not trying to make a bold claim just to get attention. i’m here to share a message that comes from a rare, proprietary sell signal in our system; something that doesn’t trigger often, but when it does, we pay very close attention.
i believe there’s a real possibility bitcoin drops below 50k by the end of june.
---
here’s the technical stuff to anyone interested:
since the bottom in november 2022, bitcoin moved up in a clear five-wave pattern, peaking around january 2025. from there, it seems to be forming what’s known as an expanded flat correction. this is a three-wave structure (3-3-5) that often tricks the crowd before the next major move begins.
ironically, this potential drop doesn't change the bigger picture at all. i still believe the long-term target sits between 750k and 1m by year-end. but markets don’t move in straight lines; sometimes, they shake out everyone who’s too confident, right before taking off.
consider this a heads-up,
not a certainty,
but one worth preparing for.
---
ps. the stop-loss on my btc long sits at the target of this idea. if i'm right about this, my stop will get hit, and it will open the door to a new entry.
---
🌙


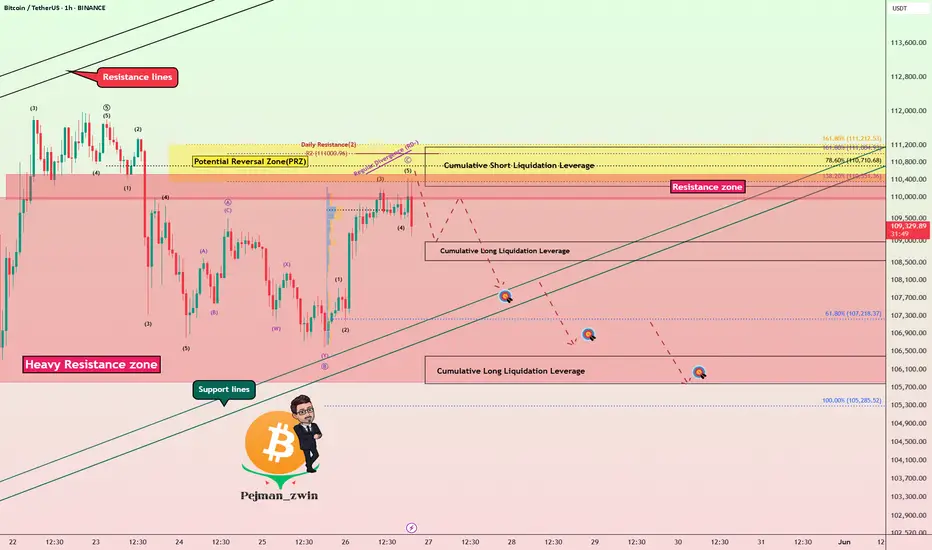
Bitcoin Bounce on Trump Tariff Delay – Short Setup Still Valid!Bitcoin ( BINANCE:BTCUSDT ) started to fall as I expected in the previous idea , and declined near the Support lines .
Bitcoin started pumping after the news that " US President Trump agreed to postpone 50% EU tariffs until July 9th ." Do you think this pumping of Bitcoin will continue?
Bitcoin is trading in a Heavy Resistance zone($110,000-$105,800) near the Potential Reversal Zone(PRZ) .
From the Elliott Wave theory perspective , Bitcoin appears to be in corrective waves , which is why I am labeling this idea as a ''Short''. The corrective waves structure is of the Expanding Flat(ABC/3-3-5) type.
I expect Bitcoin to attack the Support lines once again, and if these lines are broken, it will decline to the Targets I have indicated on the chart.
Notes :
MicroStrategy bought another 4,020 Bitcoins, but it didn't have much of an impact on the market.
If the Bitcoin price falls back below $109,000, about $185 million in long Bitcoin positions will be liquidated . = Attractive for exchanges
Bitcoin 2025 Conference to be Held in Las Vegas, Tuesday-Thursday = Could Cause Market Excitement .
Note: If Bitcoin touches $112,080, we should expect more pumping.
Please respect each other's ideas and express them politely if you agree or disagree.
Bitcoin Analyze (BTCUSDT), 1-hour time frame.
Be sure to follow the updated ideas.
Do not forget to put a Stop loss for your positions (For every position you want to open).
Please follow your strategy and updates; this is just my Idea, and I will gladly see your ideas in this post.
Please do not forget the ✅' like '✅ button 🙏😊 & Share it with your friends; thanks, and Trade safe.
BTCUSD Potential Reversal | Head and Shoulders Pattern FormedBitcoin (BTC/USD) is showing signs of a potential bearish reversal, forming a clear Head and Shoulders pattern on the 15-minute chart.
Key Technical Insights:
The structure is aligned with a classic head and shoulders setup.
Price action has respected the descending trendline resistance.
The right shoulder has formed under key supply pressure, increasing the probability of a drop.
A breakdown below the neckline could drive price toward the 107,400 zone.
Target zone aligns with previous consolidation and demand area.
This setup offers a well-defined risk-to-reward structure, based on pattern confirmation and market structure.
📉 Pattern-based idea with proper technical reasoning. Monitoring closely for breakdown and follow-through price action.

Bitcoin (BTC/USDT) – Flag Breakout Points to $114KHello guys!
Bitcoin continues to respect the bullish structure within its ascending channel, and we just got a clean breakout from a textbook bull flag.
After a solid move higher earlier this month, BTC cooled off inside a tight flag pattern, consolidating above $106K. That pullback helped reset momentum, and now we’ve broken out with conviction.
You can read about it here:
We’re currently hovering around $ 109.8 K. A short-term retest of the breakout zone near $108K–$108.5K wouldn’t be surprising. it could even offer a great entry opportunity before the next leg up.
If momentum holds, the projected target from this flag pattern lands in the $113.5K–$114K zone.
watch these:
Support: $107.5K–$108.5K
Target: $114K
Invalidation: Break below $107K
Bias remains bullish unless we lose the channel structure.

HelenP. I Bitcoin will start to decline and break trend lineHi folks today I'm prepared for you Bitcoin analytics. Observing this chart, we can see how the price dropped from support 2, which coincided with the support zone and reached the trned line. Then it turned around and started to grow, and soon reached the 83700 support level again and even broke it. Next, price some time traded near this level and after a retest, it turned around and made an impulse up, after which it turned around and then declined to the trend line, after which it rose to support 1, which coincided with one more support zone. Soon, BTC broke the 101400 level and then repeated movement when it traded near the support 2 level. Price, after trading near the 101400 level, rebounded from the trend line and rose to new ARH 112000 points and then went into correction. At the moment, I expect that BTCUSDT will start to decline, break the trend line, and continue to fall to the support zone. That's why I set my goal near this area, at the 102700 points. If you like my analytics you may support me with your like/comment ❤️

Bullish Momentum Building, $112K Breakout on the Horizon?Hey Realistic Traders!
Can BINANCE:BTCUSDT Break Past $112K and Set a New All-Time High? Let’s Break It Down...
Trend Analysis
On the H4 timeframe, BTCUSDT has consistently traded above the EMA-90 line, confirming the continuation of a bullish trend. Within this trend, a falling wedge pattern formed, which is typically considered a bullish reversal signal. This pattern was followed by a breakout marked by a bullish Marubozu candle, further strengthening the bullish outlook.
In addition, a bullish crossover appeared on the oscillator, providing additional confirmation of upward momentum. Based on these technical signals, the price is expected to continue its upward move toward the first target at 113,613, with a potential extension to the second target at 117,968.
The outlook remains valid as long as the price stays above the key stop-loss level at 105,681.
Support the channel by engaging with the content, using the rocket button, and sharing your opinions in the comments below.
Disclaimer: "Please note that this analysis is solely for educational purposes and should not be considered a recommendation to take a long or short position on Bitcoin.

Perfect Up —Mental TA, Predicting Bitcoin's price with your MindI get, I get it... You don't like it when I publish too many Bitcoin ideas.
You just don't like it when I continue to publish every single day. Since I love you and your continued support, I stopped publishing daily but I still get to publish ok? Ok!
Phew! I needed to get that stuff out of my system. All is good now thank you for reading more support and the comments about the TOP10 TOP Altcoins.
No bearish signals is a bullish signal.
Bullish signals are bullish signals.
Upgrade update improve mental programs. Bitcoin is not a mind but it was created through a mind. Everything starts first in the mind, think about it. You see? In order to conceive an idea or just to be able to grasp what I mean you have to think. Thinking happens in the mind right?
How does that sound for you?
Does it resonates with your thinking?
Makes sense?
If everything is in the mind and starts from a mind, a mind-point, then we can ask this same mind; where is Bitcoin headed next?
Information can come from three places only:
1) Your own individual conscious mind.
2) The personal unconscious.
3) The collective mind (the collective unconscious in CJung terminology).
If you mix your personal unconscious with the collective unconscious this can lead to mistakes. That's why some people get it right through intuition while others have it mixed. The problem is that information is mixed from the collective mind, your conscious mind and the personal unconscious. So you know that you know things that there is no way you can know. Sometimes you get it right and sometimes you get it wrong. The few times you get it right it is enough to confirm that the system is real and exist. When you get it wrong is because the information becomes mixed.
Lots of practice can solve this and you win.
Now that you've gained full access to your unconscious mind, ask the question, "Where is Bitcoin headed next."
Detach... Relax, do not interrupt just breathe and let the answer come in whatever way.
Practice, and based on the results you will know what's the meaning of the mental impressions you see.
Some people get it straight up. "Bitcoin is going up."
Some people get images of something positive and this needs to be interpreted. Other people hear sounds, others feelings, on and on.
» Technical analysis
The fact that Bitcoin continues rising moving up never down is as bullish as it gets. Remember, when there is a drop coming it drops, there is no in-between. When there is consolidation at resistance it means the bulls are in.
The bulls are in means the next major move is up. There can be swings short-term but ignore and bet on the bigger move. You know the next move is a rise, 100% confirmed, based on the chart, price action and candlestick, so you can always win betting on this move because it has the highest probability.
Bitcoin can't move any higher after hitting a top, think November 2021.
After hitting bottom, Bitcoin can only grow. The bottom was hit in early April.
Thanks a lot for your continued support.
Namaste.


$BTC to $120K?Bitcoin is still moving strongly inside the ascending channel, respecting both support and midline zones.
After bouncing from the lower boundary and holding above key horizontal support at $104.8K, BTC is showing signs of strength again.
With the trend intact and momentum building, a breakout toward the $116k 120k supply zone looks likely in the coming days.
Bulls remain in control as long as price holds above the mid channel and key FVG (Fair Value Gap) areas.
Watch the channel closely for confirmation.
DYRO, NFA

Bitcoin Market Update – May 26, 2025📅 Bitcoin Market Update – May 26, 2025
🚀 BTC Price: $110,157 (+2.95% 24h)
Bitcoin continues its upward trend, showing strong momentum and bullish sentiment across the market.
📊 Technical Snapshot:
• Range: $106,801 – $110,157
• Support: $107K – $108K
• Resistance: $111K – $112K
• Trend: Bullish
🔗 On-Chain Metrics:
• Short Squeeze Pressure: Rising on Binance
• ETF Inflows: $934M → Strong institutional interest
• Sentiment: Extreme Greed (Index 78)
🧭 Fundamentals:
• Major ETF inflows show growing trust from big players.
• Market sentiment remains highly optimistic.
📈 Forecasts:
• Short-Term: $110K – $112K
• Mid-Term: $112K – $125K
• Long-Term: Up to $140K (depending on macro conditions)
Keep an eye on 103k and 97k supporting levels as liquidity zones.
✅ Summary:
BTC remains bullish with key resistance at $112K.A breakout could open room for further upside. Stay tuned and manage risk wisely.
#Bitcoin #BTC #Crypto #SorooshX
