BTC Long / Buy SetupBTC is strongly Bullish towards 120k liquidity level, I'm not seeing any healthy correction before hitting the 120k level. If BTC strongly breaks and closes below 106.9k then chances are high that it will touch the weekly level and again come to 107k level, but this time it will struggle to break the 107k level because it will become bearish fvg, if it holds the 107k level and give any strong reaction from the zone then the next level is 120k. even a wick towards 105k or below doesn't matter, any body closing below the 106.9k (at least 4hrs) will lead short term weakness to the trend.
BTCUSDT

$WLD Price Update The downtrend continues, but we’re seeing signs of a potential bounce! 🚀
RSI at 32.15 approaching oversold levels!
Price hitting the bottom trendline of the descending channel.
Possible reversal to $2.20
Could this be the breakout we've been waiting for? 👀

BTCUSDT Hello everyone!
Today's first signal came from the BTCUSDT pair. After reaching an all-time high of $112,000 yesterday, BTC formed an ABCD pattern and retraced down to the Fibonacci extension level 1.000. In this pattern, a buy trade is typically initiated after the price retraces to the 1.000 level, and the Take Profit is set at the 0.618 Fibonacci level drawn from the B wave to the D wave.
Although I didn’t open this trade based on the ABCD strategy, I noticed the pattern forming and wanted to share it with you purely for educational purposes.
As for the current active trade, here are the detailed parameters:
🔍 Trade Details:
✔️ Timeframe: 15-Minute
✔️ Risk-to-Reward Ratio: 1:1.50
✔️ Trade Direction: Buy
✔️ Entry Price: 110844.19
✔️ Take Profit: 111497.09
✔️ Stop Loss: 110408.00
🔔 Disclaimer: This is not financial advice. I'm sharing a trade I'm personally taking based on my own system, strictly for educational and illustrative purposes.
📌 Interested in a systematic, data-driven approach to trading?
💡 Follow the page and turn on notifications to stay informed about future trade ideas and advanced market insights.

Next Target: Right Fibonacci Ratio 2.24 (116940.43)
Hello, traders.
If you "Follow" me, you will always get the latest information quickly.
Have a nice day today.
-------------------------------------
(BTCUSDT 1D chart)
It was supported near the Fibonacci ratio 2 (106178.85) and rose to renew the new high (ATH).
If this upward trend continues, it is expected to rise near the Fibonacci ratio 2.24 (116940.43).
-
If it falls,
1st: 102302.08
2nd: 97226.92
3rd: 89294.25
You need to check which of the 1st and 3rd areas above is supported.
Since the M-Signal indicator on the 1D chart is passing near the 1st area, if it falls below this, there is a possibility that it will turn into a short-term downtrend.
The M-Signal indicator on the 1W chart is still rising around 94K, but since the 97226.92 point is the HA-High indicator point on the 1W chart, I think it is likely to continue the upward trend if it receives support around this area.
The 89294.25 point is the HA-Low indicator point on the 1D chart, so if it receives support around this area, it is a good time to buy.
-
(30M chart)
If the price continues to rise by renewing the ATH, it is difficult to set support and resistance points.
Therefore, you need to be careful when trading coins (tokens) that are renewing the ATH.
Therefore, I think it is better to trade in a short-term trading (day trading) method, but to leave the number of coins (tokens) corresponding to the profit for the profit realization method.
In other words, when the price rises and then falls by the purchase price, the method is to sell only the purchase amount (+ transaction fee) to leave the coin (token) corresponding to the profit.
When selling, you should not sell the number of coins (tokens), but you should sell only the purchase amount.
You do not necessarily have to sell all of the purchase amount, but if possible, it is better to sell close to the purchase amount.
The reason is that when the price plummets or turns downward, there is a possibility of psychological pressure.
In my chart, the trading strategy is when the HA-Low and HA-High indicators are touched.
If it is supported near the HA-Low indicator, it is the time to buy, and when it meets the HA-High indicator, it is the time to sell.
However, if it is supported near the HA-High indicator, there is a possibility that a stepwise upward trend will continue, so a split selling strategy is necessary.
On the other hand, if it falls after receiving resistance from the HA-Low indicator, it is likely to show a stepwise downtrend, so a split buying strategy is needed.
-
When you meet the HA-Low and HA-High indicators, if you check the movement of the OBV indicator, it can help you create a trading strategy.
That is, when the OBV indicator breaks upwards through the Low Line, High Line, and OBV EMA, the price is likely to rise, and if the opposite happens, the price is likely to fall.
-
Thank you for reading to the end.
I hope you have a successful trade.
--------------------------------------------------
- This is an explanation of the big picture.
(3-year bull market, 1-year bear market pattern)
I will explain more details when the bear market starts.
------------------------------------------------------

Bitcoins LinesPrice is approaching previous highs with strong bullish momentum and no major resistance until the red-marked level around 240,000. Given the breakout structure and Fibonacci confluence, the most likely scenario is continuation toward the 140,000–160,000 range before facing any significant rejection. A stop loss would be prudent just below 91,000, with the initial target set at 139,000, and extended TP zones at 155,000 and 239,000. This trade aligns with a longer-term macro trend.

$MAGIC is breaking out after 30+ days of consolidation!Now testing the trendline with strong support at $0.16–$0.17 and holding above the 100 EMA.
If confirmed, we could see a move toward $0.36+ 🚀
Entry: CMP $0.1811
SL: $0.1631
Target: $0.3623
DYRO, NFA

$BTC Breaks Out $155K Target in SightBitcoin has officially broken out above the key $105K resistance zone, confirming a strong bullish structure on the 1-day chart.
The price now exceeds the previous supply area, which has flipped into solid support.
As long as BTC stays above this level, momentum remains bullish with a clear path toward the next major target at $ 155 K.
This breakout marks a strong continuation of the uptrend, and traders should keep a close eye on any retest of the $105K zone for potential long
opportunities.
DYRO, NFA

#BITCOIN HISTORY IS ABOUT TO REPEAT !!#Bitcoin HISTORY IS ABOUT TO REPEAT! 🔥
The next move is obvious…
🔹 November 2023: Major breakout led to a 140% rally
🔹 October 2024: Another breakout fueled a 50% move
🔹 Now — May 2025: We are currently observing the Semmeler structure; will it break out again? 👀
New ATH loading... 🚀
CRYPTOCAP:BTC BITSTAMP:BTCUSD BINANCE:BTCUSDT

BTC is high! Any Weakness?If you find this information inspiring/helpful, please consider a boost and follow! Any questions or comments, please leave a comment!
Bitcoin Breaks to All-Time Highs — What’s Next for Price Structure?
Bitcoin has officially pushed into new all-time highs, and while the move wasn’t entirely unexpected, it still packs a punch. We discussed this possibility in recent videos, though I wasn’t fully convinced at the time. That’s the nature of trading—uncertainty is the cost of admission, and conviction builds as structure confirms.
As always, I was watching the price action closely. BTC started providing the clues needed to lean into the more bullish interpretation. The levels held. The flips were clean. Momentum lined up.
That said, I did take some speculative shorts at lower degrees—not to fight the trend, but to respect possible overextensions within the count. For those following the Elliott Wave roadmap, these intraday reactions were worth probing, but nothing confirmed a larger reversal yet.
The key now is structure.
We’re currently navigating uncharted territory, and in these zones, understanding wave context and market behavior around prior resistance becomes even more critical. There’s no overhead supply—only psychology, fib projections and profit-taking to watch for.
Here’s what I’m focused on:
Clear labeling of the motive sequence—is this the end of a Wave 3 or just a smaller subdivision?
Volume behavior and momentum divergence—looking for any signals that we’re near exhaustion.
Pullback zones—marking areas where Wave 4 or consolidation might emerge, if it’s due.
This is a time to stay sharp, not euphoric.
Trade safe, trade smart, trade clarity.

BTCUSDT✅ New Trade Opportunity on BTCUSDT
There’s a new trade opportunity on BTCUSDT.
Earlier this morning, I took a trade but chose not to share it due to higher risk — it ended up hitting take profit.
Now, I’m entering a new setup and wanted to share it with you.
Since BTC is currently trading near all-time highs, I’ve kept the **Risk-to-Reward Ratio conservative at 1:1 for now.
However, if I see strong bullish momentum, I may extend the take profit target to \$112,400 — which I believe is likely to be tested later today.
🔍 **Trade Details:**
✔️ Timeframe: 15-Minute
✔️ Risk-to-Reward Ratio: 1:1
✔️ Trade Direction: Buy
✔️ Entry Price: **111,034.51**
✔️ Take Profit: **111,712.33**
✔️ Stop Loss: **110,479.90**
🔔 **Disclaimer:** This is not financial advice. I'm simply sharing a trade I'm personally taking based on my own system, strictly for educational and illustrative purposes.
📌 **Interested in a systematic, data-driven approach to trading?**
💡 Follow the page and turn on notifications to stay informed on future trade ideas and professional market insights.

BTC - Why THIS TIME is DIFFERENT (⊙ˍ⊙)This time IS DIFFERENT. Bitcoin has made a new ATH as I predicted in a few previous posts, but something's off...🤔
If we look at BTC from a macro view, the dates for this run up was quite extended. We do see some similarities in terms of the retracement (highlighted in blue) but from a timeframe analysis, there is no comparing this high to the previous:
stretching from March to October where classical bear market symptoms were show - lower highs and lower lows, with a duration unlike any of the previous cycles.
Interestingly, the previous season we increased not even 7% from the previous peak. And if we were to look at the same fractal, that places us around $116k.
But the ONE thing, that has had me suspicious this entire time (🥁) was ETH. Overlaying the ETH chart, we see that historically, ETH peaked a week or two after the BTC ATH - until this time.
The fact that BTC made such a dramatic ATH and Ethereum didn't? That was a new one. And even up to now, ETH is still 80% away only from it's previous ATH - imagine the altseason we will have IF ETH makes a new ATH... or will this time just be , different ?

XRUSDT IDEAWe can see a consolidation on the daily time frame. Btc has reached to new highs but alternate coins have not moved along with same motivation. Why?

BTCUSDTBTCUSDT is expected to have a chance to test the 112,678 level. If the price fails to break through this level, a correction is expected and the price is likely to fall.
🔥Trading futures, forex, CFDs and stocks carries a risk of loss.
Please consider carefully whether such trading is suitable for you.
>>GooD Luck 😊
❤️ Like and subscribe to never miss a new idea!

Bitcoin’s Pump to NEW ATH($109,845) Ends in High-Volume ReversalBitcoin ( BINANCE:BTCUSDT ) moved towards the targets as I expected in my previous idea , although it faced pump and dump moves in reaching the targets .
Bitcoin managed to create a new New All-Time High(ATH=$109,845) but immediately began to decline on high volume .
Bitcoin is trading in the Resistance zone($109,588-$105,860) and near the Resistance lines , Monthly Resistance(2) .
In terms of Elliott Wave theory , Bitcoin was able to complete main wave 5 .
I expect Bitcoin to fall to at least $102,200 AFTER breaking the Support zone($105,100-$104,140) , and the possibility of further declines is very high .
Also, on the 1-hour timeframe of the USDT.D% ( CRYPTOCAP:USDT.D ) chart, a bullish and regressive Falling Wedge pattern is visible , with its upper line broken.
Do you think Bitcoin can finally create a NEW All-Time High(ATH) Again!?
Note: If Bitcoin touches $110,100, we should expect a pump.
Please respect each other's ideas and express them politely if you agree or disagree.
Bitcoin Analyze (BTCUSDT), 1-hour time frame.
Be sure to follow the updated ideas.
Do not forget to put a Stop loss for your positions (For every position you want to open).
Please follow your strategy and updates; this is just my Idea, and I will gladly see your ideas in this post.
Please do not forget the ✅' like '✅ button 🙏😊 & Share it with your friends; thanks, and Trade safe.

Artavion Analysts Forecast Bitcoin to Reach $100,000 by End of MThe analytical company Artavion has released an updated forecast for the price of Bitcoin (BTC) by the end of May 2025. According to the experts, amid sustained institutional demand and limited supply following the recent halving, the price of the leading cryptocurrency could reach $100,000 in the coming days.
Key Growth Drivers
Analysts highlight several factors contributing to Bitcoin's price growth:
📈 Institutional Demand: Ongoing accumulation by investment funds and banks through spot ETFs approved in the U.S. and Asia.
⛏ Reduced Supply: The April halving has decreased miner rewards, limiting daily BTC issuance.
🇺🇸 Fed Policy Easing: Expectations of interest rate cuts are increasing demand for alternative assets, including crypto.
💼 Market Confidence: Growth in long-term holders and increasing BTC withdrawals from exchanges indicate a “HODLing” trend among investors.
Company Comment
"We are witnessing stable accumulation and a capital shift into digital assets. If markets avoid major shocks, Bitcoin has every chance to consolidate above $95,000 and briefly test the psychological barrier of $100,000," said Alexey Gurov, senior strategist at Artavion.
Potential Risks
Despite the optimistic outlook, analysts point out several risks that could impact the forecast:
📉 Unexpected macroeconomic data (e.g., rising inflation, stronger U.S. dollar);
⚠️ Regulatory actions from the SEC or other global bodies;
🌍 Escalation of geopolitical tensions, which could trigger risk-off sentiment.
Conclusion
Considering the current market environment and macroeconomic expectations, Artavion maintains a positive short-term outlook for Bitcoin through the end of May, while cautioning investors to remain aware of the sector’s inherent volatility and risk.

$TAOUSDT Breakout ReloadedLSE:TAO just flipped a major resistance into strong support around the $410 zone after breaking out of a long-term downtrend.
This retest held perfectly, and now the bulls are back in control.
With price trending above the 180-day SMA and momentum building, the next target is the all-time high at $777.
If this move continues, we could see a powerful rally unfold from here.
Keep a close eye on it! 🚀
DYRO, NFA

Phemex Analysis #82: BTC Breaking the $110,000 All-Time-High!Bitcoin ( PHEMEX:BTCUSDT.P ) has reached a new all-time high, surpassing $111,000, driven by strong institutional inflows, regulatory clarity, and macroeconomic factors. This surge follows our previous analysis , where we anticipated a potential breakout above the $105,000 mark. The current rally is fueled by increased demand from institutional investors, favorable regulatory developments, and concerns over traditional financial markets.
Possible Scenarios
1. Testing $120,000
With momentum on its side, Bitcoin could aim for the next psychological resistance at $120,000. Institutional interest, as evidenced by significant ETF inflows and corporate investments, supports this bullish outlook. Technical indicators, such as the "golden cross" pattern, also suggest continued upward momentum.
Pro Tips:
Monitor trading volume and market sentiment for signs of sustained bullishness.
Set stop-loss orders to protect against sudden reversals.
2. Rejection and Retest of $100,000 Support
After reaching new highs, Bitcoin may experience a pullback to test the $100,000 support level. This consolidation could be a healthy correction before the next leg up.
Pro Tips:
Watch for buying opportunities near the $100,000 support zone.
Be cautious of false breakouts and wait for confirmation before entering new positions.
3. Bearish Reversal Due to U.S. Treasury Bonds News
Rising U.S. Treasury yields and fiscal concerns have led to increased volatility in traditional markets. A significant shift in investor sentiment could trigger a bearish reversal in Bitcoin's price.
Pro Tips:
Stay informed about macroeconomic developments, particularly U.S. fiscal policies and bond market movements.
Long-Term Accumulation: For investors with a longer-term perspective, significant price dips near lower supports—such as $92750, $83000, or even $66810—could represent attractive opportunities to accumulate BTC at discounted valuations.
Conclusion
Bitcoin's recent surge past $110,000 marks a significant milestone, reflecting growing institutional adoption and favorable market conditions. While the bullish trend may continue, traders should remain vigilant and prepared for potential corrections or reversals influenced by macroeconomic factors. Employing sound trading strategies and staying informed will be key to navigating the evolving landscape of Bitcoin's price movements.
Pro Tips:
Armed Your Trading Arsenal with advanced tools like multiple watchlists, basket orders, and real-time strategy adjustments at Phemex. Our USDT-based scaled orders give you precise control over your risk, while iceberg orders provide stealthy execution.
Disclaimer: This is NOT financial or investment advice. Please conduct your own research (DYOR). Phemex is not responsible, directly or indirectly, for any damage or loss incurred or claimed to be caused by or in association with the use of or reliance on any content, goods, or services mentioned in this article.


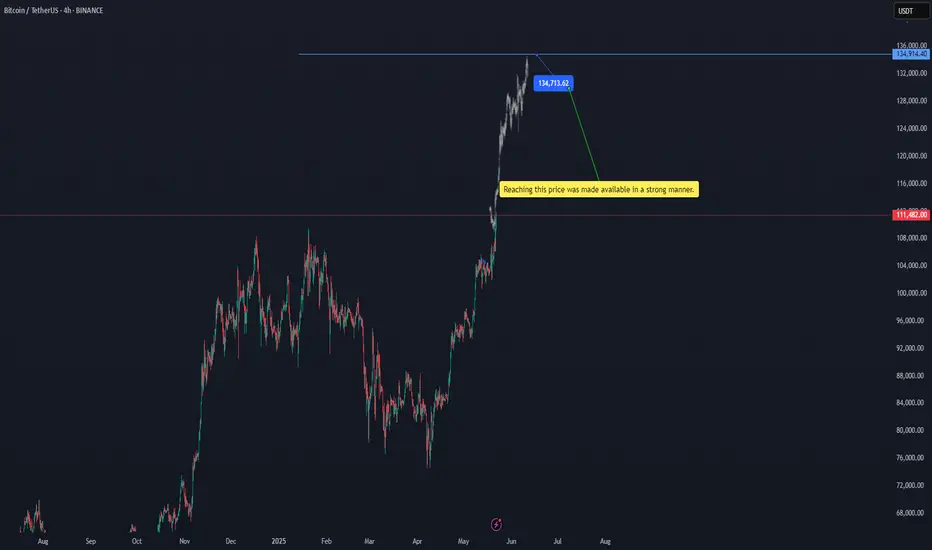
btcusdtReaching this price was made available in a strong manner. 134713.16$ BINANCE:BTCUSDT
Of course, there is a possibility of a temporary correction at the current price, but the target is $134,713.
#btc
BITCOIN - Time to buy again!Bitcoin will reach $130k with a slight price correction.
previous analysis
Best regards CobraVanguard.💚

Say hello to the $110k Bitcoin !The BTC will increase $15K and reach to the top of the wedge in the coming weeks .
Give me some energy !!
✨We spend hours finding potential opportunities and writing useful ideas, we would be happy if you support us.
Best regards CobraVanguard.💚
_ _ _ _ __ _ _ _ _ _ _ _ _ _ _ _ _ _ _ _ _ _ _ _ _ _ _ _ _ _ _ _
✅Thank you, and for more ideas, hit ❤️Like❤️ and 🌟Follow🌟!
⚠️Things can change...
The markets are always changing and even with all these signals, the market changes tend to be strong and fast!!

BITCOIN - Time to buy again!Currently, BTC is forming an ascending triangle, indicating a potential price increase. It is anticipated that the price could rise, aligning with the projected price movement (AB=CD).
However, it is crucial to wait for the triangle to break before taking any action.
Stay Awesome , CobraVanguard

BTCUSDT.P | 110kHello everyone, this is The Dark Analysis, let's have a look at BTCUSDT.P together.
I suggested you open a long position on BTCUSDT.P after 1m breakout.
you can see the result on the picture above.
NEW ENTRY
If you have missed this opportunity, you can open a buy position on BTC at this area:
5m-15m Order Block at 107428.7-106936.8
- SL :106887.8
- TP : Previous high
CONDITIONS
-The price most reach this zone with weak momentum.
-There must be a dogi or engulf candle after touching that very zone.
Don't be shy and feel free to tell me your ideas in comments.
