Analysis of BTC's Trend After Two Breakthroughs Above 105,000Recently, the price of BTC has been fluctuating within the range of 102,000-105,000 📊. It has broken through the 105,000 resistance level twice: the first breakout reached 106,000 💥, and today it strongly broke through to 107,000 🔥 before quickly retracing to the 102,000 support level ⬇️. After hitting the bottom, it rebounded rapidly to 105,000 📈. The current upward trend has not stalled 🚀, and shorting at high levels near 106,000 can be considered when the price rebounds to this area ⏳ 👉
⚡⚡⚡ BTCUSD ⚡⚡⚡
🚀 Sell@105000 - 106000
🚀 TP 102500 - 101500
🚀 Buy@101500 - 102500
🚀 TP 105000 - 106000
👇Accurate signals are updated every day 📈 If you encounter any problems during trading, these signals can serve as your reliable guide 🧭 Feel free to refer to them! I sincerely hope they'll be of great help to you 👇
BTCUSDT

BTCUSD buy opportunity next target The zone near 105,998 has been marked as a key resistance. BTC has previously failed to hold above this level, leading to sharp rejections.
Without strong volume confirmation, a breakout above this level may result in another bull trap.

Still bullish, it is recommended to focus on going long.Earlier, Bitcoin reached a weekly high of $106,518 before pulling back due to market liquidation, with total market liquidations exceeding $669 million. Bitcoin has closed higher for five consecutive weeks on the weekly chart, forming a "higher highs and higher lows" upward pattern, rising nearly 43.75% from its recent low. However, it encountered resistance near the all-time high of $109,588 and failed to break through. Currently, Bitcoin is trading in the $100,000-$110,000 range, with strong support at $100,000 and $90,000, and key resistance at $110,000.👉👉👉
After Bitcoin previously broke through $105,500, the moving averages showed an upward trend, and the RSI was in the overbought zone, indicating strong bullish momentum.
Overall, under the combined influence of news and technical factors, the Bitcoin market on May 19th showed a short-term volatile but long-term optimistic trend. Investors need to closely monitor changes in key support and resistance levels, as well as the impact of market news, and make investment decisions cautiously.
BTCUSD Trading Strategy
buy @ 102500-102700
sl 101000
tp 103800-104000
If you think the analysis helpful, you can give a thumbs-up to show your support. If you have different opinions, you can leave your thoughts in the comments. Thank you for reading!👉👉👉

BTC/USD:Trend Analysis for Next WeekSince April, BTC/USD has bottomed out and rebounded after hitting the vicinity of 74,500 US dollars twice. Currently, the price has strongly broken through the 100,000 US dollars mark. By observing its upward trend, a regular rhythm of "sharp rise + sideways movement" is evident — after each substantial rally, there is a period of sideways consolidation. Based on the current market conditions, it is recommended to adopt a strategy of selling high and buying low within the range of 102,000-105,000 US dollars to seize the band trading opportunities.
BTC/USD
buy@101500-102500
tp:105000-106000
sell@104500-105500
tp:103000-102000
I am committed to sharing trading signals every day. Among them, real-time signals will be flexibly pushed according to market dynamics. All the signals sent out last week accurately matched the market trends, helping numerous traders achieve substantial profits. Regardless of your previous investment performance, I believe that with the support of my professional strategies and timely signals, I will surely be able to assist you in breaking through investment bottlenecks and achieving new breakthroughs in the trading field.

BTC at a Critical Crossroad – Red Channel is the Last Standhello guys! let's review what happened in btc and what could happen!
📉 1. Blue Ascending Channel Broken:
Bitcoin has decisively broken below the blue ascending channel, signaling a shift in momentum from bullish to neutral/bearish.
🟥 2. Red Channel Holding as Support (For Now):
Despite the drop, the red ascending channel is still intact and currently acting as support. Price is consolidating right at its lower boundary.
⚠️ 3. If Red Channel Breaks – Expect Strong Downward Move:
A confirmed breakdown below the red channel would likely trigger a significant bearish move, potentially pushing BTC towards the GETTEX:97K - $96K support zone and possibly lower.
🧭 Conclusion:
We’re at a decision point. If bulls fail to hold the red channel, it could open the door to deeper correction.

get in loser, we're going to 1M.gm,
before i share my in-depth analysis, i just wanted to share a piece of my mind on how i approach this market:
there are many valid trajectories constantly at play. most people only ever see one; and they get emotionally attached to it. it’s usually the one that validates their own internal bias. they follow people who align with their belief system, and they end up in an echo chamber of regurgitated information, all in the name of pride and ego.
there’s nothing wrong with that, but you won’t find any of that on my page.
when i create a projection, i’m not just drawing it out. i spend a thousand hours tuning into the vibe... i become it. temporarily, i am the trajectory, which allows me to speak from its perspective on a deep, intuitive level. i’m not here to convince you that my idea is playing out. i’m just showing you that it’s one of many valid trajectories in this market.
this one here just happens to be my primary.
it has been for years, and it will remain my primary until we, at the very least, reach 752k.
now, that might sound mind-boggling to a lot of people, especially those still tuned into outdated belief systems or the mainstream media, which is incredibly gloomy right now.
----
what i have before you is a bullish nest that took 3 years to form;
a structure built with precision and patience,
and it's about to rip faces once the third wave explosively and unexpectedly begins.
i’ve color-coded all the waves for your convenience,
and i come to you this morning with a simple heads-up:
a monumental breakout is about to unfold.
and the harsh truth is,
you’re probably not going to be a part of it
because you got shaken out right before it began.
---
🌙
---

BTCUSD 19.05.2025 Bitcoin Navigator: BTC Update (May 2025)So the offline tournament is over, I took third place, and I just got back into work mode
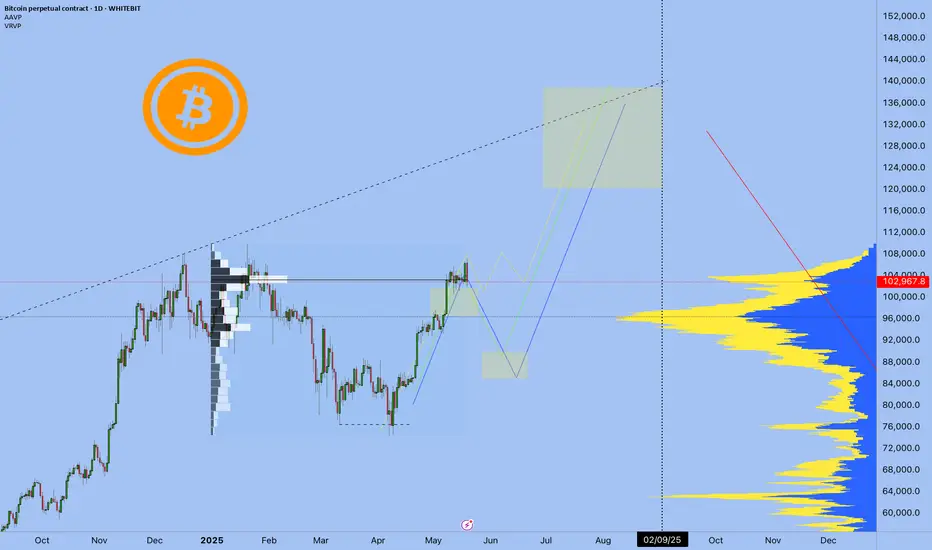
In my previous publication ( link ), I outlined possible scenarios for Bitcoin’s price action, leaning towards a correction from around the $98-101k zone down to approximately $88k.
However, the current market situation demonstrates the most optimistic scenario (highlighted in yellow on the chart). At the moment, we're seeing Bitcoin consolidating within a clear range, likely preparing for an upward breakout without a significant correction. This scenario is certainly the most bullish one, yet my inherent skepticism doesn't exclude the possibility of a correction before we reach a new all-time high (ATH).
📌 Key points in the current market situation:
The main question now is not whether we'll achieve a new ATH (as this seems almost inevitable) but rather how we'll get there.
Two scenarios are on the table: a smooth upward trajectory without substantial corrections, or an initial correction followed by a strong breakout.
🔖 Profit Maximization Strategy:
Many traders are shifting their attention towards altcoins, tempted by potentially greater returns. However, it's crucial to remember that higher upside potential also means significantly higher risks (low liquidity, increased manipulation, higher volatility).
I have already chosen the tokens that I am interested in for long time
Also now a new narrative has appeared, Internet Capital Markets (ICM) tokens. If you are interested, write in the comments "interesting ICM"
Best regards EXCAVO
Market Overview
WHAT HAPPENED?
Last week, bitcoin failed to gain a foothold above the key $105,000 mark. We observed active protection and absorption of market buys by the seller, as a result of which a sell zone of $105,000–$105,700 was formed. After that, the price went sideways again and remained there until the end of the week.
On Monday, there was a surge of liquidity above the previous high — the price tested the zone of volume anomalies of $107,000–$109,000, from where a sharp reaction from the seller immediately followed.
WHAT WILL HAPPEN: OR NOT?
At the moment, the local scenario is on the side of the "bears". There is a break in the uptrend on the hourly timeframe. There is an active absorption of buys in key sell areas, both in delta and volume.
When returning to the $105,700 level, it’s worth considering entering a short position if there is a repeat reaction from the seller, with a goal of reducing to $100,000. In the future, we’ll monitor the price behavior in the buyer's zones.
Sell Zones:
~$105,700 (point of strongest absorption of market buys),
$107,000–$109,000 (volume anomalies).
Buy Zones:
~$100,000 (initiative buying volumes),
$98,000–$97,200 (local support),
$93,000 level,
$91,500–$90,000 (strong buy-side imbalance),
$88,100–$87,000 (absorption of market sells),
$85,500–$84,000 (accumulated volumes),
$82,700–$81,400 (high-volume area),
$74,800 level,
$69,000–$60,600 (accumulated volumes).
IMPORTANT DATES
The following macroeconomic events are expected this week:
• Tuesday, May 20, 04:30 (UTC) — announcement of the Australian interest rate decision for May;
• Wednesday, May 21, 06:00 (UTC) — publication of the UK consumer price index for April;
• Thursday, May 22, 12:30 (UTC) — publication of the number of initial applications for unemployment benefits in the United States;
• Thursday, May 22, 13:45 (UTC) — publication of business activity indices in the manufacturing and services sectors of the United States for May;
• Thursday, May 22, 14:00 (UTC) — publication of sales results on the secondary housing market in the USA for April;
• Friday, May 23, 06:00 (UTC) — publication of German GDP for the first quarter of 2025;
• Friday, May 23, 14:00 (UTC) — publication of new home sales results in the United States for April.
*This post is not a financial recommendation. Make decisions based on your own experience.
#analytics

BTCUSDT - fractal from ATH I think this is a classic pattern now, and we are repeating the situation in the same price range that we had half a year ago when the ATX was forming. That is, we will not update the high or will do it a little bit, and after that we will go to the zone of 93 thousand plus minus and from there will be a significant reversal to 102 thousand, after that it is difficult to predict what will happen next. Either strongly down or strongly up, until then we can safely work on the fractal and after that I will give an update of the idea.

#BTC/USDT#BTC
The price is moving within a descending channel on the 1-hour frame, adhering well to it, and is heading for a strong breakout and retest.
We are experiencing a rebound from the lower boundary of the descending channel, which is support at 103200.
We are experiencing a downtrend on the RSI indicator, which is about to break and retest, supporting the upward trend.
We are looking for stability above the 100 moving average.
Entry price: 103708
First target: 104152
Second target: 104900
Third target: 105900

GBPUSD BULLISH OR BEARISH DETAILED ANALYSISGBPUSD is currently forming a clean bullish pennant pattern on the daily chart after a strong impulsive rally, indicating that the pair is consolidating before its next leg higher. Price is hovering around the 1.3360–1.3380 zone, coiling tightly within the pennant structure, and showing signs of breakout pressure building. This is a classic continuation setup in a trending market, and with volume compression and decreasing volatility, the stage is set for a bullish breakout toward the 1.4070–1.4100 region.
On the fundamental side, the British pound remains relatively supported due to recent hawkish rhetoric from the Bank of England, which is still closely monitoring wage inflation and strong labor market figures. Meanwhile, the US dollar is facing headwinds after softer CPI and PPI readings this month, fueling expectations of Fed rate cuts in the second half of 2025. These macro dynamics are increasingly tilting in favor of sterling strength, as investors begin pricing in yield divergence between the Fed and the BoE.
Technically, the bullish structure is intact and the pennant formation is forming right after a sharp move higher, which adds confluence to this pattern. The breakout zone to watch is 1.3380–1.3400, and if bulls can clear this area with momentum, we are likely to see a swift extension toward the 1.4070 level. The risk is well-contained below 1.3340, offering an excellent reward-to-risk ratio for breakout traders and trend followers.
This setup is not only technically sound but also backed by current macro shifts, making GBPUSD one of the most promising long opportunities right now. The market has been consolidating for weeks, building up energy, and with fundamentals aligning, this breakout could drive a strong move into Q3. I'm eyeing the 1.4070–1.4100 target in the coming weeks, and I'll continue to monitor for confirmation and execution signals.

BTCUSDTHello Traders! 👋
What are your thoughts on BITCOIN?
As expected, Bitcoin entered a corrective phase after reaching a key resistance zone. This move was accompanied by a bearish divergence, indicating weakening bullish momentum.
We expect the correction to extend toward the identified support zones, where price may find demand.
If Bitcoin holds at one of these key support levels, a bullish reversal could follow, potentially leading to a new upward leg and fresh all-time highs.
Is this correction setting the stage for the next big move? Share your thoughts below!
Don’t forget to like and share your thoughts in the comments! ❤️

BTC/USDT Breakout Signals Bullish Continuationhello guys!
BTC/USDT broke out of a symmetrical triangle on the 1H chart, signaling a bullish continuation. Price is currently around $105,471, with a projected move toward the $106,500 resistance zone. A retest of the breakout area ($104,500–$104,800) is possible before further upside.

BTC still consolidates within a rangeIf you were like me, you got a little dose of hopium after BTC closed above last week's resistance around $105k.
Nonetheless, resistance was expected from $105k - $108k with price starting the week with a bearish engulfing candle, currently trading around $103.1k.
We will have to see if last week's support around $101.5k holds.
If the price continues with bullish momentum and does something like the period from 22 Apr - 6 May, a successful bull flag breakout could take BTC to $115k.
If support is lost, we could see retests of previous levels as low as $94.5k. However, my guess would be a test of $97.5k before going higher, creating a HHHL market structure.

BITCOIN ROADMAP IS VERY CLEAR.I think Bitcoin will make its new ath soon. The long-term 5th uptrend wave indicates this rise.
We have 2 possibilities later on.
A correction or NEW ERA.
There is no need for very complicated analysis, I think all the waves here are quite regular.
Bitcoin has followed its own roadmap very regular.
* The purpose of my graphic drawings is purely educational.
* What i write here is not an investment advice. Please do your own research before investing in any asset.
* Never take my personal opinions as investment advice, you may lose your money.

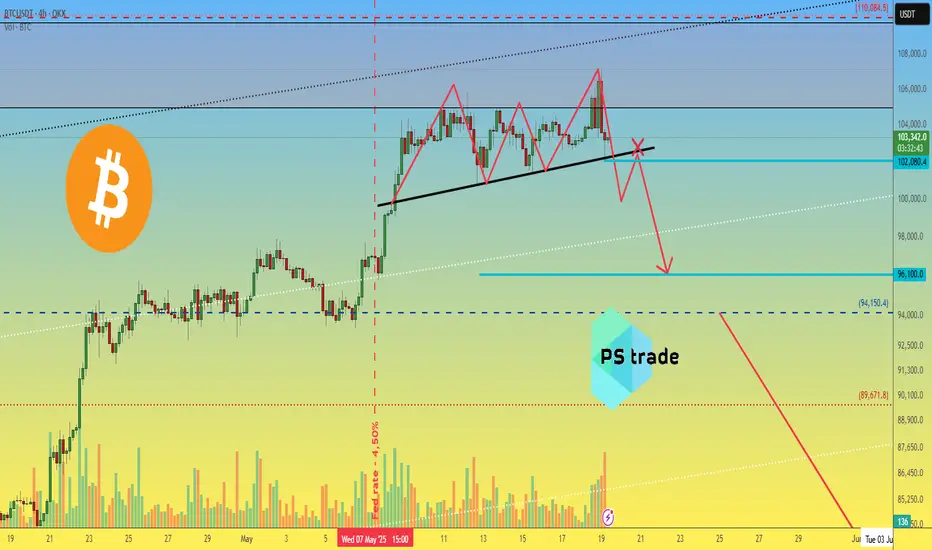
Bitcoin BTC price analysis - be careful📉 The cryptocurrency market is forming an "order" for "Red Monday".
On the OKX:BTCUSDT chart, the "Triple Top" pattern is probably nearing completion - its recognizable feature is the more lower central top and the right “powerful shake out” (for more details, if you are interested, you can read Encyclopedia of chart patterns/Thomas Bulkowski)
🆗 So, the minimum target for this pattern is $96100 per CRYPTOCAP:BTC
❗️ Confirmation of the "Triple Top" pattern development - after the base breakout and the inability to consolidate higher on the retest.
💰 Globally, we wrote our thoughts on the possible price of #Bitcoin in May/June a week earlier 👇
Also, to make trading decisions and determine which direction to trade, you need to analyze the situation on the charts:
1️⃣ BTC.D 👇
and
2️⃣ USDT.D 👇
_____________________
Did you like our analysis? Leave a comment, like, and follow to get more
Bitcoin Not Looking Good At AllSome degree of 5 waves completed yesterday and reversal signs are there. Now, this 5 waves up could be just 1st leg of larger 5th or the 5th itself since this leg was 2.6 times of leg 1. Either way, we are heading towards 90K and if this was larger 5th that got complete then it's time for "serious worry", specially if you are a HODLer.

Bitcoin Entry & Risk Management Zones:
Entry Zone: 102,600 USDT (highlighted in orange)
Stop Loss (S/L): 101,500 USDT (red zone)
Take Profit (TP) Levels:
TP1: 103,750
TP2: 104,600
TP3: 105,500
TP4: 106,600
TP5: 108,200
------------------------------
After reaching TP1 - shift stop to entry

BTCUSD Rectangle Pattern Breakout + Bearish Retest & Target🧩 Chart Overview
This chart captures a well-defined rectangle continuation pattern forming within a rising channel on the 1-hour timeframe. This setup is a classic combination of horizontal and diagonal price structure interaction, offering valuable insights into potential market behavior and trade opportunities.
🧱 Structure Breakdown
Rectangle Pattern: Price action was trapped in a sideways consolidation phase between the resistance zone (~104,800 - 105,400) and the support zone (~101,200 - 101,800).
This rectangle followed a strong bullish rally, which often implies a continuation pattern. However, the lack of follow-through from bulls near the resistance led to repeated failures to break out, suggesting weakening momentum.
Rising Channel: Within this rectangle, price respected a rising trendline support and resistance structure, forming a parallel ascending channel.
Bearish Breakout: The significant event occurred when BTC broke down below both the horizontal support of the rectangle and the lower boundary of the rising channel, triggering a structural shift from bullish to bearish.
🔁 Retesting Phase – What’s Happening Now
After the breakdown:
Price pulled back toward the prior support zone, which is now acting as resistance (a classic example of the support-turns-resistance principle).
This is commonly referred to as a retest, which validates the breakout and offers a lower-risk entry point for traders looking to short.
The retest area (around 101,500 - 102,000) is crucial. If price fails to reclaim this level and prints bearish confirmation (e.g., rejection wick, bearish engulfing candle), it increases the probability of downward continuation.
🎯 Trade Setup (Short Bias)
Entry Zone: 101,500 – 102,000 (on retest rejection confirmation)
Stop Loss: Above 103,000 (above prior highs and invalidation point)
Target 1 (TP1): 99,347 – key psychological and horizontal support level from prior structure
Target 2 (TP2): 97,277 – measured move of the rectangle height projected downward, aligning with previous demand area
This setup offers an attractive risk-to-reward ratio, assuming proper trade management and confirmation-based entry.
📊 Additional Technical Confluences
Bearish Momentum: The aggressive breakdown candle shows strong seller interest and increased volatility.
Volume: If confirmed with high selling volume during the breakdown and low buying volume during the retest, the move gains more credibility.
Trend Reversal Signals: The break of the channel and the rectangle support indicates potential trend reversal from short-term bullish to bearish.
RSI & Momentum Indicators (optional): Traders may use tools like RSI or MACD to confirm momentum shifts during retest.
📉 Psychological and Price-Level Significance
101,500 was a strong intraday support zone throughout the consolidation phase. Once broken, it flips polarity and acts as resistance.
The round-number level of 100,000 is always a psychological magnet for BTC. It often acts as a bounce or breakout zone, so traders should watch price behavior near this area closely.
Deeper demand may emerge around 97,000 – 96,500, which can serve as an extended target or reaccumulation zone depending on broader market conditions.
⚠️ Risk Management & Final Thoughts
This setup is high-probability only if the retest confirms rejection. Avoid early entries or assumptions before confirmation.
Always use proper stop-loss placement to avoid whipsaws or fake-outs.
Manage position sizing based on account size and risk tolerance.
News events or macro data can override technicals, so be aware of upcoming economic releases or sentiment shifts.
🧵 Conclusion
Bitcoin is showing clear signs of short-term weakness following the breakdown of a long-standing consolidation range within a rising channel. The ongoing retest provides an ideal area for short positioning, with clearly defined invalidation and profit targets.
✅ If bears defend the retest zone, expect downside continuation toward 99.3K and possibly 97.2K.

Bitcoin (BTC/USDT) - Support Trendline & Zone Price Test - DailyBitcoin (BTC/USDT) price recently rejected down from $107000 on May 19th, 2025.
The yellow Support Trendline below is currently being tested ($103000 price level).
Several candle body closes below the Support Trendline could signal weakness in the daily price trend (potential rising wedge pattern).
The April inverse head-and-shoulders price pattern and targets have been completed (+12% and +24%).
note: Breaking news, government law changes, corporate announcements, and crypto crime could affect the Bitcoin price and charts.

$BTC - Lower Timeframe OutlookCRYPTOCAP:BTC | 1h
Didn't expect such a strong rejection, another push back to 107k now seems unlikely
If we get a reaction at 102k to 101.5k ( val) , we might see a complacency bounce into 104.5k–105.3k to fill some inefficiencies.
That'd be a solid short, targeting 95k–94k

Bitcoin Retests Ascending Trendline After BreakoutBTCUSD daily chart shows price action respecting a rising trendline, following a successful breakout from previous pattern. This ascending trendline now acts as a key dynamic support and serves as a central guide for the medium-term bullish structure.
Currently, price is consolidating just below the $107,000 resistance area. There are two primary scenarios to consider:
Bullish Scenario:
A confirmed breakout and daily close above the $107,000 resistance could trigger another bullish leg, targeting the next level near $120,000.
Mild Bearish / Pullback Scenario:
If the price gets rejected again, it may retrace towards the ascending trendline around $95,000, which aligns with previous horizontal support and could serve as a solid buy-the-dip zone.
Trade Plan:
Buy Entry Option 1: On a breakout above $107,000 → Target: $120,000
Buy Entry Option 2: On a bounce from the trendline near $95,000

$GOAT/USDT 1H Chart Breakout Alert!$GOAT/USDT 1H Chart Breakout Alert! 🐐
After a clean breakout from the downtrend line, price is now retesting the breakout zone + key demand area 🔥
- Entry: CMP
- Target: $0.20+
- SL: Below $0.142
Setup looks solid 👀
DYRO, NFA
