Bitcoin (BTC/USDT) – Flag Breakout Points to $114KHello guys!
Bitcoin continues to respect the bullish structure within its ascending channel, and we just got a clean breakout from a textbook bull flag.
After a solid move higher earlier this month, BTC cooled off inside a tight flag pattern, consolidating above $106K. That pullback helped reset momentum, and now we’ve broken out with conviction.
You can read about it here:
We’re currently hovering around $ 109.8 K. A short-term retest of the breakout zone near $108K–$108.5K wouldn’t be surprising. it could even offer a great entry opportunity before the next leg up.
If momentum holds, the projected target from this flag pattern lands in the $113.5K–$114K zone.
watch these:
Support: $107.5K–$108.5K
Target: $114K
Invalidation: Break below $107K
Bias remains bullish unless we lose the channel structure.
BTCUSDT

HelenP. I Bitcoin will start to decline and break trend lineHi folks today I'm prepared for you Bitcoin analytics. Observing this chart, we can see how the price dropped from support 2, which coincided with the support zone and reached the trned line. Then it turned around and started to grow, and soon reached the 83700 support level again and even broke it. Next, price some time traded near this level and after a retest, it turned around and made an impulse up, after which it turned around and then declined to the trend line, after which it rose to support 1, which coincided with one more support zone. Soon, BTC broke the 101400 level and then repeated movement when it traded near the support 2 level. Price, after trading near the 101400 level, rebounded from the trend line and rose to new ARH 112000 points and then went into correction. At the moment, I expect that BTCUSDT will start to decline, break the trend line, and continue to fall to the support zone. That's why I set my goal near this area, at the 102700 points. If you like my analytics you may support me with your like/comment ❤️

Bullish Momentum Building, $112K Breakout on the Horizon?Hey Realistic Traders!
Can BINANCE:BTCUSDT Break Past $112K and Set a New All-Time High? Let’s Break It Down...
Trend Analysis
On the H4 timeframe, BTCUSDT has consistently traded above the EMA-90 line, confirming the continuation of a bullish trend. Within this trend, a falling wedge pattern formed, which is typically considered a bullish reversal signal. This pattern was followed by a breakout marked by a bullish Marubozu candle, further strengthening the bullish outlook.
In addition, a bullish crossover appeared on the oscillator, providing additional confirmation of upward momentum. Based on these technical signals, the price is expected to continue its upward move toward the first target at 113,613, with a potential extension to the second target at 117,968.
The outlook remains valid as long as the price stays above the key stop-loss level at 105,681.
Support the channel by engaging with the content, using the rocket button, and sharing your opinions in the comments below.
Disclaimer: "Please note that this analysis is solely for educational purposes and should not be considered a recommendation to take a long or short position on Bitcoin.

Perfect Up —Mental TA, Predicting Bitcoin's price with your MindI get, I get it... You don't like it when I publish too many Bitcoin ideas.
You just don't like it when I continue to publish every single day. Since I love you and your continued support, I stopped publishing daily but I still get to publish ok? Ok!
Phew! I needed to get that stuff out of my system. All is good now thank you for reading more support and the comments about the TOP10 TOP Altcoins.
No bearish signals is a bullish signal.
Bullish signals are bullish signals.
Upgrade update improve mental programs. Bitcoin is not a mind but it was created through a mind. Everything starts first in the mind, think about it. You see? In order to conceive an idea or just to be able to grasp what I mean you have to think. Thinking happens in the mind right?
How does that sound for you?
Does it resonates with your thinking?
Makes sense?
If everything is in the mind and starts from a mind, a mind-point, then we can ask this same mind; where is Bitcoin headed next?
Information can come from three places only:
1) Your own individual conscious mind.
2) The personal unconscious.
3) The collective mind (the collective unconscious in CJung terminology).
If you mix your personal unconscious with the collective unconscious this can lead to mistakes. That's why some people get it right through intuition while others have it mixed. The problem is that information is mixed from the collective mind, your conscious mind and the personal unconscious. So you know that you know things that there is no way you can know. Sometimes you get it right and sometimes you get it wrong. The few times you get it right it is enough to confirm that the system is real and exist. When you get it wrong is because the information becomes mixed.
Lots of practice can solve this and you win.
Now that you've gained full access to your unconscious mind, ask the question, "Where is Bitcoin headed next."
Detach... Relax, do not interrupt just breathe and let the answer come in whatever way.
Practice, and based on the results you will know what's the meaning of the mental impressions you see.
Some people get it straight up. "Bitcoin is going up."
Some people get images of something positive and this needs to be interpreted. Other people hear sounds, others feelings, on and on.
» Technical analysis
The fact that Bitcoin continues rising moving up never down is as bullish as it gets. Remember, when there is a drop coming it drops, there is no in-between. When there is consolidation at resistance it means the bulls are in.
The bulls are in means the next major move is up. There can be swings short-term but ignore and bet on the bigger move. You know the next move is a rise, 100% confirmed, based on the chart, price action and candlestick, so you can always win betting on this move because it has the highest probability.
Bitcoin can't move any higher after hitting a top, think November 2021.
After hitting bottom, Bitcoin can only grow. The bottom was hit in early April.
Thanks a lot for your continued support.
Namaste.


$BTC to $120K?Bitcoin is still moving strongly inside the ascending channel, respecting both support and midline zones.
After bouncing from the lower boundary and holding above key horizontal support at $104.8K, BTC is showing signs of strength again.
With the trend intact and momentum building, a breakout toward the $116k 120k supply zone looks likely in the coming days.
Bulls remain in control as long as price holds above the mid channel and key FVG (Fair Value Gap) areas.
Watch the channel closely for confirmation.
DYRO, NFA

Bitcoin Market Update – May 26, 2025📅 Bitcoin Market Update – May 26, 2025
🚀 BTC Price: $110,157 (+2.95% 24h)
Bitcoin continues its upward trend, showing strong momentum and bullish sentiment across the market.
📊 Technical Snapshot:
• Range: $106,801 – $110,157
• Support: $107K – $108K
• Resistance: $111K – $112K
• Trend: Bullish
🔗 On-Chain Metrics:
• Short Squeeze Pressure: Rising on Binance
• ETF Inflows: $934M → Strong institutional interest
• Sentiment: Extreme Greed (Index 78)
🧭 Fundamentals:
• Major ETF inflows show growing trust from big players.
• Market sentiment remains highly optimistic.
📈 Forecasts:
• Short-Term: $110K – $112K
• Mid-Term: $112K – $125K
• Long-Term: Up to $140K (depending on macro conditions)
Keep an eye on 103k and 97k supporting levels as liquidity zones.
✅ Summary:
BTC remains bullish with key resistance at $112K.A breakout could open room for further upside. Stay tuned and manage risk wisely.
#Bitcoin #BTC #Crypto #SorooshX

Bitcoin - This time different ?In 2021-22 bitcoin formed a higher high on weekly chart and then bear run of 2022 started, if we look at the bitcoin current chart the same pattern being formed.
Do you think bitcoin will form the similar pattern ? In my opinion it is highly unlikely that bitcoin will see similar pattern, in 2022 the second push was due to overall market euphoria which pushed the price to new high even though bear market was already on (Bitcoin hit new ATH after crashing 55% which is unusual)
If we look at the current pattern bitcoin had -30% crash, which is normal between bull runs, so its highly unlikely that bitcoin will similar fate as 2021.
Follow Our TradingView Account for More Technical Analysis Updates, | Like, Share and Comment Your thoughts.
Cheers
GreenCrypto

Bitcoin : Impulse up or Flat Trap!?If you find this information inspiring/helpful, please consider a boost and follow! Any questions or comments, please leave a comment!
BTC has staged a solid move off the May 25 low — but the context matters. We’re facing two distinct, high-stakes scenarios here: one bullish, one bearish. What happens next hinges on whether the May 25 rally is the start of a new impulse or the final leg (C wave) of an expanded flat off the all-time high.
Structure Breakdown
Bearish View: We’re completing a textbook expanded flat from the ATH:
A wave started May 23
B wave pushed to a lower low.
C wave began May 25 and is likely wrapping up now
If valid, this sets the stage for a powerful Wave 3 down.
Bullish View: The May 25 low marked the end of a corrective phase:
Rally from that low is an impulsive Wave 1
A pullback to the 108k golden zone would represent Wave 2
Wave 3/C up could follow from that base
What to Watch
The area around 108,000–107,100 is a magnet. If price retraces into this zone with a corrective look and holds, bulls could be in control. But if we roll over hard from here, it supports the expanded flat thesis — and a much deeper move likely follows.
Outlook
This is a moment for sharpen focus. The chart structure is clean, but the outcome isn't binary until we see what kind of retrace (if any) forms.
Watch 108k like a hawk. If bulls defend it, there’s room to talk new highs. If we break impulsively from here, expect acceleration lower — fast.
Trade safe, trade smart, trade clarity.

$XLM is breaking out!CRYPTOCAP:XLM is breaking out! 🚀
After months inside a flag channel, CRYPTOCAP:XLM has finally broken the trendline with strength.
Now holding above $0.2880, this breakout could trigger a rally toward $0.6343, +128%.
Eyes on this move! 📈
DYRO, NFA

Bitcoin's upward movement continuesThe upward movement that Bitcoin started at $74,550 has many similarities between its waves. Considering the similarity in price and the large time between waves A-C-E-G and waves B-D-F, it is clear that a diametric or symmetrical is forming.
Considering that the post-pattern movement after the g-wave has not passed, there are two scenarios:
1- Formation of an x-wave after the diametric
2- Formation of a symmetrical
However, considering that the post-pattern movement after the g-wave has not been confirmed and the high similarity in price in all waves, my opinion is that a symmetrical is forming and we will have another upward wave. This upward wave could end at $115,500 or $123,000.
Good luck
NEoWave Chart

$FWOG/USDT Ready to Fly MEXC:FWOGUSDT has officially broken out of its long-term downtrend and flipped the key resistance zone into support.
After a clean retest of the breakout level around $0.07021, the price is showing strength again.
With bullish momentum building, this setup offers a solid potential upside, targeting the $0.52424 zone, a 643% move from here.
As long as the price holds above the green demand zone, this chart looks primed for a strong rally.
DYRO, NFA

Bitcoin to 140k - 170k (26MAY2025)On monthly timeframe we have few trendlines which show us, 140 to $170,000 is likely according to the 100% of Fibonacci Extension as well, but above that is unlikely IMO.

BTC finds support around ATHsBitcoin is potentially finding support around $107k after making new ATHs last week around $112k.
Assuming these levels as S and R, a strong break could signal the direction of price in the coming days.
If local support is lost, we can expect price to at least test $104.9k.
Assuming the bullish momentum continues, breaking resistance would signal higher prices. Still in tact, a continued bull flag breakout from $104.9k (20 May) could still put BTC at around $115k.

BITCOIN New Update (4H)This analysis is an update of the analysis you see in the "Related publications" section
In the previous analysis, we mentioned that you should avoid looking for sell/short positions, as Bitcoin's price pattern was designed to trap short positions. The price followed the direction of the previous yellow arrow as anticipated.
Currently, the major resistance zone for Bitcoin on the chart is the red area. In this zone, a complete bullish pattern could potentially form | or at the very least, one leg of a bullish pattern may be completed.
Let’s see how it plays out.
For risk management, please don't forget stop loss and capital management
Comment if you have any questions
Thank You

BTC/USD Long-Term Channel Targeting 120,721 – 136,849Bitcoin continues to trade within a well-defined ascending channel on the weekly timeframe. After a healthy corrective phase, price action is rebounding strongly off the channel’s lower boundary, aligning with the ongoing long-term bullish trend.
🔹 Wave Structure and Fibonacci Extensions:
The corrective structure suggests a completed ABC pattern, with the current move potentially initiating a new bullish impulse.
Key Fibonacci extension levels:
161.8% at 120,721
200% at 130,246
224% at 136,849
These levels correspond to the upper channel boundary, providing potential long-term upside targets.
🔹 Oscillator Confirmation:
The DTOsc indicator is rebounding from oversold territory, suggesting renewed bullish momentum.
📌 Trade Idea:
Long-term bias: Bullish, targeting upper Fibonacci levels within the channel
Invalidation: A weekly close below the channel’s lower boundary (~85,000) would challenge this scenario
This chart supports a patient, long-term bullish view for BTC/USD, with significant upside targets over the coming months.

Is It Time to Enter, or time to escape?One green candle is all it takes to trigger thousands of minds into thinking
Should I jump in now?
But is this truly a good entry point, or are you just afraid of missing the move?
Let’s break down how psychology tricks us into bad trades—and how to fight back with real chart data.
Hello✌
Spend 3 minutes ⏰ reading this educational material.
🎯 Analytical Insight on Bitcoin:
📈 Bitcoin is currently respecting a well-structured ascending channel, with price action aligning closely with a key Fibonacci retracement level and a major daily support zone—both acting as strong technical confluence. Given the strength of this setup, a potential short-term move of at least +6% seems likely, while the broader structure remains supportive of an extended bullish scenario toward the $116K target. 🚀
Now, let's dive into the educational section ,
📉 Why Do We Buy More When Markets Are High?
It’s a simple question—but the answer runs deep into our psychology. When a crypto pumps, and we’re not in it, our brain doesn’t analyze—it rationalizes:
"If I don’t buy now, I’ll miss out."
But most people who think like this enter at the top—and exit with regret .
🧠 The Psychology of FOMO and Poor Timing
In every rally, a large chunk of entries are triggered by FOMO (Fear of Missing Out).
But buying high means you're buying from those who bought lower.
And here's the trick: your brain loves the green candles—but ignores volume drops, RSI spikes, or exhaustion signals.
🛠 TradingView Tools to Spot Smart Entry Points
When it comes to entering a position, emotions are your worst advisor. Fortunately, TradingView offers powerful tools to help you act based on evidence, not instinct. Here’s how to use them:
🔹 Trend-Based Fib Extension: One of the best tools to estimate how much room a move still has. Plot it on the previous wave to identify realistic targets.
🔹 RSI (Relative Strength Index): When RSI is over 70 or under 30, you’re in emotional territory. Be careful—buying during peak RSI often means you're entering late.
🔹 MACD: Look for crossovers between lines and histogram patterns. Use it as confirmation—not a solo trigger—for entries.
🔹 Volume Profile: This hidden gem on TradingView shows you where most trading volume has occurred. Buying at volume-supported levels is way safer.
🔹 Alerts & Watchlists: Don’t glue yourself to the chart. Set alerts for your conditions and build smart watchlists to stay updated.
🔹 Replay Mode: Want to master entries without risking real capital? Use Replay Mode to test strategies and train your eyes.
If you want to replace "guessing" with "planning," these tools should be your daily companions.
🔍 5-Point Checklist Before You Hit "Buy"
Ask yourself these five questions before entering a trade:
Is the broader trend actually bullish—or is this just a short-lived bounce?
What does RSI or other indicators say about overbuying?
Are there major support/resistance zones nearby?
Is the volume confirming the move—or fading out?
Do you have a target and stop in place—or just a “need to be in”?
📊 No Plan Entry = Planned Loss
If you jump in without a clear plan, your only focus becomes: “Am I in profit yet?”
Not “Is my strategy playing out?”
And that’s the trap.
A solid entry means you have a signal, a plan, and controlled risk.
🧲 How to Avoid Getting Pulled Into Fake Rallies
Always check higher timeframes for confirmation
Don’t enter without volume agreement
Plan entries after pullbacks, not mid-hype
Think in probabilities, not dreams
🧭 Final Takeaway & Recommendation
Opportunities never end in the market.
Opportunities never end in the market.
Opportunities never end in the market.
Opportunities never end in the market.
Opportunities never end in the market.
Opportunities never end in the market.
Opportunities never end in the market.
i should write this thousand of time ☝️
But rushing in only guarantees missed ones.
Use your tools and stay calm.
The trader who plans always beats the one who panics.
always conduct your own research before making investment decisions. That being said, please take note of the disclaimer section at the bottom of each post for further details 📜✅.
Give me some energy !!
✨We invest countless hours researching opportunities and crafting valuable ideas. Your support means the world to us! If you have any questions, feel free to drop them in the comment box.
Cheers, Mad Whale. 🐋

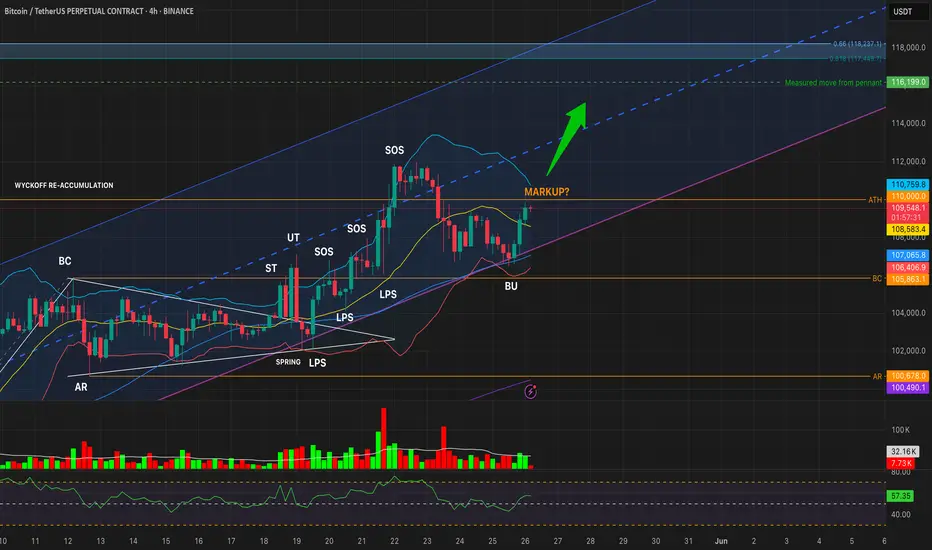
BTCUSDT – Reaccumulation Breakout or Bearish S/R Flip?Timeframes: 1W • 1D • 4H
Structure: Wyckoff Reaccumulation nearing Phase E — but ATH is acting as resistance
🔹 WEEKLY OUTLOOK: Macro Structure Points to Markup
Last weekly candle closed above the reaccumulation Buying Climax (BC), showing bullish intent
Weekly upper Bollinger Band is rising toward 113k
RSI at 67, strong but not overbought
Structure suggests we’re entering Wyckoff Phase E
Weekly Targets:
🟢 TP1: 113,049 (Upper BB)
🟢 TP2: 116,199 (measured move)
🟢 TP3: 118,237 (Fib 0.66 extension)
🔹 DAILY OUTLOOK: Still Holding Above Reaccumulation Range
Multiple daily closes above the BU (backup) zone, but all below 110k ATH
RSI is strong (~66), and price is tracking near the upper BB, but volume is not convincing
Until a daily close above 110,000, breakout remains unconfirmed
🔹 4H OUTLOOK: Structure Valid, Momentum Rising
BU zone held; price made two lower lows followed by a higher high
RSI has reclaimed 57+, and volume is picking up modestly
4H structure looks like an early Phase E breakout attempt, but...
⚠️ Caution: Is This a Bearish S/R Flip?
While the broader Wyckoff structure suggests a transition into markup, we must also consider the bearish scenario:
BTC may be failing a support/resistance flip at 110k
All timeframes have rejected at or below 110k, despite multiple attempts
If we see a lower high under 109k + 1D close below 105,863 with red volume and RSI < 45 → this becomes a confirmed bull trap
📊 TL;DR:
BTC is structurally bullish — but we are at the final test zone.
🔓 Breakout confirmed: Daily close above 110k
🔒 Failure confirmed: Close below 105,863 + red volume + RSI breakdown
Stay nimble. This is either the last shakeout before markup… or the top of the range before reversal.
#Bitcoin #BTCUSDT #Wyckoff #CryptoTrading #TechnicalAnalysis #Reaccumulation #Breakout #SupportResistance
$HYPERUSDT Breakout in Progress Eyes on Key Levels!BINANCE:HYPERUSDT is bouncing from a strong demand zone.
If support holds, the price could target $0.1823, $0.2370, or $0.3201.
Watch for a clean retest around $0.170 to confirm the move.
It looks bullish for now.
DYRO, NFA

CHESS.USDT NEW INCREASE ROUNDEAs a trader, it's important to follow the market and the unexpected trends.
CHESS/USDT shows a possibility for a new increase in the coming time frames, after the long-term breakdown.
Let's follow the data and see if this coin is able to increase as the chart shows.
interesting to follow for the coming time frames for new confirmations.
$0,10 is an important target that this coin could hit in the coming time.
If the cycle gets confirmed, this coin could go to $0,25 as a high target and $0,35 as a best target.
In trading, never expect instant results; the market goes as it needs to go.
Risk management is the key.

SUSDTAfter forming a Diametric pattern and then correcting after that, the price is now ready to move to the specified range...

Volatility Period: Up to May 29
Hello, traders.
If you "Follow", you can always get the latest information quickly.
Have a nice day today.
-------------------------------------
(BTCUSDT 1D chart)
It is showing a downward trend below the previous ATH range.
Accordingly, we need to see if it can rise to around 109588.0 and receive support.
However, since it is currently going through a period of volatility, we need to be careful about trading until May 28th.
-
If it falls further, we need to check if it can receive support near the Fibonacci ratio range of 1.902 (101784.54) ~ 2 (106178.85).
In particular, whether it can receive support near the M-Signal indicator on the 1D chart is key.
If it falls below the M-Signal indicator on the 1D chart, there is a possibility that it will touch the M-Signal indicator on the 1W chart, so we need to think about a response plan for this.
Therefore, if it shows support near the M-Signal indicator on the 1D chart, there is a possibility that it will show a pull back pattern.
The HA-High indicator of the 1D chart is formed at 102302.08, so it is important to see if there is support around this point.
-
The OBV indicator shows that OBV is falling below the High Line, and the StochRSI indicator is also showing that it has switched to a state of K < D.
Therefore, it is necessary to check whether OBV can touch the previous High Line or OBV EMA and rise.
If it falls below that, it is highly likely to lead to further decline.
I compared the previous OBV movements, that is, A, B, C, and the current movement, and the difference can be distinguished by whether it fell below the previous candle or not.
You can see that there is a difference from the previous movement because it is highly likely to close below the previous candle.
Therefore, the point to watch is whether it falls below 102302.08 after the volatility period or rises above 109588.0-110787.38.
If it falls below 102302.08 and receives resistance, it will turn into a short-term downtrend, and if it rises above 109588.0-110797.38, it is likely that the uptrend will resume, so it is a meaningful section.
-
Thank you for reading to the end.
I hope you have a successful trade.
--------------------------------------------------
- This is an explanation of the big picture.
(3-year bull market, 1-year bear market pattern)
I will explain more details when the bear market starts.
------------------------------------------------------

2 year Bitcoin roadmapThis is the way.
In time, you will understand the power of simple lines and the cyclical nature of markets across time. It all repeats, whether it is algorithms or human action; 80% of things follow patterns.
Randomness and outliers are always a minority.
