3 Deadly Trading Mistakes Every Trader Must Avoid NowDid you know that over 70% of trading decisions are influenced by unconscious emotions?
Fear of missing out (FOMO), greed, and external noise can easily steer traders away from rational decision-making. In this analysis, we explore the three most destructive psychological traps in trading—and how to effectively manage them.
Hello✌
Spend 3 minutes ⏰ reading this educational material. The main points are summarized in 3 clear lines at the end
🎯 Analytical Insight on Bitcoin: A Personal Perspective:
Bitcoin has recently established multiple daily resistance levels and has now executed a strong breakout above its long-standing descending channel. This move is backed by a significant increase in buying volume, signaling renewed bullish momentum. From a short-term perspective, I anticipate at least a 6% upside, with a target around the $110,000 zone. 📊🚀
Now , let's dive into the educational section,
1. Fear of Missing Out (FOMO): A Dangerous Impulse
FOMO can easily lead traders to make hasty decisions based on market hype or emotional reactions, rather than solid analysis. This often results in entering trades at the wrong time, chasing price movements, and ultimately suffering losses. 😟
How to Avoid It:
To manage FOMO, establish a well-defined trading strategy. Stick to your plan and avoid reacting to every market move. Focus on your predefined entry points, and resist the urge to "catch up" with the market. 📊
2. Greed and Its Impact on Decision-Making
Greed can cloud a trader's judgment, leading them to hold on to losing positions with the hope that prices will reverse. Alternatively, greed may push traders to enter positions at overextended price levels, anticipating further gains. This often results in greater losses or missed opportunities. 💸
How to Overcome It:
A clear risk management plan is essential. Set stop-loss and take-profit levels before entering any trade. By adhering to these boundaries, you can reduce emotional decision-making and improve the consistency of your trading approach. 📉
3. The Influence of Social Media on Trading Decisions
In today’s digital age, social media platforms are filled with opinions, rumors, and market hype that can lead traders astray. Often, unverified information or exaggerated claims can prompt traders to make impulsive decisions that don’t align with their strategies. 📱
How to Counteract It:
To combat the impact of social media, rely on credible sources of information. Always perform your own analysis and make decisions based on reliable data, not speculative posts. Surround yourself with professionals and resources that help you stay objective. 📚
Using TradingView Tools to Control Emotional Biases
One of the most effective ways to keep your emotions in check is to rely on objective technical indicators. Tools like RSI, MACD, and Bollinger Bands on TradingView can help you identify entry and exit points that align with your strategy rather than reacting to emotion. 📈
By incorporating trendlines, support/resistance levels, and alerts, you can stay disciplined and make decisions that are grounded in technical analysis. These tools guide you in staying on track, even when emotions run high.
The Vital Role of a Trading Plan
A well-structured trading plan is your shield against emotional trading. It provides clear guidelines on when to enter and exit trades, how much risk to take, and sets your financial goals. Without a plan, it’s easy to fall into the trap of impulsive decisions driven by fear or greed. 📝
How to Create One:
Define your strategy, risk management rules, and long-term objectives. A solid trading plan helps you stay focused, prioritize your financial goals, and avoid emotional disruptions. Sticking to it is crucial for sustainable success in the markets.
Conclusion : Mastering Trading Psychology for Long-Term Success
Psychological discipline is just as important as technical skills when it comes to successful trading. By understanding the emotional pitfalls that can cloud your judgment, you can make more rational, data-driven decisions. 📊
Using tools, sticking to your plan, and consistently managing your emotions are key to overcoming psychological barriers. With the right mindset and strategy, you’ll be better positioned to achieve your trading goals and build long-term success. 🚀
However , this analysis should be seen as a personal viewpoint, not as financial advice ⚠️. The crypto market carries high risks 📉, so always conduct your own research before making investment decisions. That being said, please take note of the disclaimer section at the bottom of each post for further details 📜✅.
🧨 Our team's main opinion is: 🧨
Over 70% of trading decisions are influenced by unconscious emotions, with FOMO, greed, and social media noise being major psychological pitfalls. These emotional biases can lead to impulsive decisions, resulting in losses. To avoid this, create a solid trading plan, use reliable tools like RSI, MACD, and Bollinger Bands, and stay disciplined with stop-loss and take-profit levels. 📉
Give me some energy !!
✨We invest countless hours researching opportunities and crafting valuable ideas. Your support means the world to us! If you have any questions, feel free to drop them in the comment box.
Cheers, Mad Whale. 🐋
BTCUSDT

BTC/USDTbtc is up 42% since the 74k bottom. after every pump,we have seen a 4% dip so im expecting another one here.

Hellena | BITCOIN (4H): LONG to resistance area of 101,000.Dear colleagues, in the coming week I expect price to continue rising in wave “5”. I think that wave “3” is already completed and now we are witnessing a small correction.
Reaching the resistance area of 101,000 will be the end of the big “ABC” correction.
The 91,601 area could be a good support area to complete the correction.
Manage your capital correctly and competently! Only enter trades based on reliable patterns!

BTCUSDTHello traders.
The first trade of the week will be from BTCUSDT.
The pair drew a lot of attention over the weekend with strong bullish momentum. Some analysts are even suggesting it could rise to 106,000 USD during the week.
However, the crypto market is currently very volatile. Despite that, I'm activating a trade based on my system.
🔍 Criteria:
✔️ Timeframe: 15M
✔️ Risk-to-Reward Ratio: 1:2
✔️ Trade Direction: Buy
✔️ Entry Price: 104000.00
✔️ Take Profit: 104596.14
✔️ Stop Loss: 103702.15
🔔 Disclaimer: This is not financial advice. It's a trade I’m taking based on my own system, shared purely for educational purposes.
📌 If you're also interested in systematic and data-driven trading strategies:
💡 Don’t forget to follow the page and subscribe to stay updated on future analyses.

BTCUSDTHello everyone. Wishing you all a great weekend!
Just because the FX market is closed today doesn't mean we should stay away from trading in the crypto markets.
That’s why I’ve activated a Buy trade on BTCUSDT and wanted to share it with you as well:
🔍 Criteria:
✔️ Timeframe: 15M
✔️ Risk-to-Reward Ratio: 1:1.50
✔️ Trade Direction: Buy
✔️ Entry Price: 103974.98
✔️ Take Profit: 104442.64
✔️ Stop Loss: 103662.77
🔔 Disclaimer: This is not financial advice. It's a trade I’m taking based on my own system, shared purely for educational purposes.
📌 If you're also interested in systematic and data-driven trading strategies:
💡 Don’t forget to follow the page and subscribe to stay updated on future analyses.

BTC - Ready for a breakout?Hey traders and investors!
On the 10-day chart, an intriguing situation is unfolding.
Sellers tested the Key Candle of the previous accumulation breakout — level 89,256, and the buyer’s initiative resumed.
Then, a manipulation (false breakout) occurred at the 89,256 test level. Volumes reveal the narrative: sellers sold off at high volumes, while buyers absorbed on declining volumes.
Now, a buyer zone has formed below, with the upper boundary at 99,475.
Just a few steps away from the ATH. A pullback is always possible, but for now, there are no signs of weakness (even a pullback to 89,256 wouldn't disrupt the bullish structure).
Now, the main question:
💡 How far up? +30,000?
This analysis is based on the Initiative Analysis concept (IA).
Wishing you profitable trades!

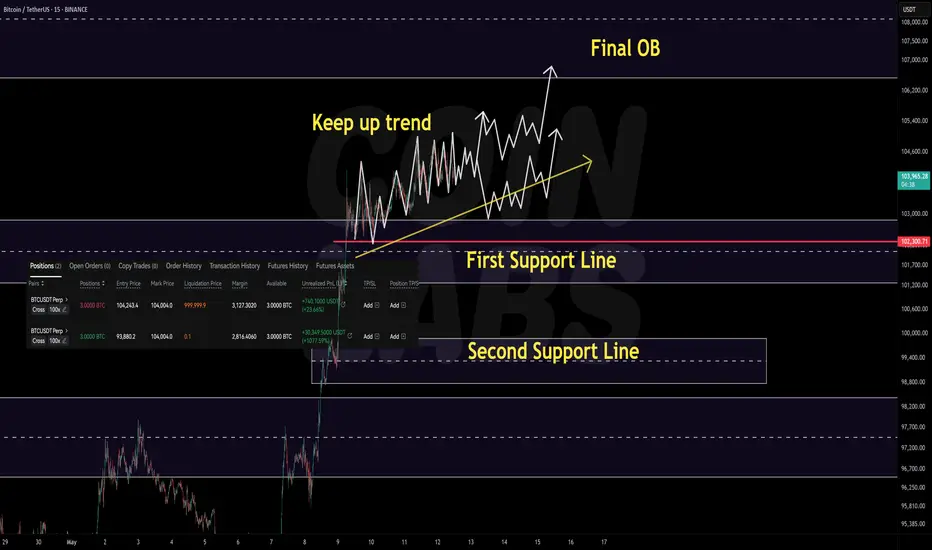
+$30K Unrealized | Still Long, Is ATH Next?Even after the strong rally that pushed Bitcoin past the 100K level, the price continues to hold critical support zones without breaking recent lows. We're seeing a steady, stair-step climb ("grinding higher")—absorbing previous supply through sideways consolidation while still making higher highs.
After forming a local high near 105,000, we’ve seen some pullback—but so far, there’s been no breakdown of major support, especially on lower timeframes. The structure still favors continuation to the upside, and the broader uptrend from the 74K–83K zone remains intact.
That said, we haven’t seen any major correction yet. With the market now testing the final supply zone before all-time highs, failure to break out could trigger a wave of profit-taking. This could lead to short-term selling from traders who bought lower, anticipating new highs.
We're now in a zone where volatility can spike in both directions, making it a tough area for clean entries. Long positions may feel risky due to the high level, and shorting too early might get squeezed out by another high. But this environment also presents great short-term opportunities—as long as you're quick and manage risk tightly.
If the current bounce fails to break above 105K, it may signal a larger corrective move. The first support zone to watch is 103K, followed by 99K. Even if price pulls back to these levels, the overall trend may still be valid—these are key zones where the uptrend could resume.
At this point, we must observe whether this bounce leads to further continuation or becomes a “trap” before a larger move down. If price holds the previous supply zones as support, we could see another leg up. If not, a deeper retracement may unfold.
This is also a zone where many traders may FOMO in, expecting an immediate breakout, only to get caught in a fakeout or shakeout. Personally, I think the market is more likely to test this final supply zone with increased volatility and a deeper correction before making a real move to new all-time highs. Risk management is crucial here.
We’ve had a strong rally with no significant retracements, and while the uptrend may continue, failure to break out soon—or if profit-taking kicks in—could lead to meaningful corrections. Be prepared.
To summarize, we are in a very important decision zone:
Will price continue holding the lows and grind higher to new ATHs,
or will it reject from supply and trigger a larger retracement?
Whatever happens next, don't rush into a position out of fear of missing out.
Wait for structure, wait for confirmation, and remember: entering one step later at a better level is far better than entering too soon and getting stopped out.
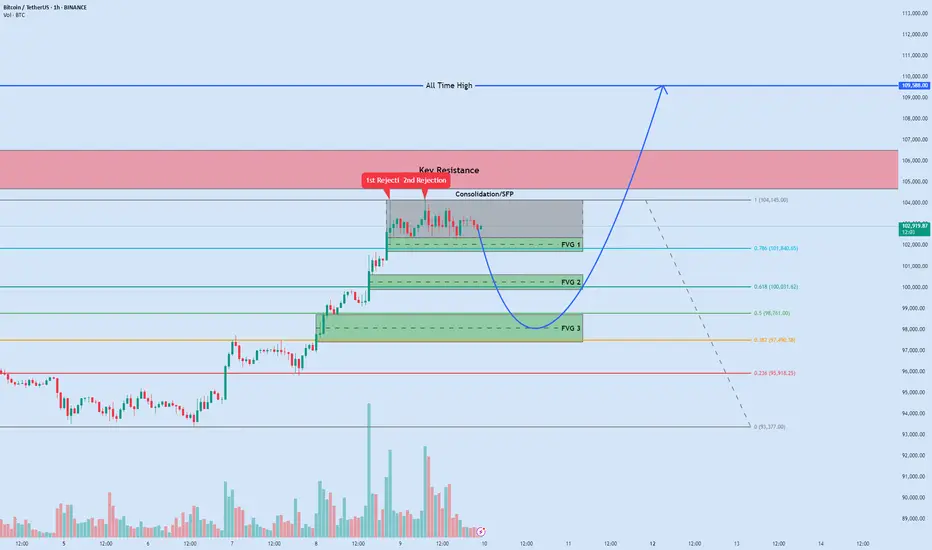
BTC: Potential Dip into FVGs Before New ATHBitcoin has rocketed from ~$94 000 to ~$103 250 in just days and is now consolidating between $102 364–$104 145. A Swing Failure Pattern at the top suggests a corrective pullback into one of three Fair Value Gaps aligned with key Fibonacci retracements, before the next leg up toward a fresh all-time high. This setup uses structure, inefficiency zones, and Fib levels to pinpoint high-probability entries.
📊 Chart Breakdown
1. Current Picture: Consolidation & Warning ⚠️
- Range: $102 364 – $104 145
- Swing Failure Pattern (SFP): Price briefly wicks above $104 145 to grab liquidity, then reverses. This classic liquidity hunt often precedes a deeper retrace as late bulls are stopped out.
2. Fair Value Gaps (FVGs) – Untested Support Zones 🌊
FVGs are rapid imbalance areas where price left gaps in the order book. These zones act like magnets, drawing price back to “fill” inefficiencies.
FVG 1 (Nearest): $101 700 – $102 364
FVG 2 (Mid-Zone): $99 900 – $100 600
FVG 3 (Deepest): $97 400 – $98 700
3. Fibonacci Confluences (from $93 377 → $104 145) 📏
Fibonacci retracement levels often align with FVGs to form confluence support—ideal for swing entries.
0.786 Fib @ $101 840.65: Sits squarely in FVG 1, a high-probability bounce zone.
0.618 Fib @ $100 031.62: Golden Ratio within FVG 2, offering strong support.
0.5 Fib @ $98 761 & 0.382 Fib @ $97 490.38: Cover top and mid-lower FVG 3 for a deep corrective entry.
📈📉 Navigating the Next Moves: Key Trade Scenarios 🧭
Given the current structure, with the SFP indicating a potential short-term top and strong FVG/Fibonacci confluences below, here are two primary scenarios we can watch for:
Scenario 1: The Short-Term Pullback Play (Short Position 📉🐻)
Concept: Capitalizing on the SFP at the consolidation high (~$104,145) to trade the anticipated dip towards the FVG/Fibonacci support clusters.
Aggressive Entry: Look for entries around $103,500 – $103,900 if price retests the upper part of the consolidation after the SFP, showing weakness.
Conservative Entry: A break below the consolidation low (~$102,364) could offer a confirmation entry, potentially on a retest of this broken level as resistance.
Stop-Loss 🛑: Place above the SFP high, e.g., $104,450 – $104,650, to protect against a false breakdown.
Profit Targets (FVG Zones) 🎯
TP1: The top of FVG 1 / 0.786 Fib area (~$102,300 – $101,840). This zone is critical.
TP2: The FVG 2 / 0.618 Fib area (~$100,600 – $100,030) if TP1 is breached with momentum.
Trade Management & Considerations 🤔:
Entry Confirmation: Watch for bearish price action on lower timeframes (e.g., 15m/1H rejection wicks, bearish engulfing) near the SFP high.
Profit Taking: Consider taking partial profits at TP1. The reaction here is crucial.
Reversal/Close Short: If price enters TP1 and shows strong bullish rejection (large wicks, engulfing bull candles, volume spike), close the short and prepare to flip to the long scenario.
Holding for TP2: If price slices through TP1 with sustained bearish pressure, trail your stop above TP1 once it’s clearly broken.
Invalidation: If price reclaims and holds above $104,650, the short thesis is invalidated.
Scenario 2: The FVG Rebound & Rally (Long Position 📈🐂)
Concept: Entering on the expectation that one of the FVG/Fibonacci confluence zones will hold as support, leading to a rebound and continuation of the larger uptrend.
Potential Entry Zones 📍:
Zone A (Primary): FVG 1 / 0.786 Fib area ($101,700 – $102,364, sweet spot ~$101,840).
Zone B (Secondary): FVG 2 / 0.618 Fib area ($99,900 – $100,600, sweet spot ~$100,030).
Stop-Loss 🛑:
If entering in Zone A: Place below FVG 1, e.g., $101,350 – $101,150.
If entering in Zone B: Place below FVG 2, e.g., $99,600 – $99,400.
Profit Targets 🎯:
TP1: Back to the consolidation high / SFP area (~$104,145).
TP2: The key resistance zone ($104,675 – $106,500).
TP3 (Ultimate): The All-Time High ($109,588).
Trade Management & Considerations 🤔:
Entry Confirmation: Do not blindly enter. Wait for price to enter your chosen FVG zone AND then show clear bullish confirmation on lower timeframes (e.g., 1H/4H bullish engulfing, hammer, RSI divergence).
Zone Prioritization: Zone A is the first test. If it fails and breaks down, Zone B becomes the next area of interest.
Profit Taking & Scaling Out: Take partial profits at TP1 and again at TP2 to secure gains.
Risk Reduction: After TP1 is hit, move your stop-loss to breakeven or slightly in profit.
Invalidation: A decisive break below $99,400 invalidates the bounce thesis and suggests a deeper correction.
🎯 Execution Notes
- Patience & Confirmation: Avoid “blind” entries. Seek volume confirmation and clear reversal candle patterns on 1H/4H charts.
- Risk Management: Define stops before entry and size positions to risk no more than 1–2% per trade.
- Additional Signals: Watch for bullish RSI/RSI-MFI divergences or a turn in on-balance volume at support zones.
Disclaimer: This is for educational/informational purposes only and not financial advice. Crypto trading carries high risk—always DYOR and consult a qualified advisor.
What’s your take? Which FVG/Fib level will hold? Share your insights below!
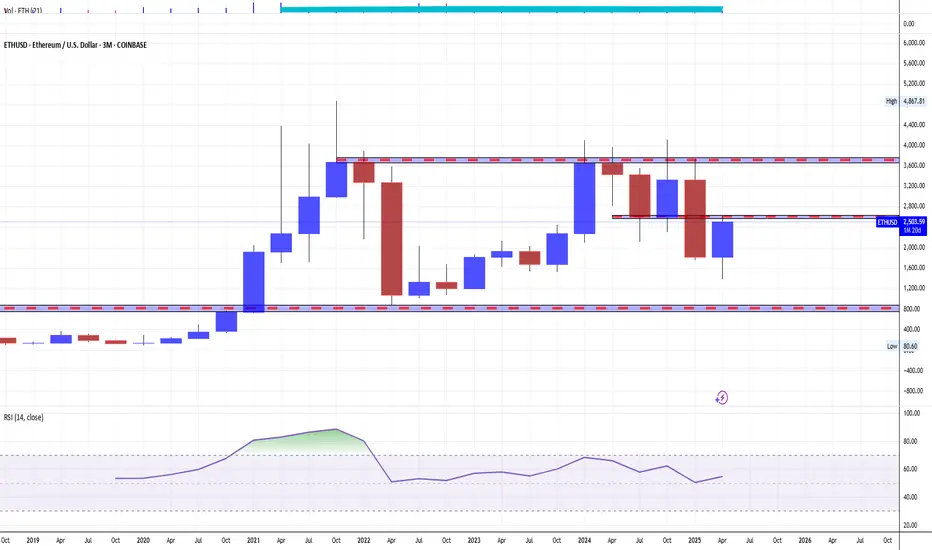
Crypto Markets: “Sell in May, and Go Away” — What Does It MeanThe historical pattern known as the “Sell in May, and Go Away” seasonal divergence was popularized by the Stock Trader’s Almanac, which stated that investing in stocks represented by the Dow Jones Industrial Average from November to April and switching to fixed income for the other six months “has delivered reliable returns with reduced risk since 1950.”
What is “Sell in May, and Go Away”?
“Sell in May, and Go Away” is a well-known saying in finance. It is based on the historical underperformance of stocks over the six-month period from May to October.
According to Fidelity Investments, the divergence has been most pronounced in recent years, with the S&P 500 (SPX) gaining an average of about 2% from May to October from 1990 onwards over the next 30 years, compared with an average of about 7% from November to April.
The Halloween Indicator, 'Sell in May and Go Away': Everywhere and All the Time*, a research paper examining stock markets outside the US, found the same pattern, calling the seasonal divergence trend "surprisingly resilient."
Key Takeaways
👉 "Sell in May and go away" is a saying that refers to the historically weaker performance of financial markets from May to October compared to the other half of the year.
👉 Investors can try to capitalize on this pattern by switching to less risky assets from May to October, based on historical data.
Seasonality in investment flows may persist as a result of year-end bonuses from the financial industry and businesses, perhaps helped by the mid-April deadline for filing U.S. income tax returns.
Whatever the underlying fundamentals, the historical pattern was made more pronounced by the October stock market crashes of 1987 and 2008.
Final Points
👉 The problem with historical patterns is that they do not reliably predict the future. This is especially true for well-known historical patterns. If enough people became convinced that the “Sell in May and Walk Away” pattern would persist, it would essentially begin to disappear immediately. All the early sellers would try to sell in April and bid against each other to buy back the assets before everyone else in October.
👉 At the same time, certain considerations regarding the development of geopolitical events in the period from May to October 2025 reasonably give reason to think about the prospects of such a scenario for the next 6 months.
* The Halloween Indicator, 'Sell in May and Go Away': Everywhere and All the Time
>> Ben Jacobsen Tilburg University - TIAS School for Business and Society; Massey University
>> Cherry Yi Zhang. Nottingham University Business School China; Massey University - School of Economics and Finance.
--
Best wishes,
@PandorraResearch Team 😎
BTCUSDT - High placed ? What's next ??#BTCUSDT - Market placed a very reasonable high so far.and doing to mature his selling turn
Keep close and if market tholda his current high region them we can expect a drop from here.
Region is around 104300 to 105100
Don't be lazy here n try to understand the market current pattern.
Good luck
Trade wisely

BTC New Update (12H)The upward wave appears to be a complex correction. Price may retrace downward either from this area or from the red box, and then we could see another strong bullish move from Bitcoin starting from the green zone.
It doesn’t matter where the rejection occurs | what matters is the green Rebuy zone marked on the chart.
In the green zone, we are looking for buy/long positions.
A daily candle closing below the invalidation level will invalidate this analysis.
For risk management, please don't forget stop loss and capital management
When we reach the first target, save some profit and then change the stop to entry
Comment if you have any questions
Thank You

TOTAL market cap chart: turning bullish this monthGM gents, it seems the TOTAL crypto market cap chart is resuming the bullish trend that started in October 2023, after the bear market that started in late 2021 ended.
Sentiment is pessimistic, has shifted from capitulation to fading rallies to generalized wall of worry despite very positive technical developments.
Most people on CT expect the 'cycles' they now believe in to play out in the same predictable manner, all correlations and timing for moves and rotations to match, that obviously won't happen and hasn't happened since the market bottomed, and I expect it to continue to make people end up getting wrong footed (like selling too early cause now they say this is the last leg up due to alt szn).
People think we are in a late 2021 redux when in reality we had a COVID crash grade capitulation which can't really precede a top, but rather indicate we saw a bear market bottom long term. Trade is getting resolved, risks from mon pol as well, rate cuts coming soon and no on is positioned.
Don't miss out my friends.
Best of luck!
Cheers,
Ivan Labrie.

BITCOIN - Price can correct to support line of rising channelHi guys, this is my overview for BTCUSDT, feel free to check it and write your feedback in comments👊
Some days ago, the price entered a triangle, where it dropped to the support line, after which it rose briefly to the resistance line.
Then, price exited from the triangle pattern and made a retest at once, after which it corrected $81500 level.
Next, price some time traded near this level and later fell below, but soon turned around and started to grow inside a rising channel.
In channel BTC broke the $81500 level and later rose to the $93000 level, which broke soon too, and then made a retest.
Later price bounced and continued to grow, and now it trades near the resistance line of a rising channel.
Possibly, BTC can grow a little more and then make a correction movement to $99000
If this post is useful to you, you can support me with like/boost and advice in comments❤️

Chart is speaking itself...For months, I've been saying Bitcoin is bullish, and few believed it. I hope you made good profits. Get ready, Bitcoin will hit $300K soon.
PREVIOUS ANALYSIS
Stay Awesome , CobraVanguard

Do you think I'm joking ???I might be wrong and this might never happen, but it might come true From a technical perspective!!!
REMEMBER
Give me some energy !!
✨We spend hours finding potential opportunities and writing useful ideas, we would be happy if you support us.
Best regards CobraVanguard.💚
_ _ _ _ __ _ _ _ _ _ _ _ _ _ _ _ _ _ _ _ _ _ _ _ _ _ _ _ _ _ _ _
✅Thank you, and for more ideas, hit ❤️Like❤️ and 🌟Follow🌟!
⚠️Things can change...
The markets are always changing and even with all these signals, the market changes tend to be strong and fast!!

GOLD - The Timeless Standard Bitcoin Can Only Dream Of ✨💰
1/ Bitcoin’s Aspirations vs. Gold’s Reality
Bitcoin proclaims to be “digital gold” , promising decentralization and stability. But the truth is clear: while Bitcoin is shaken by extreme wealth concentration and constant media hype, gold has built a centuries-long reputation for trust and enduring value. 🔥🏆
2/ The Digital Gold Revolution
Gold isn’t a relic—it's evolved! 🚀 Today, through blockchain tokenization, you can own digital gold that’s 100% backed by physical gold safely stored in vaults. 🏦🔐 This fusion of ancient value and modern tech shows that gold means business, while Bitcoin just tries to copy its legacy.
3/ Concentration vs. Distribution
Check this out: over 90% of Bitcoin is hoarded by a few whales 🐋, leaving everyday holders with crumbs. In contrast, gold’s market has naturally spread out over centuries of global trade. 🌍📈 This organic distribution reinforces stability and genuine market confidence.
4/ Liquidity, Custody & Security
🔹 Gold Is Easy to Custody
Gold is already stored securely in banks and reputable vaults all over the world, and its ownership transfers digitally. You can withdraw or trade anytime without relying on untrustworthy crypto exchanges or wallets vulnerable to hacks . 🔓💼 Meanwhile, Bitcoin’s security is often subject to risks and platform issues.
5/ Real-World Utility vs. Speculative Hype
Gold isn’t just an asset—it’s a workhorse! ⚙️ From use in electronics to medicine and aerospace, gold’s real-world applications generate organic demand. No aggressive, 24/7 hype machine is needed here. In contrast, Bitcoin runs on media-fueled life support, with bots and influencers relentlessly (and tediously) pushing its narrative . 😴📢
6/ Stability You Can Count On
Gold has weathered economic storms with calm resilience 🌪️➡️☀️, proving itself as the ultimate safe haven. Bitcoin, however, is notorious for its wild 80%+ price crashes, making it a volatile bet for long-term wealth preservation. 🏛️💚
7/ Finite Supply: Strength or Vulnerability?
Bitcoin’s fixed supply is often touted as a key advantage. Yet this scarcity makes it vulnerable to manipulation by a few major holders. 😬 Gold, on the other hand, sees a natural and gradual expansion through mining, ensuring a balanced, organic market flow. ⚖️🌿
8/ Institutional Adoption: Not the Magic Fix
State and corporate Bitcoin deals are usually quiet, behind-the-scenes OTC transactions that rarely impact open market prices. 🤫 Gold’s widespread institutional acceptance is built on centuries of trust and real-world use—no constant screaming into the void required. 📣🚫
9/ Gold: No Need for Hype, Just Legacy
Gold stands proudly without the constant need for promotion. 🌟 Its legacy of stability, digital adaptability, and secure custody speaks volumes. Bitcoin, burdened by relentless crypto spam and hype, can only watch from the sidelines. 🎭🗣️
10/ Invest in Timeless Security
When it comes to long-term wealth preservation, gold is your steadfast asset. It offers proven security, with both digital tokenization and secure physical storage, ensuring smooth withdrawals and trades every step of the way. 🏦🔐 Bitcoin, by contrast, survives on a steady diet of media noise and desperate promotions. 🚑🤖
Gold remains the reliable, time-tested choice in today’s fast-paced world of trends and fleeting hype. Whether you’re safeguarding your wealth or seeking an asset that seamlessly bridges digital innovation with physical security, gold’s enduring legacy is the real deal. 🌟💎
If you’d like to explore how tokenized gold is revolutionizing traditional finance or uncover more about its industrial applications and secure custody mechanisms, there’s always another layer of brilliance waiting to be discovered. 🚀🔍
TVC:GOLD TVC:SILVER INDEX:BTCUSD NASDAQ:MSTR NASDAQ:MARA NASDAQ:COIN CRYPTO:BTCUSD CRYPTOCAP:BTC.D

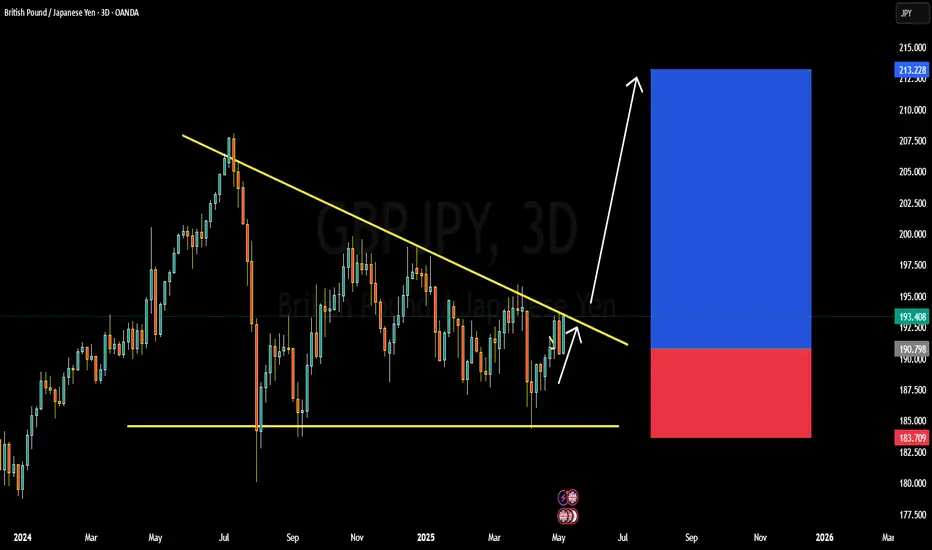
GBPJPY BULLISH OR BEARISH DETAILED ANALYSISGBPJPY is currently trading near 190.80 and is forming a significant breakout structure on the 3-day chart. After months of consolidation under a descending trendline, the pair is now coiling tightly, signaling a potential bullish breakout. The pair has respected the lower support range near 183.70 while pushing up against descending resistance multiple times. This squeeze pattern often precedes a major directional move, and with bullish momentum building, GBPJPY could be primed for a rally toward the 210.00 zone.
Fundamentally, the British pound is finding strong support from the latest hawkish commentary by the Bank of England, which has hinted that inflation remains sticky, keeping rate cut expectations delayed. On the other hand, the Japanese yen remains under consistent pressure due to the Bank of Japan's ultra-dovish stance and yield curve control policies. The BoJ’s reluctance to shift its policy outlook, coupled with soft macro data from Japan, is weakening the yen across the board.
Technically, a breakout and close above the descending trendline around 194.00 will be a key confirmation point. If this happens, bulls could dominate and push GBPJPY toward the 210.00 resistance zone in the medium term. The R\:R on this setup remains favorable with stops safely tucked below 183.70, giving this trade strong upside potential.
This pair is currently one of my top watchlist setups for May as both the technical and fundamental landscapes align. With bullish sentiment driving GBP strength and JPY weakness being a prevailing macro theme, GBPJPY could deliver a powerful upside continuation if the breakout confirms.
BTC/USDT Crypto Heist - Bullish Breakout Blueprint!🔥 Thief Trading Style: BTC/USDT Bullish Heist Plan 🔥
Greetings, Money Makers & Market Robbers! 🤑
Ready to execute a daring heist in the Bitcoin vs. Tether (BTC/USDT) crypto market? 📈 Our Thief Trading Style combines technical precision and fundamental insights to target a bullish breakout. Follow this charted strategy to ride the wave and exit before the risky Red Zone. Let’s grab those profits together! 💪🎯
---
📊 Trade Setup: The Heist Plan
- Market: BTC/USDT (Crypto) 🌐
- Bias: Bullish Breakout 🌟
- Timeframe: 1D (Swing Trade) ⏰
Entry 📈:
- Breakout Entry: Wait for a clean breakout above the Moving Average (MA) at 108000. Place Buy Stop orders just above 108000 to seize the momentum. 🚀
- Pullback Entry: For lower-risk entries, set Buy Limit orders at the recent 15M/30M swing low (e.g., 105000-106000) to catch pullbacks. 📍
- Trader Tip: Set a TradingView alert for the 108000 breakout to stay ahead of the move! 🔔
Stop Loss 🛑:
- Breakout Traders: After the breakout confirms, place your Stop Loss below the recent 1D swing low at 96000 to guard against reversals. ⚠️
- Pullback Traders: Tailor your Stop Loss to your risk appetite (e.g., 1-2% of account). Adjust based on lot size and multiple orders. 📏
- Risk Alert: This heist is high-stakes! Stick to disciplined position sizing to protect your capital.🔥
Target 🎯:
- Aim for 122000, near the risky Red Zone (an overbought area prone to consolidation or reversal). 🏴☠️
- Exit Strategy: Consider taking profits early if bearish signals (e.g., high volume, reversal candles) emerge near 122000. 💸
Scalpers 👀:
- Stick to Long-side scalps with tight trailing stops. Join swing traders for the full heist or scalp quick moves if your capital allows. 💰
---
📡 Why This Heist Has Potential
BTC/USDT is in a neutral trend with strong bullish prospects, driven by:
- Technicals: A breakout above the 108000 MA, backed by higher lows on the 1D chart, signals robust momentum. 📊
- Fundamentals: Institutional buying and positive crypto sentiment (check COT reports) fuel upside potential. 📰
- Seasonal Trends: Bitcoin often rallies in Q2, aligning with our setup. 📅
- Intermarket Factors: USD weakness and altcoin strength could lift BTC higher. 🌎
---
⚠️ Risk Management: Secure Your Gains
- News Caution: Skip new trades during major news events (e.g., CPI, FOMC) to avoid volatility spikes. 🗞️
- Trailing Stops: Use trailing Stop Loss to lock in profits as price nears 122000. 🔒
- Position Sizing: Limit risk to 1-2% of your account per trade for a safe heist. 🚨
---
💥 Power Up the Heist! 💥
Join our Thief Trading Style crew by liking, commenting, and following for more high-energy trade plans! 🚀 Your support strengthens our market raids, helping us profit with precision. Let’s conquer BTC/USDT together! 🤝🏆🎉
Stay Sharp: Another heist plan is on the horizon. Keep your charts locked and loaded, traders! 🐱👤😎
#BTCUSDT #Bitcoin #Crypto #Bullish #SwingTrading #Breakout

Bitcoin Breaks Wedge! Correction Coming Before Next Leg? After Trump said in the press conference, " Better go out and buy stocks now ." The SPX500 index started pumping , and as I said in the ideas of the last few days, Bitcoin ( BINANCE:BTCUSDT )'s correlation with this index has increased. Bitcoin also started pumping.
Yesterday's Bitcoin pump succeeded in failing the Ascending Broadening Wedge Pattern , generally, if the reversal pattern fails, it will play a continuation role .
Bitcoin is moving between the Support zone($100,270-$97,700) and the Resistance zone($109,588-$105,865) . The question is whether Bitcoin will touch the Support zone($100,270-$97,700) again and move towards the Resistance zone($109,588-$105,865) or will it continue its upward trend.
In terms of Elliott Wave theory , it seems that Bitcoin has completed microwave 3 of the main wave 5 . We can expect an even Time Correction on Saturday and Sunday when trading volume is low . There is also a possibility that microwave 4 of the main wave 5 in Cumulative Long Liquidation Leverage($101,838-$101,432) will be completed.
One of the reasons I think we should wait for a correction is the USDT.D% ( CRYPTOCAP:USDT.D ) chart, which we used as a guide in previous ideas .
USDT.D% has reached Monthly Support(1) and a Heavy Support zone(4.73%-4.50%) , which I believe is unlikely to be broken within in first attack , and I expect an increase to the Fibonacci lines on the chart.
I expect Bitcoin to start rising again after a correction .
Cumulative Short Liquidation Leverage: $105,114-$104,100
Note: If Bitcoin touches $97,500, we should expect further declines.
Please respect each other's ideas and express them politely if you agree or disagree.
Bitcoin Analyze (BTCUSDT), 2-hour time frame.
Be sure to follow the updated ideas.
Do not forget to put a Stop loss for your positions (For every position you want to open).
Please follow your strategy and updates; this is just my Idea, and I will gladly see your ideas in this post.
Please do not forget the ✅' like'✅ button 🙏😊 & Share it with your friends; thanks, and Trade safe.

BTC/USD) Resistance level pullback Read The ChaptianSMC Trading point update
Technical analysis of Bitcoin (BTCUSDT), highlighting key levels and potential price movements based on trend channels, support/resistance, and RSI. Here's the breakdown:
---
Key Elements in the Analysis:
1. Trend Channel:
BTC is trading within an ascending channel, indicating an ongoing bullish trend.
The recent price action hit the upper boundary (resistance) of the channel, suggesting potential for a pullback.
2. Resistance Zone:
105,586.06 is marked as a resistance level, where price faced rejection.
Strong reaction here suggests sellers are defending this area.
3. Support Zone:
A new support level is established around 98,000.
This zone aligns with the lower boundary of the ascending channel and previous breakout structure.
4. Target Point (Bearish Projection):
The chart projects a potential drop to the 97,367.51 level, representing a ~7.4% correction.
This move mirrors the prior leg up, applying a measured move concept.
5. RSI Indicator:
RSI is around 66–71, indicating overbought conditions.
A bearish divergence or trendline break on RSI suggests weakening momentum.
Mr SMC Trading point
---
Summary of Trading Idea:
Bias: Short-term Bearish (correction within an overall bullish trend)
Expected Move: Potential dip toward 97,367.51 support
Confirmation: Rejection at resistance, RSI divergence, and trendline break
Invalidation: A strong breakout above 105,586.06 would nullify the correction setup and favor continued bullish movement
pelas support boost 🚀 analysis follow)


BTCUSDTHello Traders! 👋
What are your thoughts on Bitcoin?
Bitcoin has successfully broken above the $100,000 resistance zone and is now holding above this key level.
The price is expected to challenge the previous high, which represents a major resistance area.
A short-term pullback may occur after testing this heavy resistance.
Once the correction is complete, Bitcoin could resume its upward move toward higher targets.
Will Bitcoin continue its rally after a healthy pullback? Share your thoughts below!
Don’t forget to like and share your thoughts in the comments! ❤️

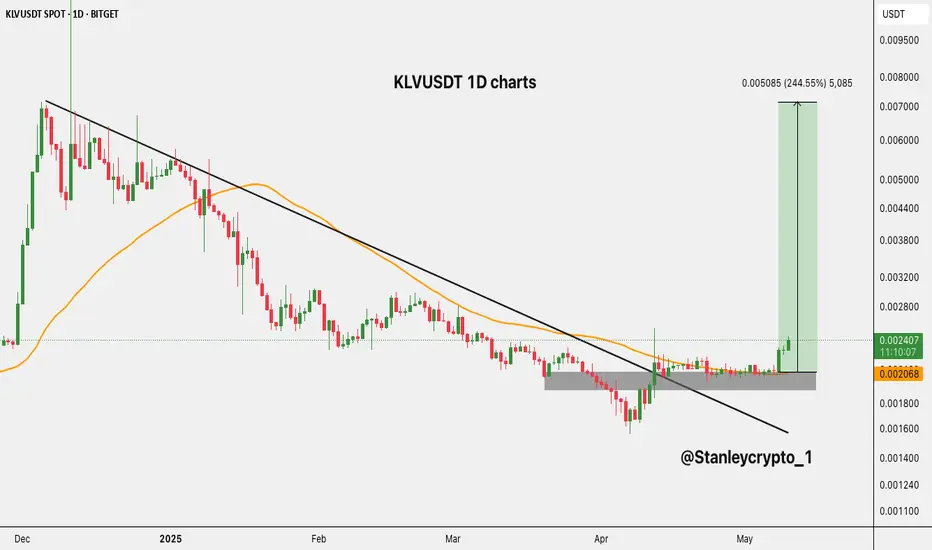
$KLV Breakout Alert!$KLV Breakout Alert!
Klever $KLV has officially broken out of its long-term downtrend line on the daily chart!
After months of consolidation in a tight accumulation zone, bulls have stepped in hard.
- Clean breakout from descending resistance
- Strong base formed around $0.00195–$0.00206
- Potential upside target: $0.007500 +244%
This move looks explosive.
Watch closely for continuation! DYRO, NFA