BTC Testing Red Resistance – Potential Breakout Ahead!🚀 CRYPTOCAP:BTC Testing Red Resistance – Potential Breakout Ahead! 📈
CRYPTOCAP:BTC is currently testing the red resistance zone. A potential breakout could be coming soon, and we might see a new all-time high (ATH)! 🔥
Let’s watch this breakout closely! 💼💸
BTCUSDT

2 Charts in Monthly Time FrameThere’s a common misconception when it comes to the relationship between the U.S. Dollar Index (DXY) and Bitcoin — and it's time to take a deeper look.
While the short-term movements of DXY can create temporary pressure on Bitcoin, the broader correlation tells a different story. If you zoom out and analyze the larger structure, an interesting pattern begins to emerge.
Historically, when DXY enters a major rally within a wide-ranging diametric formation, Bitcoin doesn’t necessarily decline — in fact, it often follows the trend with a slight delay. This lag can vary between one to two months, but the eventual upward momentum in Bitcoin frequently aligns with DXY strength over extended periods.
So before drawing conclusions based on daily fluctuations, take a step back — compare the macro charts, connect the dots, and you'll start to see a bigger, more nuanced picture.

BTCUSDT IDEA Price on zones which were broken earlier today. One trade can be punched for upside from here.

BTC Macro impulse over now lower to goBTC has to break 109k soon to invalidate this Macro bearish count. BTC could correct lower for the next few years.

ADAUSDT IDEALooking for the level breaks to the upside. This indicator has higher accuracy telling in short to medium term trades rather than long term anticipation.

Bitcoin the Big Bearish TrapIn my opinion we are forming an extended right shoulder on the weekly
1 Scenario: It's expected to see an impulse to 107-112k area but I wouldn't buy spot/long btc in here under any circumstance.
Based on weekly RSI, we might top somewhere there, or sooner
2 Scenario: We don't go above 100k and start a sudden move down, as SPX just retested it's previous highs and a retrace is expected as well.
Regarding Altcoins, if btc goes above 115k, it's worth the risk with proper management but not sooner, or you risk being the exit liquidity in a very big downward move.
Or, btc retraces to sub 80k and we have one more leg left of 20-30% on alts before doom

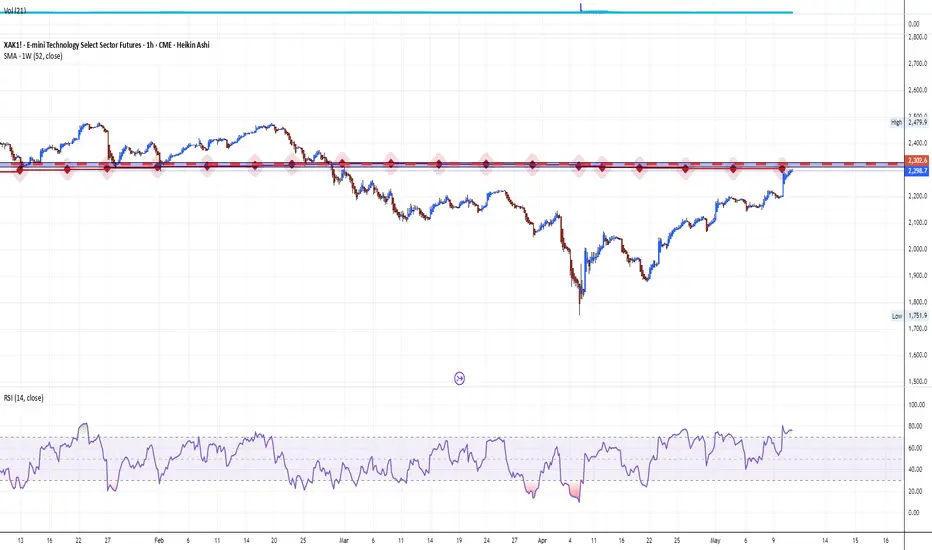
US Technology Stock Sector. The Underpressured PathThe recent reduction of tariffs under former President Trump's administration, while intended to ease trade tensions, has had several negative impacts on the U.S. technology sector, particularly in 2025.
Increased Costs and Supply Chain Disruptions
Despite some tariff reductions, the overall tariff environment remains highly volatile and complex. Many tariffs on tech products, especially those involving China, remain elevated-up on Chinese-made smartphones and other electronics. This has significantly increased manufacturing costs for U.S. tech companies reliant on global supply chains, particularly those sourcing components or assembling products in China, Vietnam, and other Asian countries.
The tariffs have disrupted supply chains, forcing companies to reconsider production locations and logistics. Many firms are shifting production away from China to countries like India or Vietnam to mitigate tariff impacts, but this transition is costly and slow. Reshoring semiconductor manufacturing to the U.S. is challenging due to high labor costs and lack of skilled workforce, which means higher prices for end products like AI-enabled PCs and servers are expected.
Suppressed Consumer Demand and Market Uncertainty
Higher tariffs translate to increased retail prices for consumer electronics, reducing demand. For example, smartphone prices have risen, leading to weaker consumer sentiment and slower sales growth. This is particularly harmful in a sector where rapid innovation and high sales volume are critical for profitability and investment in new technologies.
The uncertainty caused by fluctuating tariff policies has also led to delayed purchasing decisions by enterprises and consumers. Companies are hesitant to invest in new hardware or AI infrastructure due to unclear future costs and potential further tariff changes. This delay threatens technology roadmaps and weakens the U.S. tech sector's competitiveness globally.
Impact on Innovation and Investment
Tariffs have broader implications beyond immediate cost increases. By fragmenting markets and increasing operational costs, they reduce incentives for innovation. Companies face pressure to duplicate investments or abandon certain markets, which slows technological progress and reduces the U.S.'s ability to maintain leadership in emerging fields like AI and advanced semiconductors.
The increased costs and uncertainty have also dampened investment in U.S. tech infrastructure. Although some companies like TSMC and Apple have announced U.S. manufacturing investments to offset tariff impacts, these efforts are insufficient to counterbalance the negative effects fully. The long lead times and capital intensity of building semiconductor fabs mean that reshoring will not provide a quick fix.
Economic and Strategic Risks
The tariffs contribute to broader economic risks, including potential recession, inflation, and job losses in the tech sector and related industries. CEOs across sectors have expressed concerns about the tariffs leading to economic downturns, higher prices, and layoffs. The tech sector, being highly globalized and interconnected, is particularly vulnerable to these macroeconomic shocks.
Moreover, the tariffs strain U.S.-China relations, a critical factor in global tech supply chains and innovation ecosystems. Retaliatory tariffs from China and other countries further complicate market access for U.S. tech firms, reducing their export opportunities and competitiveness.
Conclusion
In summary, the recent tariff reductions under Trump's policy have not fully alleviated the negative impacts on the U.S. technology sector. Elevated tariffs continue to raise manufacturing costs, disrupt supply chains, and suppress consumer demand. The resulting uncertainty delays investments and innovation, while economic risks and strained international relations further threaten the sector's growth and global standing. These factors collectively undermine the competitiveness and future prospects of the U.S. tech industry.
Technical challenge
The main technical graph for US Technology Sector Futures CME_MINI:XAK1! (cost-adjusted modification) still remains under key resistance of 52-week SMA, which indicates on further possible bearish pressure.
--
Best wishes
@PandorraResearch Team
BTC/USDT: 2Potential Long Scenarios Within the Ascending ChannelHello guys!
There are two scenarios here:
Scenario 1: Breakout Continuation (Aggressive Long Entry)
Entry Zone: Around the current price (~$103,000–$104,000)
Reasoning: Price has bounced from the lower boundary of the channel and is now pushing higher with strong momentum. An aggressive long position can be considered with expectations that BTC will continue climbing toward the upper resistance line of the channel.
Target Zone: $110,000–$114,000 (marked in the yellow box)
Scenario 2: Pullback to Support (Conservative Long Entry)
Entry Zone: Between $96,000–$99,715
Reasoning: If BTC faces rejection near current levels or the midline of the channel, a healthy correction could bring the price back to a key demand zone, aligning with the lower trendline and horizontal support levels.
Target Zone: Same upper boundary of the channel ($110,000–$114,000)

SOLUSDT UPDATE
Pattern: Falling Wedge Breakout
Current Price: \$173.38
Target Price: \$300
Target % Gain: 105.90%
Technical Analysis: SOL has broken out of a falling wedge pattern on the daily chart, indicating a bullish reversal. Strong momentum and breakout confirmation suggest a potential move towards the \$300 level.
Time Frame: 1D
Risk Management Tip: Always use proper risk management.

HelenP. I Bitcoin will continue to grow inside upward channelHi folks today I'm prepared for you Bitcoin analytics. The price has recently shown another confident bullish impulse, pushing higher within a clean ascending channel. The key moment was the breakout above the resistance zone, which had previously acted as a ceiling for the price. This breakout marked the continuation of a higher-high, higher-low sequence that confirms the strength of the ongoing trend. Then the market returned to retest this former resistance, now acting as support, and immediately bounced, reinforcing buyer control and validating the area as a foundation for the next move. Now BTC is holding firm in the upper half of the channel, maintaining its position above the trend line with little sign of weakness. This combination of sustained bullish structure, well-respected technical levels, and steady volume behavior suggests that the market is still preparing for higher levels. With the current structure and momentum, I expect BTCUSDT will continue its upward path within the channel. My goal is 108700 points, which aligns almost with the resistance line of the upward channel. If you like my analytics you may support me with your like/comment ❤️

BTC at Critical DP: Rising Wedge Breakdown or Bounce?!Hello guys!
1. Bearish Breakdown (Primary Setup):
If price breaks below the rising wedge support and sweeps the recent low, it confirms the breakdown.
This would be a strong signal to enter short positions, with a downside target around the 99,000–98,500 zone.
Breakdown confirmation: Close below both wedge support and the horizontal support from the previous swing low.
2. Bullish Bounce (Alternative Setup):
If price respects the wedge support and shows bullish momentum (e.g., strong wick rejections or bullish engulfing candle), the wedge may invalidate.
In this case, look for long opportunities targeting the upper wedge boundary and possibly higher resistance zones beyond 104,000.
📌 Strategy Summary:
🔻 Breakdown = SHORT to target area (below 100K)
🔺 Support holds = LONG toward 104K+
Risk management is crucial here, as the pattern is at a tipping point. Wait for a clear breakout or bounce before entering a position.

BTCUSDT IDEAAt the highs on the one side and on the contrary formations seems to be a chance for breakout to capturing more upside might put a limited move but with momentum (on the upside).
Only hurdle seems to be supplies on daily TF at this price.


Bitcoin: Sellers Still Holding Their GroundHey traders and investors!
On the daily and weekly timeframes – sideways ranges (boundaries marked in black on the chart). The current initiative is from the seller.
📌 Yesterday, the seller made an effort to push the price down — this shouldn't be ignored.
📊 Targets on the chart:
Weekly TF: 96,500
Daily TF: 89,256
10-day TF: 99,475 (upper boundary of the buyer zone)
Although I expect the price to continue moving up, it's not advisable to look for buy setups until clear signs of buyer strength appear.
🚨 Selling is risky (details in the post about the 10-day TF).
👀 Observing.
This analysis is based on the Initiative Analysis concept (IA).
Wishing you profitable trades!

Phemex Analysis #80: Can Bitcoin Hold $100k?Bitcoin’s breakout above the $100,000 mark on May 8, 2025—its highest level since early January—reflects renewed risk-on sentiment across global markets, supported by easing U.S.-China tension and expectations of favorable crypto regulation. Spot ETF flows have also played a pivotal role: U.S. Bitcoin ETFs have accumulated over $1 billion in net inflows this month, with BlackRock’s IBIT leading demand, underpinning liquidity in the $100k zone. Despite the enthusiasm, trading volumes on leading exchanges have shown signs of plateauing, hinting at cautious engagement from larger players.
Possible Scenario
Support Analysis
1. $100,000 Psychological Support
After initially spiking to $105,784, BTC retreated to hover just above $100k, which has transitioned into a crucial support level. A decisive hold here would confirm buyer conviction at round-number thresholds.
$97,000 Major Technical Floor: Beneath six figures, the $97,000 region—previously a resistance zone in April—now offers strong demand, reinforced by the convergence of the 50- and 100-day moving averages.
$92,000 Secondary Support: Should broader market risk aversion emerge, traders could see a retracement back to $ 92K, where on-chain data indicates accumulation by long-term holders. This level aligns with the 200-day moving average, often cited as a bear-market safeguard.
2. ETF-Driven Cushion
Spot ETF inflows continue to absorb sell-side pressure, potentially dampening volatility around support levels. Historical data shows ETFs acted as a buffer during the March sell-off, suggesting they may again prevent sharp dives if BTC dips towards $90k–$100k.
Resistance Analysis
1. $105,000 Near-Term Cap
BTC peaked at approximately $105,784 on May 12, encountering supply from short-term profit-takers. A close above this region would target the early-2025 all-time high near $109,917.
2. $109,917 All-Time High
Surpassing the January ATH at $109k remains a key objective for bulls. However, historical patterns reveal increasingly subdued momentum on successive tests of this level, indicating potential exhaustion if attempted too quickly.
3.Upside Target $120,000
Most Analysts highlight a possible extension to $120k should institutional demand persist and macro conditions remain supportive.
Conclusion
Bitcoin’s ability to hold the $100,000 mark hinges on its capacity to stave off profit-taking around headline-grabbing price points and sustain ETF-driven support. Key technical floors at $100k and $ 97K—reinforced by moving-average convergence—provide a strong base, while resistance levels at $105k and the all-time high near $109.6k represent the next hurdles. If these zones are negotiated successfully, a new leg toward $120k could unfold; if not, traders should watch for a pullback to the mid-$90,000 range for renewed entries.
Overall, barring sudden negative macro shocks, the outlook favors BTC maintaining its foothold at six figures, underpinning continued upside momentum.
Pro Tips:
Armed Your Trading Arsenal with advanced tools like multiple watchlists, basket orders, and real-time strategy adjustments at Phemex. Our USDT-based scaled orders give you precise control over your risk, while iceberg orders provide stealthy execution.
Disclaimer: This is NOT financial or investment advice. Please conduct your own research (DYOR). Phemex is not responsible, directly or indirectly, for any damage or loss incurred or claimed to be caused by or in association with the use of or reliance on any content, goods, or services mentioned in this article.

BTC - 180k topBTC - Local bottom was around 74k, now heading towards 180k which will be the top for this cycle.
74 – – – - – – 54 bottom.

BTC at Key Inflection Zone – Breakout or Rejection Ahead?Asset: BTC/USD
Timeframe: 4H or Daily (based on visual pattern structure)
As of: May 6, 2025
Indicators:
50 EMA (Red): $91,615.79
200 EMA (Blue): $89,305.75
Key Technical Zones:
🔴 Resistance Zone: ~$104,000 – $108,000
This area has historically acted as a major supply zone.
Price has been rejected from this level multiple times, indicating strong selling pressure.
🔁 Flip Zone (Resistance turned Support/Support turned Resistance): ~$95,500 – $100,000
The current price ($95,234.23) is testing this zone from below.
A confirmed break and hold above could signal continuation toward the higher resistance.
🟢 Strong Support Zone: ~$88,000 – $91,000
Confluence of 50 EMA and 200 EMA adds strength to this demand zone.
Previous breakout level and accumulation area.
EMA Outlook:
50 EMA > 200 EMA: Short-term bullish crossover is active, indicating bullish momentum.
Both EMAs are sloping upward slightly, suggesting trend strengthening.
Price is currently above both EMAs, which acts as dynamic support.
Potential Scenarios:
✅ Bullish Scenario:
If price reclaims the $95,500–$100,000 resistance-turned-support zone:
Expect upward momentum to continue.
Target: $104,000–$108,000 zone.
Break of $108K could lead to a macro bull continuation.
⚠️ Bearish Scenario:
If price rejects the current zone and fails to hold above the $91,000 support:
Look for retest of $88,000–$89,000 area (confluence with EMAs).
Breakdown below that zone would invalidate bullish structure and signal potential deeper correction.
Summary:
Bias: Bullish above $91K, Neutral between FWB:88K –$91K, Bearish below $88K.
Key Confirmation Needed: Daily close above $100,000 for strong bullish continuation.
Risk Management: Watch for fakeouts within the $95K–$100K range due to past volatility.

#BTC/USDT Bullish Crossover in Play!CRYPTOCAP:BTC Update: Bitcoin is currently holding support and showing signs of strength with a bullish EMA crossover — the 50 EMA crossing above the 100 EMA, which historically signals upward momentum based on past fractals.
The lower support zone is marked in blue, in case the price dips further.
Immediate resistance remains at the GETTEX:98K level — a confirmed close above this could trigger a move toward $103K.
Stay tuned for more real-time updates.
Do hit the like button if you like it, and share your views in the comments section.
Thank you
BTC Might Face a Selloff That Could Stay as a Buying OppurtunityBitcoin is enjoying the rally and the support it's receiving from the stock market. After testing the 72,000–74,000 zone, the upward reaction was so strong that even the major resistance at 91,000 failed to slow the move. However, now that the S&P 500 has reached a key resistance zone, momentum may begin to slow, at least in the short term.
If the 102,300 level breaks, Bitcoin could retreat toward the lower boundary of the newly formed trend channel. In the medium-term outlook remains bullish so any short-term pullbacks are likely to present buying opportunities, as long as the trend channel and the 91,000 support level remain intact.
For context, refer to our earlier daily timeframe posts on the S&P 500 and BTC:

Update! $BTC range Bound... Consolidation? Breakout? Breakdown? CRYPTOCAP:BTC appears to have formed a range: between approximately between 76800 and 104,300
Current price: 104300
Here are the key observations:
Key resistance zone is around 104300 - Price has tested this level multiple times but failed to close above it decisively.
Clear to say that A break above which will lead to All time highs possibly up to 135k
If #BTC Bitcoin continues to reject this level then expect these layers of support to be tested:
97700 and then 91100
CRYPTOCAP:BTC remains bullish if prices remains above 91100. Further break down will lead to bottom of range 84100 and 76800 (coinciding with 200 EMA )
Trading Implications:
For Longs: Avoid new positions unless there's a breakout with volume above $105,000.
For Shorts: This is a possible scalp opportunity near the top of the range, with a stop slightly above $105,000.
Not financial Advice!

btcusdt - short i thinq time to short?
Push like if you think this is a useful idea!
Before to trade my ideas make your own analysis.
Write your comments and questions here!
Thanks for your support!

Bitcoin at key zone - Breakout or rejection?MARKETSCOM:BITCOIN is once again at a critical resistance level. A breakout above $109K would confirm a new ATH and likely spark another leg up, but a strong rejection here might signal that the rally was a trap, echoing patterns we’ve seen in past cycles.
My Take: We’re at a make-or-break moment. Confirmation from this level will decide the next big move.
What’s your take—breakout or rejection?
Please support this idea with a LIKE👍 if you find it useful🥳
Happy Trading💰🥳🤗

Skeptic | BTC Breaks $100K: Is the Uptrend Just Getting Started?Hey everyone, Skeptic here! Bitcoin’s finally back above $ 100K , but will this rally keep charging forward? 😊 In this idea, we’re diving into Bitcoin across multiple timeframes , hunting for spot and futures triggers, and wrapping up with a look at BTC dominance. Let’s kick things off with the Weekly Timeframe. 📊
Weekly Timeframe: The Big Picture
As I’ve mentioned in previous episodes, the major trend is still a solid uptrend. Why? Per Dow Theory, we’re consistently making higher highs and higher lows. Plus, volume backs this up—rallies come with heavy volume, while corrections see lighter volume. Corrections haven’t even touched the 0.50 Fibonacci retracement level, which all points to the uptrend staying strong. Honestly, I’m not selling my spot holdings right now—this trend’s too good! Let’s zoom into the Daily Timeframe for spot triggers.
Daily Timeframe: Spot Triggers
Our previous spot trigger was a buy above $ 88,500 , and since it activated, it’s delivered about 18% profit so far—nice! A quick note: if your capital or risk management is too aggressive, please scale back to stay in profit. If you hit a stop loss, risk no more than 2-3% of your total capital—no more. Now, let’s analyze the chart. Over the past four weeks, we’ve kicked off a solid uptrend, and the corrections feel healthy. Volume’s increasing, showing the trend’s got power. After hitting resistance at $ 105,000 , it looks like we’re gearing up for a correction after a three-wave uptrend. Keep this in mind: $ 107,000 is a major resistance and could be a great spot trigger. If we break $ 107,000 , go long with a stop loss below $88,000, risking max 3%. That’s a solid setup. Let’s move to the 4-Hour Timeframe.
4-Hour Timeframe: Long & Short Setups
Our previous long trigger at $85,850 was a banger—if you watched the video and went long with 10x leverage, you’re up about 200% . Congrats if you caught it! 🙌 Moving forward, I’ll share some new long and short triggers that could be useful. For a long setup, we need to see a reaction at $ 105,000 again, then break that resistance to open a long. But keep your risk low because we’ve got a major resistance at $ 107,000 looming, and the odds of getting stopped out are higher. I’m saying this now so you don’t complain later! In these conditions, don’t obsess over confirmations from indicators like RSI. Movements are sharp, and by the time you wait for a confirmation, the price has already moved. Stick to your main triggers to open positions. For short setups, I’ve got nothing right now. We’re in a strong bullish trend without even a hint of weakness, so I see no reason to go short. Let any sharp pullback pass first, then we can open shorts with confidence if bearish momentum kicks in. Don’t open shorts against the trend just for a 1% chance of a crash. Patience, patience, patience—that’s the key to success in financial markets. The market’s always been here and always will be, so don’t FOMO or trade against your strategy. Let’s talk BTC.D next, but first, if this has been helpful, I’d appreciate a like and a subscribe—it means a lot! 😊
BTC Dominance (BTC.D)
Let’s get a big-picture view of BTC.D—Bitcoin’s share of the total crypto market cap. If this ratio is in an uptrend, liquidity is flowing from altcoins into Bitcoin. If it’s downtrending, it’s moving from Bitcoin to altcoins. Right now, we’re above an uptrend line, so it’s better to go long on BTC since it’s growing faster than most alts. But if the trendline breaks and we drop below 60.27, we can assume an altseason is starting, and that’s when we pivot to buying altcoins. On the daily, BTC.D has been rising nicely, and while some altcoins are starting to wake up, there’s no trend reversal yet. If you check BTC pairs, you’ll notice altcoins are still performing weakly compared to BTC. So, if you’re holding altcoins, it’s better to wait for a clear trend change in BTC.D before buying—that’s the logical move. If you have questions about the analysis or want me to analyze a specific altcoin or symbol, drop it in the comments. BTW, I’m Skeptic! 😄
💬 Let’s Talk!
If this analysis helped you out, give it a quick boost—it means a lot! 😊 Got a pair or setup you want me to tackle next? Drop it in the comments, and I’ll get to it. Thanks for hanging out, and I’ll see you in the next one. Keep trading smart! ✌️
