Bitcoin Vs Microsoft 🚨MartyBoots here , I have been trading for 17 years and sharing my thoughts on COINBASE:BTCUSD .
🚨
.
NASDAQ:MSFT vs COINBASE:BTCUSD
Do not miss out on COINBASE:BTCUSD as this is a great opportunity. You are still early
Watch video for more details
BTCUSDT

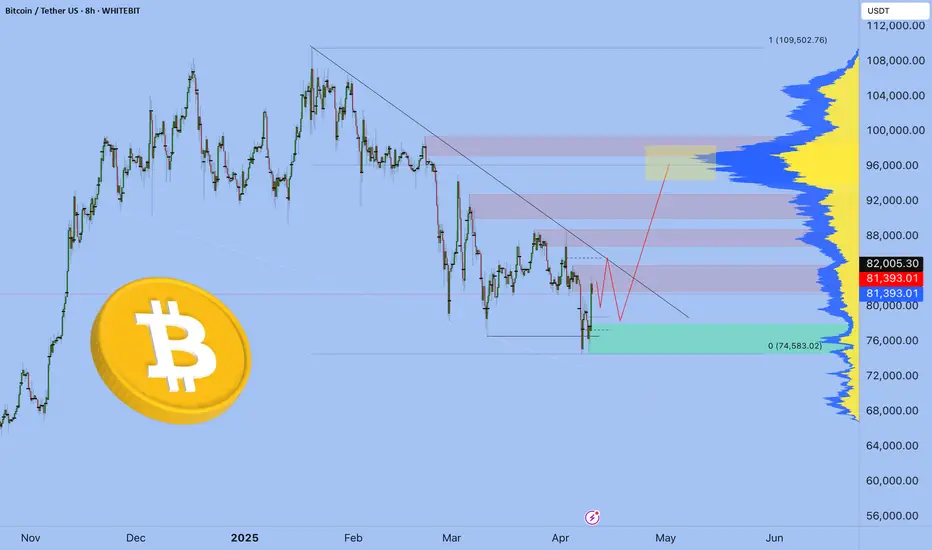
Bitcoin update 10.04.2025 - BTC - 98k in May🔥 The Markets Are on Fire — and We Know Who Lit the Match.
The last few weeks have been pure chaos.
Markets are crashing, confidence is shaking, and crypto is confused.
And let’s not pretend we don’t know who’s behind it.
Donald Trump.
Even a Korean guy selling panda souvenirs on the street told me:
“This Trump is ruining everything.”
And he’s not wrong.
Billions wiped. Positions wrecked.
But here’s the thing — this isn’t random. This is tactical drama.
Trump sees himself as a master negotiator, and here’s how he plays the game:
🎭 The Trump Cycle (Get Ready for the Loop)
Pressure — tariffs, chaos, media hysteria. We’ve seen it.
Relaxation — 90-day delays, fake calm.
Talks — and boom, “positive developments.”
Good News —
• “Bitcoin added to U.S. reserves.” in MAY?
• “Americans to receive new stimulus.”
• “China’s our friend again!”
Charm & Flirt Mode — improving global relations, smiling at cameras.
More good news — stock markets fly, crypto rips and everyone screams, “New bull run!”
And then?
💥 Back to pressure.
📆 September 2025 is the punchline.
That's when this cycle hits the weaker economies like a freight train:
✅ Broken supply chains
✅ Collapsing currencies
✅ Defaults
✅ And where there’s chaos — there’s war. Expect escalation in fragile regions like the Middle East.
✅ Crude oil falling to 40$
Markets will top on pure euphoria.
The reversal begins when everyone’s drunk on hopium and “good news”.
💼 My Plan? Ruthlessly Simple:
🔹 May I will participate in the first Offline/Online International Crypto Trading Cup 2025 by WhiteBIT
🔹Jun-August -Euphoria in the market
🔹 September - Take profits
🔹 Either short — or sip something cold on a quiet beach. But we will see
We’ve officially entered the Turbulence Zone.
The following 10 years will be insane — for those who adapt, evolve, ride the trends, and harness AI and tech.
If not?
You get left behind.
It’s not the strongest who survive — it’s the fastest to adapt.
Best regards, EXCAVO
Bitcoin 1-Hour Chart: Quick Market BreakdownBTC is trading within a well-defined ascending channel, with the price currently at $97,400, after breakout and retest of weekly high resistance around $95,800. The channel’s upper boundary projects a potential target of $104,000 if BTC continues to move upward over the week!
Key resistance levels to watch are $98,000 and $100,000, while support lies at $96,200 and the channel’s lower boundary at $95,000.
A breakout above $100,000 could ignite a rally toward $104,000, but if BTC fails to hold support at $96,000, we might see a dip back to $94,400-93,000.
Key Levels to Watch:
Resistance: $100,000, $98,000
Support: $96,000, $94,000
Breakout Target: $104,000+
Breakdown Risk: $93,000
Will BTC soar to new heights, or are we in for a pullback? Let’s hear your thoughts below!

Can BTCUSD continue to be purchased? The answer is definitely.Can BTCUSD continue to be purchased? The answer is definitely.
The current trend is a rebound trend after a volatile decline. The space for a short-term increase of 1,500 points is very simple. The target position is 94,700-95,200. Friends who like to do short-term swing trading can follow.

BTC DOMINANCEBitcoin dominance could break down at this point, potentially signaling the start of an exceptional altseason.

Bitcoin Roadmap — April to June 2025Hey traders! 👋
Bitcoin’s currently hanging around $94,100, and it just broke out of a multi-month diagonal resistance with strong volume and a solid daily close above all the SMAs and EMAs—bullish reversal confirmed! 🔥
Here’s what I think might play out between now and June:
Phase 1: Rally Toward Higher High (Now → May 1st)
Target: ~$99,600 (key horizontal + trendline resistance)
BTC is making a strong parabolic move with increasing volume and RSI confirming strength.
Break above $96 K → quick push toward psychological resistance near $100 K.
Expect a local top (HH) to form around late April to May 1st.
Phase 2: Pullback & Higher Low (May → June 1st)
Target Zone: ~$83 K–$86 K (confluence of multiple support zones + volume shelf)
A healthy correction is expected after tagging the upper resistance.
Formation of a higher low (HL) will validate a long-term uptrend.
Time-based support appears aligned with early June, matching your HL arrow.
Phase 3: Trend Continuation (Post June 1st)
If BTC forms a higher low and maintains structure, the next move targets:
$105 K–$109 K (Fibonacci extension + ATH zone)
Break above $99.6 K would flip this into macro bull territory
Key Levels to Watch:
Resistance $99,600 Horizontal + trendline rejection
HL Zone $83 K–$86 K Fib & breakout base, HL formation
Support $79.4 K 0.5 Fib — invalidation if lost
Summary:
BTC is in the midst of a potential higher high formation, targeting ~$99.6K by early May. A correction is then likely, forming a higher low in the ~$83 K–$86 K range into early June, setting the stage for a macro breakout run.

Gold Price (XAUUSD) Retesting Fibonacci Support ZoneGold (XAUUSD) is currently in a technical phase that aligns with a classic **retesting formation**, where price action returns to previous support levels before resuming its bullish trend. After hitting a recent high near 3,350–3,400, gold has begun a healthy retracement, with key Fibonacci levels acting as potential demand zones. The 3,200–3,150 range appears to be a strong support zone, and if this level holds, it could trigger the next leg up in the bullish trend. Volume remains supportive, suggesting market interest is still intact, and buyers may be preparing for re-entry.
This consolidation phase could offer an excellent opportunity for smart money accumulation, particularly as gold respects major technical levels and Fibonacci retracement zones. From a macro perspective, continued geopolitical tensions, inflationary concerns, and central bank accumulation of gold provide a strong fundamental backdrop that supports a long-term bullish outlook. If gold maintains above the key 0.5 and 0.618 retracement levels, we could soon witness a new wave targeting the 3,350 to 3,400 resistance zone once again.
Market participants should watch for confirmation through bullish candlestick patterns and increasing volume in the coming sessions. A break above 3,275 would further validate bullish continuation and may serve as a trigger point for momentum traders. The broader trend remains intact, and current price action fits the pattern of a technical breather before the next impulsive rally.
✅ Show your support by hitting the like button and
✅ Leaving a comment below! (What is You opinion about this Coin)
Your feedback and engagement keep me inspired to share more insightful market analysis with you!

BITCOIN | 30M | IMPORTANT SUPPORT ZONE Hello, my friends,
Yesterday, I shared a Bitcoin analysis and stated that my target level is 97,300.
At the moment, we are within the blue support zone I highlighted in my analysis yesterday. Although this is not a very strong support zone, I am expecting an upward movement from here. However, the most critical support level lies between 92,000 and 91,000.
As I mentioned yesterday, as long as the price does not drop below the 92,000 - 91,000 levels, my target remains at 97,300.
Please don't forget to like.
Thank you to everyone who supports with likes.

In - depth Analysis of BTC: Can the 97,000 Target be Achieved?96000: This is the resistance level near the upper trend - line of the current ascending wedge. The price has tested this area several times but failed to break through effectively, indicating strong selling pressure at this level 💥.
⚡⚡⚡ BTCUSD ⚡⚡⚡
🚀 Buy@92000 - 93000
🚀 TP 95000 - 96000 - 97000
Accurate signals are updated every day 📈 If you encounter any problems during trading, these signals can serve as your reliable guide 🧭 Feel free to refer to them! I sincerely hope they'll be of great help to you 🌟

BITCOIN New Update (4H)This analysis is an update of the analysis you see in the "Related publications" section
The 96k–97k zone is an important area. It is expected that with a touch or hunt of this zone, which we have shown on the chart with an orange circle, Bitcoin will give a correction and altcoins that are ready for correction will also correct.
For risk management, please don't forget stop loss and capital management
Comment if you have any questions
Thank You

BTCUSDT forming a Bullish Flag patternBitcoin (BTCUSDT) is currently forming a classic bullish flag pattern on the daily chart, often regarded as a strong continuation setup in technical analysis. The breakout from the prior descending wedge has already provided strong bullish momentum, and now BTC is consolidating just below key resistance, signaling the next possible leg upward. With volume steadily increasing during this consolidation phase, this flag pattern holds significant potential for a breakout rally.
The price structure reflects healthy accumulation, where smart money seems to be stepping in before the anticipated surge. The flagpole leading up to the pattern shows strong bullish dominance, and the sideways flag structure suggests that Bitcoin is merely taking a breather before pushing higher. A confirmed breakout from the flag could target an upside of 20% to 30%+, aligning with the projected price move shown on the chart.
Fundamentally, Bitcoin continues to gain mainstream traction, and the broader crypto sentiment is turning positive again. The volume patterns and technical indicators reinforce the bullish outlook. Investors are showing renewed interest, especially as BTC holds above key psychological and structural levels, which adds confidence to the continuation narrative.
This setup is ideal for breakout traders and investors looking to capitalize on short to mid-term gains. If the bullish flag plays out as expected, BTC could make another significant move toward its all-time high zone.
✅ Show your support by hitting the like button and
✅ Leaving a comment below! (What is You opinion about this Coin)
Your feedback and engagement keep me inspired to share more insightful market analysis with you!

$TRB/USDT Targeted setup $TRB/USDT – Targeted Setup
Clear descending wedge breakout
Retest of the resistance zone holding as support
Bullish structure forming with higher lows
- Entry zone: CMP
- Target: $98
- Stop-loss: $26
This is a clean breakout-retest setup, with momentum favouring bulls.
As long as $29.98 holds,
Eyes are on $97. 👀
DYOR, NFA

Bitcoin 1-Hour Chart: Quick Market BreakdownIn this concise market review, we'll analyze the latest movements on Bitcoin's 1-hour chart.

$ORDI/USDT Long setup 4h$ORDI/USDT – Long Setup (4h) 🚀
Entry: CMP
SL: $7.51
Targets: $10 / $12 / $13
- Breakout & retest of trendline
- Bullish momentum building
- Setup is valid as long as $8.10 holds
DYOR. Trade safe! 👀


BITCOIN - A real bullish sign!3D chart shows a Bullush exaggerated Divergence on RSI indicator.
Bullish Exaggerated Divergence happen when:
1- Price: Forms a double bottom (two equal lows).
2- RSI: The second low is higher than the first.
- Implication: Momentum is picking up despite flat price, hinting at a possible upward reversal.
It's called exaggerated because price looks stable (same lows), but RSI reveals a hidden shift in momentum.
There’s also a breakout from a falling wedge pattern and a perfect break above the 50 EMA with a massive green candle.
We are now at the beginning of Bitcoin’s true bullish rally.
Best regards Ceciliones🎯

Alt season won't be too far!Based on common indicators, "Others" chart shows an obvious trend and pattern which, overall, confirms the high possibility of a new Alt season.

$DOGS/USDT Breakout alert📈 $DOGS/USDT Breakout Alert
DOGS just broke out of its long-term descending wedge — a bullish signal!
- Trendline cracked
- Support held
- Reversal brewing?
One to watch. DYOR!

BTC - Wreckdown to 90.7k?Okay so as mentioned bTC tested its nPoC 95.1k and soon would come off to 90,740 as the median point where major liquidity stays, the plays are to played on the falls!

Check if it can rise along the rising channel
Hello, traders.
If you "Follow", you can always get new information quickly.
Please click "Boost" as well.
Have a nice day today.
-------------------------------------
(BTCUSDT 1D chart)
This volatility period is until April 30th.
The point to watch is whether it can rise along the newly created trend line (4) or whether it can rise along the rising channel consisting of trend lines (2) ~ (4).
-
If it falls near Fibonacci 3.14 (93570.28), it seems likely that a new HA-High indicator on the 1D chart will be created.
Accordingly, if the HA-High indicator is created, the key is whether there is support near it.
That is, we need to check whether there is support near the Fibonacci ratio range of 3 (92026.52) ~ 3.14 (93570.28).
If not, there is a possibility of a decline near the trend line (2).
-
The next volatility period is around May 19.
-
Thank you for reading to the end.
I hope you have a successful trade.
--------------------------------------------------
- Here is an explanation of the big picture.
I used TradingView's INDEX chart to check the entire range of BTC.
I rewrote the previous chart to update it while touching the Fibonacci ratio range of 1.902 (101875.70) ~ 2 (106275.10).
(Previous BTCUSD 12M chart)
Looking at the big picture, it seems to have been following a pattern since 2015.
In other words, it is a pattern that maintains a 3-year bull market and faces a 1-year bear market.
Accordingly, the bull market is expected to continue until 2025.
-
(Current BTCUSD 12M chart)
Based on the currently written Fibonacci ratio, it is displayed up to 3.618 (178910.15).
It is expected that it will not fall again below the Fibonacci ratio of 0.618 (44234.54).
(BTCUSDT 12M chart)
I think it is around 42283.58 when looking at the BTCUSDT chart.
-
I will explain it again with the BTCUSD chart.
The Fibonacci ratio ranges marked in the light green boxes, 1.902 (101875.70) ~ 2 (106275.10) and 3 (151166.97) ~ 3.14 (157451.83), are expected to be important support and resistance ranges.
In other words, it seems likely to act as a volume profile range.
Therefore, in order to break through this section upward, I think the point to watch is whether it can rise with support near the Fibonacci ratios of 1.618 (89126.41) and 2.618 (134018.28).
Therefore, the maximum rising section in 2025 is expected to be the 3 (151166.97) ~ 3.14 (157451.83) section.
To do that, we need to look at whether it can rise with support near 2.618 (134018.28).
If it falls after the bull market in 2025, we don't know how far it will fall, but considering the previous decline, we expect it to fall by about -60% to -70%.
So, if the decline starts near the Fibonacci ratio 3.14 (157451.83), it seems likely that it will fall to around Fibonacci 0.618 (44234.54).
I will explain more details when the downtrend starts.
------------------------------------------------------

Bitcoin 30m chart.In my opinion, this is the most likely short-term scenario.
* The purpose of my graphic drawings is purely educational.
* What i write here is not an investment advice. Please do your own research before investing in any asset.
* Never take my personal opinions as investment advice, you may lose your money.

Bitcoin's Next Move - $90k Surge Before a Major Drop?Bitcoin is showing signs of a potential rally towards $90k, but could this be a trap before a deeper correction to $45k?
What's your take?
Will CRYPTOCAP:BTC reach new highs first, or is the drop coming sooner?
Share your thoughts!
Please support this idea with a LIKE👍 if you find it useful🥳
Happy Trading💰🥳🤗

Bitcoin Repeating 2022 Structure? Same Setup, Same Outcome?Bitcoin’s current market structure is starting to mirror its 2022 setup—right before the big drop.
This chart shows a familiar pattern: a rally, a peak, first drop from the ATH, a bull trap… then the major second leg down.
If history repeats, CRYPTOCAP:BTC could be on the verge of another significant move.
Will it break the cycle this time—or follow the same path again?
📉 What do you think?
Share your take in the comments below.
Please support this idea with a LIKE👍 if you find it useful🥳
Happy Trading💰🥳🤗
