VOXELUSDT Forming Falling Wedge VOXELUSDT is currently displaying a textbook falling wedge pattern, a bullish formation that often signals the end of a downtrend and the start of a powerful rally. The price has been compressing within this pattern, forming lower highs and lower lows, but with decreasing bearish momentum. This technical setup is gaining attention from experienced traders as it historically leads to strong breakout moves when confirmed with increased volume and a decisive breakout above resistance.
The trading volume for VOXELUSDT is showing healthy activity, which supports the credibility of this setup. With volume gradually building and price nearing the apex of the wedge, a breakout could be imminent. Current analysis suggests a potential gain of 140% to 150%+ once VOXELUSDT clears its overhead resistance. This target is consistent with previous moves triggered by similar patterns in comparable market conditions.
VOXEL, the native token of the Voxie Tactics ecosystem, continues to garner investor interest due to its presence in the growing GameFi and NFT gaming sectors. With increased adoption and renewed interest in blockchain gaming, VOXELUSDT is positioning itself as a sleeper gem that could rally significantly once market sentiment aligns with the technical picture.
For traders focused on pattern-based entries, VOXELUSDT provides a promising high-reward setup. The falling wedge combined with good volume and emerging community interest points to a bullish opportunity that could unfold swiftly.
✅ Show your support by hitting the like button and
✅ Leaving a comment below! (What is You opinion about this Coin)
Your feedback and engagement keep me inspired to share more insightful market analysis with you!
BTCUSDT

AWEUSDT Forming Bullish WaveAWEUSDT is showing early signs of a bullish wave pattern formation, with price action beginning to reflect strength after a period of consolidation. The emergence of this pattern is a classic indication of market participants preparing for a continuation move to the upside. With healthy volume accompanying this recent uptick, the current structure supports the probability of a short- to mid-term bullish breakout.
The expected price appreciation ranges between 20% to 30%, making AWEUSDT an appealing watchlist candidate for swing traders and short-term investors. The increasing interest around this project, both technically and fundamentally, indicates accumulating pressure beneath resistance levels. The pattern's wave formation suggests that we could be in the early stages of a broader upward movement if market sentiment remains positive.
AWE is gaining traction in the community as more investors look for innovative utility-driven tokens in a saturated altcoin landscape. With renewed focus on promising low-cap tokens, AWE is positioning itself to potentially benefit from upcoming bullish momentum. Traders are watching this setup closely, with the technicals aligning with growing social buzz and investor curiosity.
Given the strengthening price structure, volume confirmation, and bullish wave potential, AWEUSDT could offer an attractive risk-reward setup. Maintaining support above recent lows and continuing to push higher with solid volume will be key signals of further upside confirmation in this pattern.
✅ Show your support by hitting the like button and
✅ Leaving a comment below! (What is You opinion about this Coin)
Your feedback and engagement keep me inspired to share more insightful market analysis with you!

Signs of Bullish Reversal EmergingAs of today’s close, Bitcoin (BTCUSD) is showing early signs of a potential bullish reversal from a key mid-range Keltner Channel support zone. The recent Heikin Ashi candle reflects a strong recovery after a brief sell-off, with price rejecting lower support levels and closing firmly within the mid-band.
🔹 Key Observations:
Support Zone Respected: Price action respected the mid-Keltner Channel support, suggesting underlying buying interest around the $103k–$104k range.
Momentum Shift: The bullish engulfing nature of the current candle implies a potential shift in momentum, especially after recent consolidation below the upper range.
🔹Trade Idea: TP is near $112k, SL just under $102k.
Continued confirmation above the mid-band and sustained bullish volume will be critical for this move to extend.

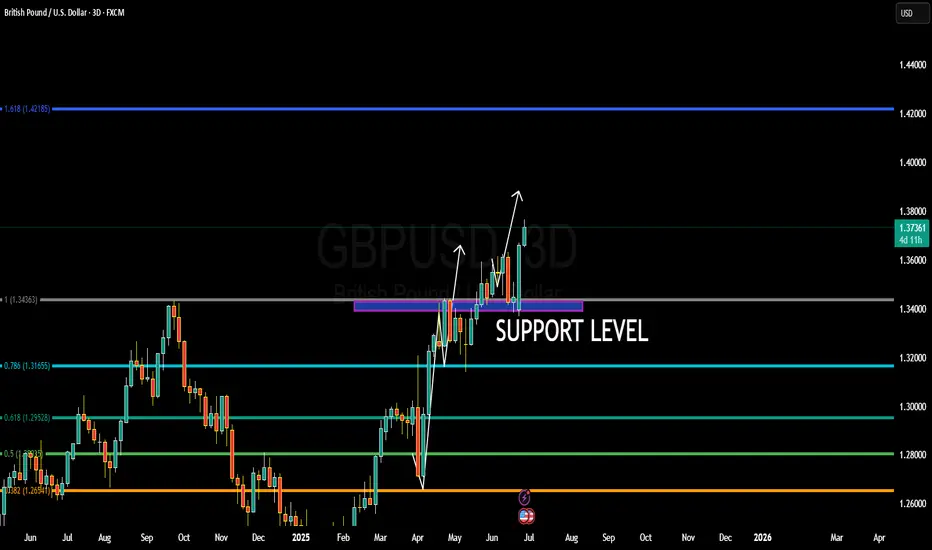
WHY GBPUSD BULLISH ???GBPUSD is unfolding exactly as anticipated, with price now hovering around the 1.3740 region and maintaining strong bullish momentum. Price has successfully bounced from the key support zone near 1.3430, which was previously a major resistance turned into solid demand. This level held firmly during multiple retests, confirming a clean breakout-retest continuation pattern. As long as this structure remains intact, I continue to hold a bullish bias targeting 1.4000 in the coming sessions.
From a fundamental perspective, the British Pound is gaining strength on the back of improved UK economic sentiment. The latest UK inflation data surprised to the upside, pushing annual CPI back above 3%, which reinforces expectations that the Bank of England may need to act sooner rather than later on rate hikes. Markets are now pricing in higher probability of a rate adjustment before the end of Q3 2025. Meanwhile, the US Dollar is under moderate pressure as recent soft labor data and downward revisions in consumer confidence readings have dampened expectations for further tightening from the Fed.
Technically, GBPUSD has cleared major Fibonacci resistance levels and is now forming higher highs and higher lows across the higher timeframes. The current bullish wave is fueled by clean institutional demand and strong price action momentum. If the pair can sustain above 1.3650–1.3680, a swift move toward the psychological 1.4000 handle is highly probable. The 1.4218 Fibonacci extension aligns as a longer-term secondary target for swing traders holding this bullish continuation.
This setup offers a solid blend of macroeconomic backing and technical structure. GBPUSD remains one of the top trending forex pairs right now, favored by strong price action, central bank divergence, and global capital rotation. I'm closely monitoring for intraday pullbacks to add long positions, aiming for extended upside as the market follows through on this bullish breakout continuation.
BTC/USD 1h Chart Analysis: BTFDBitcoin is showing a bullish structure on the 1h timeframe with a potential move towards $109,000.
On smaller timeframes, it exhibits a clear "buy the dip" profile.
Key Levels:
$109,000: Potential upside target.
$107,000: Resistance/Support zone to watch for rejection.
$105,000: Low Volume Node (LVN*) a possible good long entry zone.
$102,000 - $100,000: Support levels to monitor if $105,000 fails.
Currently it have bullish trend with a potential dip near $105,000 showing good entry point.

SatochiTrader Expecting a huge BTC CRASH AFTER This..BTC Market Update by SatochiTrader
EVERY CRASH DID START WITH A FALSE INCREASE TREND.
Depending on the market sentiment and price action, BTC is currently showing strength with a positive trend. However, based on deeper data and insights held by myself and a small group of early-cycle followers, this current movement may be a deceptive signal — potentially foreshadowing a major crash.
This is not trading advice. Those who are confident in the long position should continue, and those on the other side should stay prepared as well.
We have previously explained that the current cycle appears to have ended. Since 2013, BTC has consistently respected its macro cycle targets. The end of such a cycle typically leads to significant corrections.
A cycle ending implies not just a retracement, but the potential for a major crash. Hedge funds and real BTC whales understand the underlying indicators and risks at play. Our expectation remains clear: BTC may soon fall below the 100K level, with $85K identified as a critical support and target zone.
Stay sharp. Stay informed. The market may look bullish — until it isn't.
The best way to follow BTC is not the news.. but the cycle overview.
This update is an education update, which means the high expectations of the upcoming correction for BTC.
Compared to last quarter, miners are now less severely underpaid, though profitability remains low

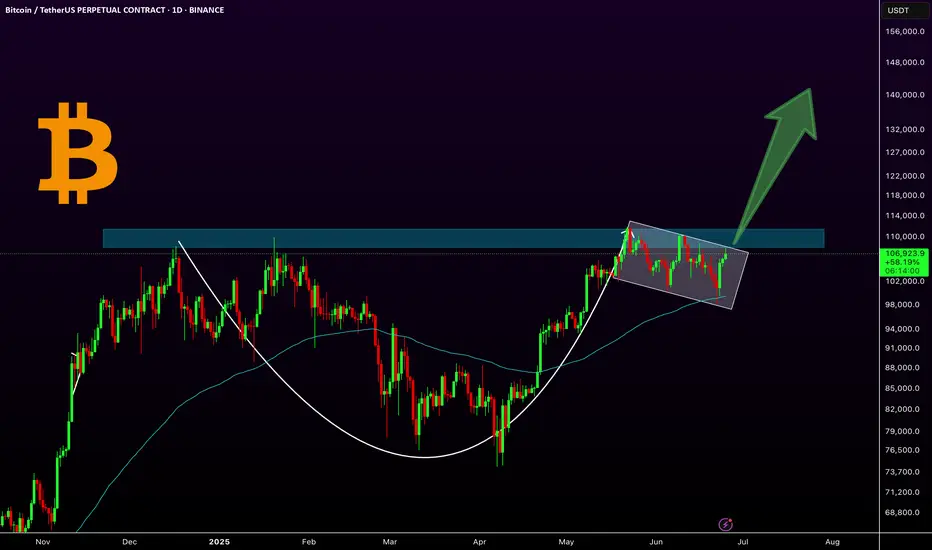
Bitcoin is gearing up for 120K and 140K (1D)The flip zone has been reclaimed, but no proper pullback had occurred. The recent pullback came with a sweep of the all-time high (ATH), which has caused confusion and uncertainty among market participants.
In fact, this drop can be interpreted as a pullback to the flip zone, accompanied by an ATH hunt.
We expect the price, after touching the green zone and forming a base around this level, to move toward the targets of 120K and 140K — which we currently consider as Bitcoin’s final targets for this cycle.
A weekly candle close below the invalidation level would invalidate this analysis.
For risk management, please don't forget stop loss and capital management
When we reach the first target, save some profit and then change the stop to entry
Comment if you have any questions
Thank You

MOVE/USDT – Long-Term Breakout WatchTimeframe: 4H (Long-Term Setup)
MOVE is testing a long-term descending trendline. After months of consistently lower highs, we may be on the verge of a bullish breakout.
The previous breakout attempt in April was a fakeout, but the current consolidation near resistance looks healthier and more sustainable this time.
Key Levels to Watch:
Resistance Levels (Upside Targets):
$0.1446 (Current Zone / Breakout Level)
$0.2265 – Mid-term target
$0.3397 – Key structural resistance
$0.5449 – Long-term target if trend reverses fully
Support Levels:
$0.1312 – Immediate support
$0.1173 – Major long-term base support (strongest defense)
Suggested Stop-Loss:
Below $0.117 (invalidates breakout structure)
Outlook:
If MOVE breaks and holds above the descending trendline, a major trend reversal could follow.
The setup suggests accumulation at the bottom, and volume confirmation will be key.
Patience is crucial — this is a long-term opportunity, not a quick trade. Small caps often move explosively once supply zones are cleared.
DYOR | Not Financial Advice

BTC - 103.5 - 102k when?OKay so the move as marked did move but is choppy, owing to the new pattern, lets see if triple tops are made and is done in a manner where it falls, LIQ shows at 108,800, BTC genuinely looks very very tired!

Next Volatility Period: Around July 2nd
Hello, traders.
If you "Follow", you can always get the latest information quickly.
Have a nice day today.
-------------------------------------
(BTCUSDT 1D chart)
The key is whether it can rise above 108316.90 and find support.
When OBV rises above the High Line, we need to check if the PVT-MACD oscillator switches to above the 0 point.
However, since the StochRSI indicator is currently showing signs of entering the overbought zone, I think there is a high possibility of resistance.
We need to check for support in the 108316.90-111696.21 zone, which is the high point boundary zone.
- If OBV fails to rise above the High Line,
- If the PVT-MACD oscillator fails to remain above the 0 point,
- If the StochRSI indicator falls from the overbought zone and switches to a state where K<D,
It is highly likely that it will eventually encounter resistance in the high point boundary zone and fall.
Therefore, what we need to do is to check for support near 108361.90-108353.0.
If it rises after that, we need to check for support near 111696.21.
Entering a new purchase in the high point boundary section is a very risky transaction.
Therefore, a short and quick response is required when making a purchase.
The basic trading strategy is to buy near the HA-Low indicator and sell near the HA-High indicator.
Do not forget this.
However, since the HA-Low or HA-High indicators are intermediate values, they may move in the opposite direction.
In other words, there is a possibility that the HA-Low indicator will receive resistance and fall, showing a stepwise downtrend, and the HA-High indicator will receive support and rise, showing a stepwise uptrend.
Therefore, you must check whether there is support in the low point boundary section of the DOM(-60) ~ HA-Low section or the high point boundary section of the HA-High ~ DOM(60) section.
To do this, you must trade in a split transaction method.
-
The next volatility period is expected to start around July 2 (July 1-3).
The reason why we calculate the volatility period is because it can be a turning point of the trend.
Therefore, making a new trade during the volatility period means that there is a high possibility of being caught in a fake.
-
Thank you for reading to the end.
I hope you have a successful trade.
--------------------------------------------------
- Here is an explanation of the big picture.
(3-year bull market, 1-year bear market pattern)
I will explain the details again when the bear market starts.
------------------------------------------------------

BTC/USDT – Fakeout Above Rising Channel | Why Clean Breakouts StThis chart highlights an important lesson in breakout trading: Not all breakouts are valid, even when backed by volume.
🔍 Technical Breakdown:
BTC was trading inside a well-respected ascending channel, with multiple touches on both the upper and lower bounds.
Price broke above the channel with a 15-minute candle close and volume, giving the appearance of a clean breakout.
However, shortly after, price re-entered the channel, invalidating the breakout. This is what we call a fakeout or bull trap.
❓ So Why Did the Breakout Fail?
Lack of Follow-Through Buyers:
Despite volume, there wasn’t enough buyer continuation above the breakout level to sustain momentum.
Liquidity Hunt:
The wick beyond the upper trendline likely served to trigger breakout entries and stop losses of short sellers, only to reverse after liquidity was collected.
Key S/R Reaction:
After re-entering the channel, price reacted at a minor horizontal level (previous S/R), attempted another push, but failed again, confirming weakness.

Premium zone tagged — now we watch how the Smart Money reactsBitcoin just tapped into the 108,151 level — the top of a measured premium range and a likely area where profit-taking begins and fresh distribution footprints form.
This run-up wasn’t random. Price surged from inefficiency, cleanly filled the fair value gap (FVG), and is now flirting with a key liquidity pocket.
Here's what the structure says:
Premium reached: 108,151 (0% fib)
If rejection holds, Smart Money looks to discount entries:
0.236: 106,136
0.382: 104,889
0.5: 103,882
Deep retracement zone: 0.618 at 102,874
Final defense for bulls? The unmitigated FVG block between 101,440 → 99,613
Possible Playbook Scenarios:
Quick retrace → higher high:
Bounce off 104,889 or 103,882 before attacking 108,967+
Deeper sweep:
Into 102,874 (0.618) before Smart Money steps in again
Invalidation:
Break below 99,613 closes this bullish narrative and confirms a structural break
TL;DR Execution Logic:
Wait for retracement into 0.5–0.618 fibs
Look for bullish reaction (engulfing or SFP)
Upside targets:
108,151 (retest)
108,967 (liquidity sweep)
Further upside if momentum sustains

1 Year of Bitcoin Bull Run Remaining? In the chart above, we’re analyzing Bitcoin’s historical cycles to see if the current cycle follows a similar pattern.
Bear Run (1 Year): In each of the last three cycles, Bitcoin experienced a bear market lasting exactly 1 year from the all-time high (ATH). This phase saw a significant drop in price as the market corrected.
Bull Run from Bottom (1,064 Days): In the last two cycles, once the bottom was established, Bitcoin entered a consistent bull market that lasted approximately 1,064 days. During this period, the price gradually climbed, eventually reaching new highs.
Current Bitcoin Cycle:
So far, the current cycle appears to be following the same pattern as previous cycles. We’ve already experienced a 1-year bear market after reaching the previous all-time high (ATH).
Currently, we have completed 2 years of a bull run from the bottom, aligning with the 1,064-day bull run observed in past cycles. Based on this historical pattern, we may have 1 year of bull run remaining, which could potentially push Bitcoin to new highs by late 2025.
If this trend continues, it suggests a strong opportunity for growth over the next year, mirroring the end phase of past cycles.
BINANCE:BTCUSDT BITSTAMP:BTCUSD CRYPTOCAP:BTC
Regards
Hexa

BTCUSDT: Bounce Incoming?BTCUSDT Technical analysis update
-March 2024 resistance is now expected to act as a strong support level.
-The price has touched the 0.618 Fibonacci retracement level, suggesting a potential reversal from this zone.
-The 200 EMA on the 2-day chart is positioned as a strong dynamic support, reinforcing the bullish case.
We can expect a bounce from the $72-75k level.

BTC: A Classic Cup & Handle in Play!Bitcoin has formed a classic cup and handle pattern on the daily chart, with the 100 EMA providing solid support during the handle formation. Currently, the price is consolidating in what appears to be a bullish flag or extended handle, just below the key resistance zone around $109K. A breakout above this level could ignite a strong bullish rally toward higher targets like $144k.
Key Highlights:
-Cup & Handle pattern confirmed
-10 EMA acting as dynamic support
-Bullish flag/handle forming near resistance
- A breakout could lead to explosive upside
Regards
Hexa
CRYPTOCAP:BTC BITSTAMP:BTCUSD
Here is an analysis of the latest Bitcoin market trendBitcoin has surged to around $106,700 at its peak and hovered around $104,800 at its low. Overall, the trend remains relatively stable, continuing to stay at a relatively high level. What is driving the market?
First, institutional funds have flowed in again. Recently, many investors have bought Bitcoin through ETFs, with substantial capital inflows, which has formed support for this price level.
Second, the technical outlook is promising. Various technical indicators suggest that it is still a bullish market, meaning the price may continue to rise.
Third, regarding support and resistance levels: if the price declines, it may first find support near $104,000. If it breaks upward, the next target is roughly between $108,000 and $110,000.
What about the short-term trend? If it can break through $107,000, it may then surge toward $109,000 or even the high of $112,000. If it fails to break through, it may fluctuate repeatedly within the range of $104,000 to $106,000 for a period.
you are currently struggling with losses,or are unsure which of the numerous trading strategies to follow,You have the option to join our VIP program. I will assist you and provide you with accurate trading signals, enabling you to navigate the financial markets with greater confidence and potentially achieve optimal trading results.
Trading Strategy:
buy@104300-104800
TP:107000-107500

I don't know why ???Bitcoin is now at a point where it cannot be ignored! In my view, the bullish wave has started after the corrective wave ended. This wave could continue until it breaks the ascending triangle, then with a slight correction, push the price upward again. The current period and the coming days could be crucial in determining the market's trend.
Best regards CobraVanguard.💚

BITCOIN BULL TRAP!!!? IS THIS YOUR SHORT ENTRY TO $44k?I am explaining a potential Bitcoin’s leading diagonal formation, that is forming an UHTF wave 1, that if successfully formed can be a start of the crash towards 44k!

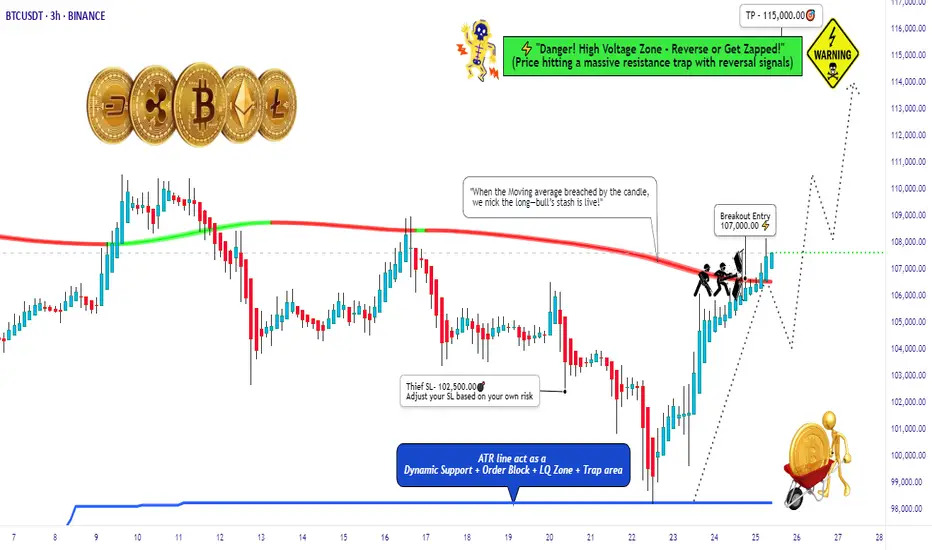
BTC/USD Thief Breakout at $107K – Eyeing $115K!🚨 Thief Entry Setup: BTC/USD Breakout Play 🚨
Overview:
Jump in after the $107 000 breakout—aiming for $115 000 with a tight “Thief SL” at $102 500. Adjust the stop‑loss to match your personal risk tolerance.
🧠 Setup Summary
Pair: BTC/USD
Entry trigger: Breakout above $107 000
Stop‑Loss: “Thief SL” at $102 500 (use your own risk‑based SL)
Target: $115 000
🎯 Why This Setup?
Clear breakout level at $107 000 = fresh momentum
Tight SL cushion (≈‑4.3%) = defined risk
Target ≈ +7.5% potential = strong reward-to-risk (~1.75:1)
📏 Risk Management Tips:
Only risk a small % of your capital—never exceed your comfort zone.
Move your SL to breakeven once mid‑target is hit to lock in profits.
Trailing your stop‑loss could secure bigger gains if BTC surges toward $115 000.
UNEXPECTED RISK CRASH FREE FALL AFTER TREND DATA FOR TH NEXT 48HDepending on our study, BTC has a high chance of a new crash below 100K.
The next 48 hours are important for the trend change of BTC, which can allow the trend to free-fall below 100K
BTC is at a top, and it did recovery always recovered on the M volume top., We are now again on the same trend.
BTC can return below 100K as this update shows, with the possibility of targeting the main target 85K - This is the trend zone for new interest.
The reason for this crash is that BTC has not confirmed the cycle, which means the end of the cycle. There is always possibility that the market can act green, but we expect it can show an unexpected breakdown.

2/1/15I’ve found a fractal on Bitcoin. Today is June 25, 2025, 13:22 — I’m analyzing the 2-hour timeframe from the high on May 22 up to today, and the same pattern of pre-accumulation is forming as in 2024, from March 13 to July 29, 2024.
We are also inside a pattern I named “Dragon’s Wings.” It forms two peaks at the highs after a strong rally, and the shared low between them creates a deep retracement.
Whether this pattern leads to the beginning of a major drop and a bear cycle, or whether it’s a pre-accumulation structure in a buffer zone, depends on the area in which it forms.
In this case, the 93–74K zone is potentially a re-accumulation zone, with a reversal to the upside — possibly taking Bitcoin above $140,000.

Bitcoin Update 25.06.2025 —Altcoins, Top Altcoins Choice & MoreGood morning my fellow Cryptocurrency trader, I hope you are having a nice week and a wonderful day.
We have good news to start today and it is all based on Bitcoin's price action. This is going a bit deep on the daily noise, price swings.
Price action analysis
Bitcoin went deep on its sideways range and tested below 100K. This is normal for a sideways market. The positive news comes from the fact that Bitcoin is once more trading above $106,000 and already hit above $107,000. This type of action reveals a bullish bias.
If the market was mainly bearish with a major drop on the deck, say going below 90K or 80K even, then Bitcoin would not be allowed to go beyond $105,000. In fact, any bounce or small recovery would be quickly sold as bear would be active, waiting and selling each time prices move up.
The fact that Bitcoin can grow day after day and consume all selling pressure while doing so, reveals a strong presence from buyers. We know this to be true because Bitcoin is now in a new phase in its evolution and growth cycle. It is truly a young technology that only now is being fully accepted with plenty of room available for growth.
We have three instances where Bitcoin moved above 110K. The selling that happened afterward is not filled with pressure, instead you can see some standard candles as prices continue to consolidate.
On the other hand, notice the last session from 21-June (21-24 June —3D candles). You can see a long lower shadow, a bullish hammer; there was definitely strong buying pressure as soon as Bitcoin reached below support.
Altcoins market action
Some altcoins continue to produce multi-months high. The highest price since January 2025. These altcoins recovered, started to rise and continue rising in clear, standard bull market fashion. Literally straight up.
Some altcoins did even better and grew as high as December or November 2021. The highest price in almost four years. This is very important when we go deep into the chart and price action because it is the main revealing signal. The altcoins simply do not go on a major bull market before a market crash. If the altcoins are recovering or rallying, it is because the market is set to "buy." The Cryptocurrency market is in bullish mode.
If the market was set to drop long-term then we would be experiencing a rise that is running out of momentum. This rise would later peak and a surprise sudden flash crash would signal the start of a major downturn. This is not what we see.
Inversely, if prices are going to rise strongly we start by seeing some form of retrace or correction, this event losing momentum and volume and then finally a strong bullish jump as soon as support is confirmed. This bullish jump would signal the start of a major market move. This is what we are experiencing today.
Bitcoin & Altcoins
Bitcoin and the altcoins move together. Bitcoin leads the altcoins, the altcoins reveal what Bitcoin will do when the action is sideways.
We can always say that Bitcoin is leading the altcoins of course because Bitcoin has been growing non-stop since November 2022. The major trend being bullish the altcoins are set to follow at some point.
Now, when Bitcoin goes sideways, by definition, anything goes. The market can break-down just as it can break-up. This is where the altcoins become useful.
If smaller Cryptocurrency projects are moving ahead, strongly and even producing 3-4 multi-year highs, it reveals what Bitcoin will do once its consolidation period ends.
Buying Bitcoin
In short, Bitcoin is going up. The next major market move is a rise and we have proof coming from the signals, the altcoins and the charts.
Never again in its history Bitcoin will trade below 80K. 90K soon to be gone... Once the action starts, you will look like a genius for buying below $110,000.
What to choose: Bitcoin or altcoins?
Now, my personal suggestion is different. If you are not a whale, the way to go are the altcoins. Why? Because there is more room for these to grow. We can say that the altcoins are riskier, but risk is almost non-existent with spot. We can simply focus on the pairs that have been filtered by the major exchanges. Reputable pairs with a long track record and plenty of room available for growth. You can't go wrong with those.
If you are ready for the 2025 bull market, leave a comment below.
Altcoins analysis by request
I think it is time for a new Your Top Altcoins Choice, session. It is always wise to do these when the market hits bottom or before a major bullish wave, that's exactly where we are now. If you agree and would like to see a new session, leave a comment saying "Yes! Top Altcoins Choice." If there is enough interest we can work together and find many hidden gems. It can be done with your support.
Namaste.

Bitcoin Roadmap: Key Levels to WatchBitcoin( BINANCE:BTCUSDT ) managed to pump as I expected yesterday , of course, the main catalyst could have been the ceasefire announcement between Iran and Israel , which had a major impact on high and medium risk assets in the financial markets .
Bitcoin is once again moving near the Heavy Resistance zone($110,720-$105,820) and the Resistance zone($107,520-$106,100) after breaking the Resistance lines .
In terms of Elliott Wave theory , it seems that given Bitcoin’s bullish momentum , Bitcoin has completed the main wave 3 and is currently completing the main wave 4 on the 1-hour time frame . The corrective wave structure of wave 4 could be a Double Three Correction(WXY) .
I expect Bitcoin to start rising again near the Support zone($104,380-$103,060) , 50_SMA(Daily) , Support lines , and Cumulative Long Liquidation Leverage($104,412-$103,812) to rise at least to the Potential Reversal Zone(PRZ) and Resistance lines .
Note: Stop Loss(SL)= $102,600 = We can expect more dumps.
Please respect each other's ideas and express them politely if you agree or disagree.
Bitcoin Analyze (BTCUSDT), 1-hour time frame.
Be sure to follow the updated ideas.
Do not forget to put a Stop loss for your positions (For every position you want to open).
Please follow your strategy and updates; this is just my Idea, and I will gladly see your ideas in this post.
Please do not forget the ✅' like '✅ button 🙏😊 & Share it with your friends; thanks, and Trade safe.
