Bitcoin Update: Sell or Wait?Hey traders and investors!
An interesting setup on Bitcoin.
On the 1H timeframe, the market is in a sideways range. The current initiative belongs to the sellers. A clear target is marked on the chart. We also have a seller Decision candle, and a seller zone has formed within its range — a strong signal for short setups.
However, on the daily timeframe, the buyers are still in control, and yesterday’s session closed with increased volume.
On the other hand, Friday also showed a volume spike — but without any meaningful result, and the same happened yesterday.
Sell or not? That’s the question...
The 94,900 level might give us the answer.
This analysis is based on the Initiative Analysis concept (IA).
Wishing you profitable trades!
BTCUSDT

BTC/USDT Technical Analysis. Current Price: ~$94,600
BTC has cleanly broken above the descending trendline resistance, a structure that capped price since mid-February.
This breakout was accompanied by a surge in volume and momentum — a strong bullish sign.
Golden Cross Area
A key technical confluence occurred where the 50-day MA (red) and the 200-day MA (green) were tested simultaneously, marked by the blue circle.
Price moved sharply upward after reclaiming both MAs, suggesting increased buying confidence — a textbook golden cross behavior, even if not a perfect cross yet.
Support & Resistance Flip
Previous resistance at the GETTEX:92K —$93K zone (highlighted in yellow) has now become support.
As long as BTC holds this zone, it suggests healthy consolidation and potential for a continued move up.
Trend Indicators:
50-Day MA (Red): Now curving upward — short-term bullish momentum is building.
200-Day MA (Green): Flattening and starting to rise, showing early signs of a shift in long-term trend direction.
The price is currently above both MAs, which is a key bullish condition.
Key Levels to Watch:
Immediate Resistance: $96,000–$97,500
Major Psychological Barrier: $100,000
Support Zone: $91,500–$92,500
Stronger Support (if broken): $84,000–$85,000 near the MAs
If the price continues to hold above the breakout zone and consolidates well, the next upside target will be $ 100 K.
Failing to hold the GETTEX:92K zone could invite a pullback toward the MAs around $85K — a zone where bulls may step in again.
Final Thoughts:
BTC is showing signs of renewed bullish momentum after breaking key resistance and reclaiming critical MAs. However, confirmation through consolidation and volume is essential to sustain higher levels.
Structure remains bullish unless we see a breakdown below ~$85K with volume.
DYOR. NFA. Stay sharp.

Bitcoin still defying gravity. Can it hold and continueBTC is flagging out at the previously defined point of interest. Although there are signs of bullish divergence market structure has yet to provide enough evidence that a retracement is in effect. However, the chart shows a volume gap below that presents an opportunity.
Full TA: Link in the BIO

BTCUSD:Wait for a breakthroughToday, the price of BTC strongly broke through the threshold of $93,000. Subsequently, it started a rebound trend. After consolidating near $95,500, it failed to further break through the resistance level of $96,000 and dropped back to around $94,000. It may fall again and break below the support level of $93,000.
The breakthrough of these two key price levels will serve as an important dividing line for the subsequent trend of BTC, indicating the direction of its future price movement.
Special Reminder: A number of important economic data will be intensively released this week, and market volatility is likely to increase significantly. It is recommended that everyone trade with caution and strictly control risks.
I am committed to sharing trading signals every day. Among them, real-time signals will be flexibly pushed according to market dynamics. All the signals sent out last week accurately matched the market trends, helping numerous traders achieve substantial profits. Regardless of your previous investment performance, I believe that with the support of my professional strategies and timely signals, I will surely be able to assist you in breaking through investment bottlenecks and achieving new breakthroughs in the trading field.

SOL-Supply & Demand set upCRYPTOCAP:SOL been in up trend these last few weeks. Right now we can see that price is going into supply zone and will see if smart money and volume comes in. Shaking out the weak hands before moving higher.

BTC - NEW ATH on the HorizonBitcoin has surprised us with a sudden turnaround over the past two weeks.
✅ Technical indicators are bullish
✅ Candle stick patterns are bullish
✅ Trendlines are bullish
I can't help but come to any other conclusion - BTC is now BULLISH, likely making it's way to a new ATH.
This will bring about my much anticipated ALTSEASON:
_________________
BINANCE:BTCUSDT

Bitcoin may little correct and then continue to grow in wedgeHello traders, I want share with you my opinion about Bitcoin. Analysing the current chart, the market behaviour becomes much more understandable. Initially, Bitcoin was moving inside a clean upward channel, showing steady growth with rebounds from the support line and multiple corrective phases. After a strong breakout above the buyer zone, the price maintained bullish momentum and reached the current support level at 88500. Later, BTC consolidated within the support area, confirming its role as a springboard for the next impulse move. The price eventually broke higher, leaving the channel behind and forming a new structure, an upward wedge. This wedge is a natural development after a strong uptrend, often suggesting that the price may continue climbing toward the upper boundary before any potential reversals occur. At the moment, BTC is trading between the wedge's support and resistance lines, precisely respecting both structures. Small corrective pull-backs have already been observed, but buyers quickly defended the support area, keeping the bullish structure intact. Given the clear market structure, the strong breakout momentum from the support area, and the continuation pattern in the form of the upward wedge, I expect Bitcoin to continue moving higher toward the 97000 points, which aligns with the resistance line of the wedge. This level also serves as my TP1 for the current bullish move. Please share this idea with your friends and click Boost 🚀

BTCUSD:Ascending Wedge Trend and StrategiesI. Trends and Patterns
From the 4 - hour chart, BTCUSD has shown complex volatility characteristics recently:
1.Consolidation phase: The price oscillated within a narrow range in the early stage, forming a rectangular consolidation pattern. The forces of bulls and bears were relatively balanced, and there was a strong wait - and - see sentiment in the market.
2.Breakout and current pattern: After breaking through the consolidation range, the price moved upward, indicating that the bulls were dominant in the short term. However, it has now entered an ascending wedge pattern - which is a common reversal signal in technical analysis.
- Pattern characteristics: Although the price has been making short - term new highs, the upward slope has gradually flattened, suggesting that the bullish momentum is fading and the bearish momentum is gradually accumulating. Be vigilant against the risk of trend reversal.
II. Key Support and Resistance Levels
S1: $93,000. It is near the lower trend line of the ascending wedge and also a previous pullback low. If the price drops, this could form a strong support. If it is broken, it may open up a downward space, and we need to be vigilant against trend reversal.
S2: $91,500. It is the upper edge of the previous consolidation range. If the price drops significantly, this may form a secondary support to slow down the decline.
R1: $96,000. It is near the upper trend line of the ascending wedge. The price has tested it several times without a valid breakthrough, indicating strong selling pressure here and a significant short - term suppression effect.
R2: $98,000. It is a higher - level resistance target. If the price breaks through $96,000 strongly and holds above it, it may further rise to this level.
III. Trading Strategy Recommendations
1.Bullish strategy:
- Entry conditions: The price finds support near $93,000 (such as the appearance of bullish candlestick patterns like hammer candlesticks), and does not break below this level.
- Target price: $96,000 (testing the upper wedge), and if broken, look towards $97,500.
- Stop - loss setting: Break below $92,500 (below the lower edge of the support level).
2.Bearish strategy:
- Entry conditions: The price effectively breaks below the support level of $93,000 (such as closing below it for two consecutive candlesticks), or encounters resistance and falls back near $96,000 (the appearance of bearish patterns like shooting star candlesticks).
- Target price: $91,500 (the upper edge of the previous consolidation), and if it further drops, it can look towards $86,000.
- Stop - loss setting: Break above $96,500 (above the upper wedge).
3.Risk warnings:
- The reversal signal of the ascending wedge needs to be verified with trading volume (for example, if there is a significant increase in volume during the breakout, the signal is more reliable).
- Pay close attention to fundamental factors such as the expected Fed policy and regulatory dynamics of cryptocurrencies. Be vigilant against breakout movements triggered by unexpected news.
IV. Conclusion
Currently, BTCUSD is in a critical observation period of the ascending wedge. Technical analysis shows that the bullish momentum is waning, and it faces a directional choice in the short term. Aggressive traders can lightly test the waters near support/resistance levels, while conservative traders are advised to wait for clear breakout signals (such as a volume - based breakout of the upper wedge or an effective breakdown of the lower wedge) before entering the market. At the same time, strictly control positions and stop - losses to avoid volatility risks before the pattern is confirmed.

BTCUSD:Ascending Wedge Trend and StrategiesI. Trends and Patterns
From the 4 - hour chart, BTCUSD has shown complex volatility characteristics recently:
1.Consolidation phase: The price oscillated within a narrow range in the early stage, forming a rectangular consolidation pattern. The forces of bulls and bears were relatively balanced, and there was a strong wait - and - see sentiment in the market.
2.Breakout and current pattern: After breaking through the consolidation range, the price moved upward, indicating that the bulls were dominant in the short term. However, it has now entered an ascending wedge pattern - which is a common reversal signal in technical analysis.
- Pattern characteristics: Although the price has been making short - term new highs, the upward slope has gradually flattened, suggesting that the bullish momentum is fading and the bearish momentum is gradually accumulating. Be vigilant against the risk of trend reversal.
II. Key Support and Resistance Levels
S1 : $93,000. It is near the lower trend line of the ascending wedge and also a previous pullback low. If the price drops, this could form a strong support. If it is broken, it may open up a downward space, and we need to be vigilant against trend reversal.
S2 : $91,500. It is the upper edge of the previous consolidation range. If the price drops significantly, this may form a secondary support to slow down the decline.
R1 : $96,000. It is near the upper trend line of the ascending wedge. The price has tested it several times without a valid breakthrough, indicating strong selling pressure here and a significant short - term suppression effect.
R2 : $98,000. It is a higher - level resistance target. If the price breaks through $96,000 strongly and holds above it, it may further rise to this level.
III. Trading Strategy Recommendations
1.Bullish strategy:
- Entry conditions: The price finds support near $93,000 (such as the appearance of bullish candlestick patterns like hammer candlesticks), and does not break below this level.
- Target price: $96,000 (testing the upper wedge), and if broken, look towards $97,500.
- Stop - loss setting: Break below $92,500 (below the lower edge of the support level).
2.Bearish strategy:
- Entry conditions: The price effectively breaks below the support level of $93,000 (such as closing below it for two consecutive candlesticks), or encounters resistance and falls back near $96,000 (the appearance of bearish patterns like shooting star candlesticks).
- Target price: $91,500 (the upper edge of the previous consolidation), and if it further drops, it can look towards $86,000.
- Stop - loss setting: Break above $96,500 (above the upper wedge).
3.Risk warnings:
- The reversal signal of the ascending wedge needs to be verified with trading volume (for example, if there is a significant increase in volume during the breakout, the signal is more reliable).
- Pay close attention to fundamental factors such as the expected Fed policy and regulatory dynamics of cryptocurrencies. Be vigilant against breakout movements triggered by unexpected news.
IV. Conclusion
Currently, BTCUSD is in a critical observation period of the ascending wedge. Technical analysis shows that the bullish momentum is waning, and it faces a directional choice in the short term. Aggressive traders can lightly test the waters near support/resistance levels, while conservative traders are advised to wait for clear breakout signals (such as a volume - based breakout of the upper wedge or an effective breakdown of the lower wedge) before entering the market. At the same time, strictly control positions and stop - losses to avoid volatility risks before the pattern is confirmed.

Bullish Crypto: Top Altcoins Choice —Your Pick (Session 4)You are back!
Are you back are you?
I am getting many new Altcoins requests so let's do a new Top Altcoins Choice session, Your Pick.
Look at this weekly Bitcoin chart, what do you see?
Today is Friday and the session is full green. The action is happening at the top of the candle.
» Can Bitcoin hit $100,000 by next week?
It is possible. Bitcoin can easily grow less than $6,000 in two days.
» Can Bitcoin hit $120,000 before the month ends?
It is possible but not likely, let's be honest.
» Can Bitcoin hit $150,000 in May 2025.
Absolutely, why not, it is actually not that high.
» Can Bitcoin hit $200,000 in this 2025 bull market cycle top?
Bitcoin can hit $180,000, $200,000 or even go beyond.
Look at this weekly chart and tell me in the comments section what do you see?
I see a market that is very strong.
I see bullish action, bears are weak.
Where are the signals that would give strength to a bear in this type of chart? Where is the downside? Where are the negative aspects, it looks green, it is green and ready to grow up and blow.
It is only a matter of time before Bitcoin moves above $100,000 for the second time in its history. The first time of course in December 2024. Then the All-Time High peak, the correction and now we are moving back up.
Are you aware.... Did you know that Bitcoin will never trade back below 80K? I told you buying below 90,000 was a great opportunity, the last chance now to buy below 100,000 before the 2025 bull market bullish wave.
When Bitcoin moves above $100,000 the Altcoins will blow up. The Altcoins are starting to grow now, to recover now but not yet, May 2025 is the month of the Altcoins market maximum growth. Everything will grow, but the Altcoins will grow many times more than Bitcoin because the Alts are smaller, because the correction was stronger on those.
Knowing that the Altcoins market is bullish, recovering a major bottom, set to grow and going green, which one is your Top Altcoin Choice, Your Pick?
Leave a comment with your Choice of Altcoin and I will do an analysis for you, 100% FREE. Choose one pair only and if the chart looks good, I will publish.
Any specific questions leave in the comment, for example: Short-term reversal potential, mid-term targets, All-Time High potential, many signals, chart structure, fundamentals, etc.
Why are you here?
Why are you trading?
How long have you been trading for?
Share some of you; your heart, your mind your soul, share some information about you so that the analysis can be personalized...
Thanks a lot for your continued support.
Let's do a new session of Your Top Altcoins Choice.
Session 4.
Namaste.

Will BTC Correct Before Breaking $96K? CME Gap Still Open!Bitcoin ( BINANCE:BTCUSDT ) moved as it did in the previous post , I hope it was useful for everyone.
Bitcoin is still moving in the upper areas of the Heavy Resistance zone ($95,000-$88,500) , this type of movement does NOT seem to be enough to break Heavy Resistance zone ($95,000-$88,500) , so I still expect a correction .
The volume of Bitcoin's price rebound to the previous high does NOT seem to be sufficient, and even Regular Divergence(RD-) is evident.
According to Elliott Wave theory , it seems that Bitcoin has completed its 5 impulse waves and we should expect another decline . Of course, there is still a possibility that the main wave 4 will be an Expanding Flat(ABC/3-3-5) . But both scenarios can bring us a decline in Bitcoin price .
I expect Bitcoin will NOT be able to break the Heavy Resistance zone ($95,000-$88,500) before the CME Gap($92,525-$91,415) is filled, This is just my analysis of course, considering the above explanation. What do you think?
Cumulative Short Liquidation Leverage: $96,000-$95,095
Cumulative Long Liquidation Leverage: $93,350-$92,551
Cumulative Long Liquidation Leverage: $90,276-$89,160
Note: If Bitcoin goes over $96,100, we can expect more pumps.
Please respect each other's ideas and express them politely if you agree or disagree.
Bitcoin Analyze (BTCUSDT), 1-hour time frame.
Be sure to follow the updated ideas.
Do not forget to put a Stop loss for your positions (For every position you want to open).
Please follow your strategy and updates; this is just my Idea, and I will gladly see your ideas in this post.
Please do not forget the ✅' like'✅ button 🙏😊 & Share it with your friends; thanks, and Trade safe.

We are at the decision line. As you can see, the situation is quite clear. If it supports this decision line, new Ath is on its way. But if it cannot support, a bloodbath is on its way.
* The purpose of my graphic drawings is purely educational.
* What i write here is not an investment advice. Please do your own research before investing in any asset.
* Never take my personal opinions as investment advice, you may lose your money.

Things are going well for Bitcoin.Bitcoin's recent downtrend has been broken upwards. The peak between the two bottoms was broken with high volume.
Bitcoin received strong support from exactly the point I mentioned in my previous analysis titled Bitcoin Decision Point. I think it's quite possible that it will reach the 142k target in my analysis. I recommend you to review the analysis I have provided in the attachment.
However, before this rise, Bitcoin may want to retest the peak between the two buttoms it broke above.
* The purpose of my graphic drawings is purely educational.
* What i write here is not an investment advice. Please do your own research before investing in any asset.
* Never take my personal opinions as investment advice, you may lose your money.

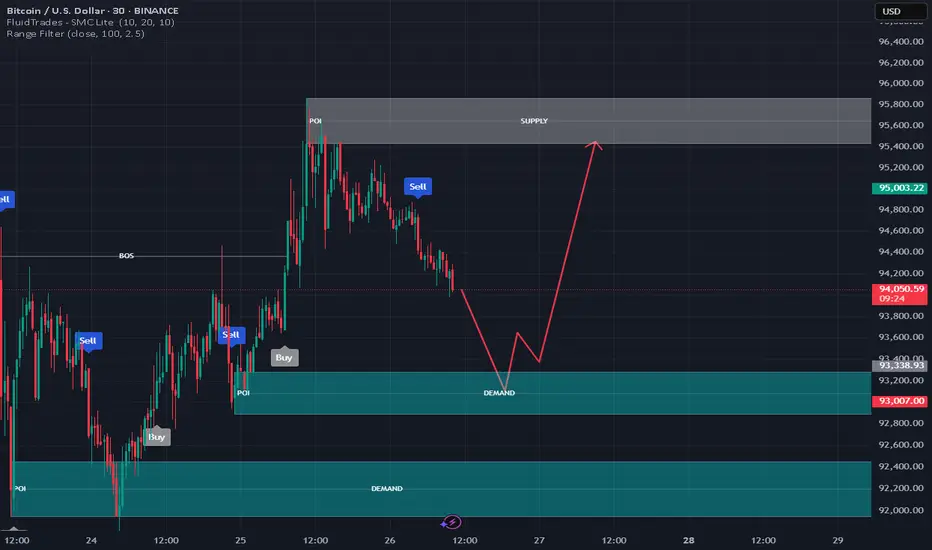
Trade Plan for BTC/USD (30-Minute Timeframe)Market Context:
Price is currently in a downtrend, heading toward a strong demand zone.
There is a major supply zone above where selling pressure previously pushed the price down.
Entry Plan:
🔵 Buy Entry:
Wait for price to tap into the Demand Zone (around 93,000–93,400 USD).
Look for bullish confirmation (e.g., bullish engulfing candle, strong rejection wick, or structure break on lower timeframes like 5-min).
Enter a buy trade once confirmation appears.
🔴 Sell Entry:
If price reaches the Supply Zone (around 95,400–95,800 USD), wait for bearish confirmation (e.g., bearish engulfing, rejection candles).
Consider selling if bearish signs are strong.
Stop Loss:
✅ For Buy Trade:
Below the Demand Zone (~92,800 USD), giving enough room for volatility.
✅ For Sell Trade:
Above the Supply Zone (~95,900 USD).
Take Profit Targets:
🎯 Buy Trade TP:
First Target: Previous minor resistance (~94,600 USD)
Final Target: Supply Zone (~95,400–95,800 USD)
🎯 Sell Trade TP:
First Target: Minor support (~94,600 USD)
Final Target: Back to Demand Zone (~93,400 USD)
Risk Management:
Risk only 1–2% of your trading account per trade.
Adjust position size according to stop loss distance.
Maintain Risk-Reward Ratio of at least 1:2 or better.
Important Reminder:
Always wait for clear confirmation signals before entering. Avoid forcing trades. Manage emotions and stick to your plan!
Bitcoin Bullish Monthlythe bullish April monthly candle is very start of the new bull run on cryptos

BTC/USDTRight now, BTC is at a crossroads. We've completed the weekly Fibonacci retracement and returned to the main trading zone.
It's crucial to hold the key level at 94,400.
If we succeed, the next target is 99–100K for BTC.
At that point, we should watch for a local correction — we likely won't break through 100K on the first attempt.
Altcoins should also catch up accordingly.
Finally, everything looks nice locally, and it's a good time to start building strong swing positions

$ENA/USDT Quick Analysis $ENA/USDT Quick Analysis
ENA has successfully broken its long-term downtrend and retested the $0.30–$0.35 support zone.
Price action is bullish, aiming for a $1.35 target (295% upside).
The breakdown below $0.30 would invalidate the setup
DYOR, NFA

How can beginners use ETFs to catch the next 10× quickly?Introduction to Crypto ETFs
How Crypto ETFs Work?
Future Candidates for ETF Inclusion
Advantages of Crypto ETF Listing
Hello✌
Spend 3 minutes ⏰ reading this educational material. The main points are summarized in 3 clear lines at the end 📋 This will help you level up your understanding of the market 📊 and Bitcoin💰.
🎯 Analytical Insight on Bitcoin: A Personal Perspective:
Bitcoin is currently approaching three strong daily support zones, which perfectly align with key Fibonacci support levels. Based on this setup, I anticipate at least another 6% move to the upside, targeting the 99,700 level — very close to the major daily and psychological resistance at 100K.📈
Now, let's dive into the educational section , which builds upon last week's lesson (linked in the tags of this analysis). Many of you have been eagerly waiting for this, as I have received multiple messages about it on Telegram.
Introduction to Crypto ETFs 📈
In the rapidly evolving world of digital assets, Crypto ETFs (Exchange-Traded Funds) provide a bridge between traditional finance and cryptocurrencies. They allow investors to gain exposure to assets like Bitcoin, Ethereum, and a basket of other cryptocurrencies through regulated stock exchanges, without the need for direct ownership or private wallet management.
How They Actually Work 🔍
Instead of holding company shares, a Crypto ETF holds cryptocurrencies or crypto-related assets. You’re tracking coins like BTC and ETH the same way you’d track the S&P 500, but without direct crypto ownership headaches.
Why Crypto ETFs Are a Big Deal 📈
They make crypto accessible to everyday investors, offer easy diversification across multiple coins, and skip the risk of managing private keys. Great for both beginners and institutions looking for safer exposure.
What’s Inside a Crypto ETF? 🛒
Top picks usually include Bitcoin (BTC), Ethereum (ETH), Binance Coin (BNB), Ripple (XRP), and Litecoin (LTC). Some ETFs even mix in other favorites like Cardano (ADA) and Chainlink (LINK) to broaden the basket.
Future Coins That Could Join the Party 🎉
Beyond BTC and ETH, expect to see DeFi giants like Uniswap (UNI) and Aave (AAVE) show up in future ETFs. Even stablecoins like USDC could sneak in to balance out volatility.
What Makes a Coin ETF-Ready? 🧠
It needs high liquidity, broad investor trust, strong security backing, and, most importantly, regulator approval. Only coins that tick all these boxes are likely to be considered.
Examples You Should Know 🏛️
Purpose Bitcoin ETF (Canada), Grayscale Bitcoin Trust (GBTC), and ProShares Bitcoin Strategy ETF (BITO) are a few leaders. They open crypto markets to a whole new class of investors.
Why Being in an ETF Matters 🌟
Landing inside an ETF boosts a crypto project’s credibility, liquidity, and investor demand. It’s almost like getting a stamp of approval from the traditional finance world.
Not Always Smooth Sailing 🌊
Regulations are still tricky. Compliance isn’t easy. Some coins might not make the cut due to legal hurdles or operational risks. It’s a selective process for a reason.
Final Thoughts: Crypto ETFs Are Just Getting Started 🌐
Crypto ETFs are reshaping the market, creating new bridges between blockchain and Wall Street. As more projects mature and regulations catch up, ETFs could become a dominant force in crypto investing.
However , this analysis should be seen as a personal viewpoint, not as financial advice ⚠️. The crypto market carries high risks 📉, so always conduct your own research before making investment decisions. That being said, please take note of the disclaimer section at the bottom of each post for further details 📜✅.
🧨 Our team's main opinion is: 🧨
Crypto ETFs let you invest in Bitcoin, Ethereum, and other coins through regular stock markets, no wallets needed. 🚀 They make crypto investing safer, easier, and more accessible, while giving you diversified exposure. Top coins like BTC, ETH, and even DeFi tokens are in — but only if they’re liquid, trusted, and regulator-approved. 📈 ETFs boost a crypto’s credibility, liquidity, and adoption, though regulation hurdles still exist. 🌐 Overall, Crypto ETFs are a game-changer, connecting traditional finance with the world of digital assets! 🔥
Give me some energy !!
✨We invest countless hours researching opportunities and crafting valuable ideas. Your support means the world to us! If you have any questions, feel free to drop them in the comment box.
Cheers, Mad Whale. 🐋

Buy@92000 - 93000 TP 95000 - 96000 - 9700096000: This is the resistance level near the upper trend - line of the current ascending wedge. The price has tested this area several times but failed to break through effectively, indicating strong selling pressure at this level 💥.
97500: It is a higher - level resistance target. If the price can strongly break through the 96000 resistance level and continue to rise, it may test this level 🎯.
⚡⚡⚡ BTCUSD ⚡⚡⚡
🚀 Buy@92000 - 93000
🚀 TP 95000 - 96000 - 97000
Accurate signals are updated every day 📈 If you encounter any problems during trading, these signals can serve as your reliable guide 🧭 Feel free to refer to them! I sincerely hope they'll be of great help to you 🌟

Bitcoin (BTC/USDT) 1H – Bullish Until Key Support BreaksHello guys!
Bitcoin continues to move inside an ascending channel after testing the main resistance zone around $95,700. Price action shows a slight correction while respecting the channel structure. Despite a "fake divergence" appearing on the RSI, the main trend remains bullish as long as the $90,900 support holds.
✅ If buyers defend this zone, we could see another leg higher toward the channel top and beyond the main resistance.
⚠️ However, if $90,900 breaks down, it would signal weakness, and short opportunities could emerge with a target toward the $86,400 zone and lower.
Key Levels to Watch:
Support: $90,900
Resistance: $95,700

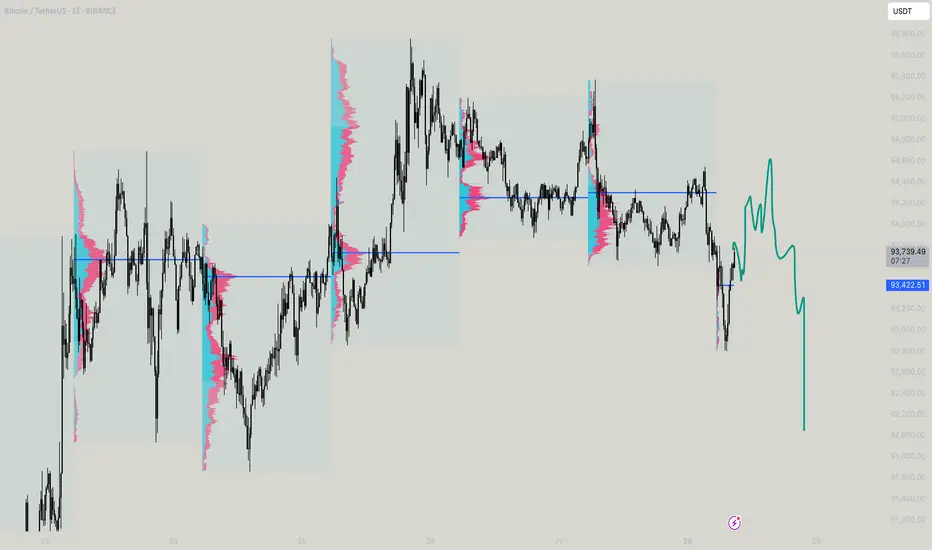
BTC will ever go 100k?
The immediate structure shows aggressive selling pressure — big thin volume zones (where there is less historical volume) are visible between $93,200 and $92,700. If BTC cannot reclaim and close strongly back above $93,900–$94,100 (preferably closing inside the old VA), the path of least resistance remains downward toward $92,500 first and even $91,700–$91,500 eventually.
In simple words: as long as BTC stays under $93,900, the market is favoring shorts, not longs. Quick bounces can happen, but they are more likely to get sold off unless a very strong reclaim happens. Bulls need to urgently push back above $94,100 to reattempt upside momentum, otherwise downside expansions toward lower value zones remain active.
TL:DR - Observe!
Bitcoin Weekly, Bullish Continuation ConfirmedDid you know... Look what is happening right now on this chart, it is an amazing and incredible development you are going to love it and you are going to love me for showing it to you. It confirms everything I've been saying for the past few months.
The week closes today within three hours and this is the first time that Bitcoin closes green three consecutive weeks in the year 2025.
Three green (bullish-positive) sessions is a classic bullish signal called the three white soldiers in candlestick reading parlance. In normal terms, based on simple fact straight in your face TA, it is the first time this event happens in 2025 period. Why it didn't happen before and that's because the market was bearish. Why it is happening now it is because the market is no longer bearish and turned bullish.
Three green candles with Bitcoin moving higher but that's not all, the third candle which is the current candle is about to close full green and the biggest candle of 2025. When a strong big candle appears it only confirms what comes next.
Now, you can allow for retraces, whatever... The week has seven days. Next week the whales can trick you with a small retrace followed by huge growth. But the whales are not stupid, they cannot take the risk of selling tons and people buying everything when prices are low.
Think long-term.
Bitcoin is set to grow above $150,000 in the coming months. So, any buying below $100,000 is a super discount, below $95,000 it is just too good to pass up. So no, nobody is ready to sell we are ready for growth.
The signal is in. The fact that the market remains green while the Altcoins grow confirms that Bitcoin will produce a bullish continuation as the next major move, going up, for sure.
What will you do? Will you follow will you trust?
Will you go the other way and support the people that are saying that Bitcoin will crash when Bitcoin has been growing since November 2022?
Bitcoin is going up.
The correction is over.
The bottom is in.
It will be a massive rise lasting more than 6 months.
Are you ready for the strongest bullish action you've seen in your life?
I am.
Thanks a lot for your continued support.
Namaste.

BTC Weekly Analysis – Potential Retracement & Next TargetsAnalysis & Thought Process:
Bitcoin is currently at a critical juncture on the weekly timeframe. Having observed recent bullish momentum, the price now faces resistance around the 95,900–96,700 range. If BTC manages to clearly reverse from this resistance area, it could propel upwards to test psychological resistance at the significant 100K level within the coming days.
However, careful analysis indicates the presence of a Fair Value Gap (FVG) between 89–90K. Such imbalances in price action typically attract price retracements to achieve market efficiency. Thus, I anticipate a correction back down to the 89–90K area, which would represent an ideal zone to consider a long swing position.
Trade Idea:
Short-term bearish scenario: Look to short from current resistance levels (around 95,900–96,700) targeting the 89–90K FVG area.
Long swing setup: If BTC retraces and holds the 89–90K region, it presents an attractive area for swing long entries aiming back towards and beyond current resistance areas.
PLAN NOT VALID IF
If the price fails to hold 89K, the next logical areas to watch for support are lower down at the 82–78K range, followed by a deeper pullback potentially extending towards 74K.
Profit Targets & Stop Losses:
Short trade: Entry around 95,900–96,700, profit target at 89–90K, stop loss set slightly above the resistance (e.g., 97.5K).
Long trade: Entry at 89–90K, profit targets initially back to 96–100K. Stop loss placed just below the 88K area.
This analysis is for informational purposes only and does not constitute financial advice. Please perform your own due analyse before entering any trades.
