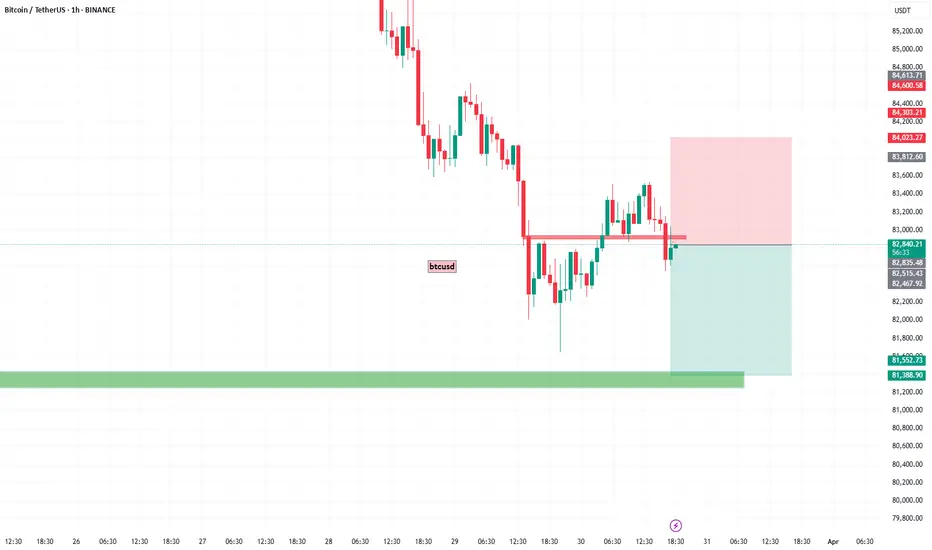
TC/USD Bearish Flag Breakdown Targeting 81,660 Support ZoneThis is a 1-hour BTC/USD (Bitcoin/US Dollar) chart showing a bearish setup. Here's the breakdown:
---
Key Observations:
1. Bearish Rejection Zone (Purple Box - ~83,174.62):
Price is showing rejection at a key resistance zone.
Both the 30 EMA and 200 EMA are above current price, adding downward pressure.
2. EMA Analysis:
30 EMA (Red Line): ~83,174.62 – acting as dynamic resistance.
200 EMA (Blue Line): ~83,715.92 – strong long-term resistance.
Price is below both EMAs, reinforcing bearish sentiment.
3. Pattern Analysis:
Bearish flag/wedge breakdown has already occurred.
Target projection based on measured move suggests a ~1.44% downside.
Anticipated drop towards 81,660.29, which aligns with prior support zone.
4. Price Action:
Recent breakdown from a small rising channel (bear flag).
Pullback to resistance (purple zone) seems complete, and continuation downward is expected.
---
Strategy Summary:
Bias: Bearish
Entry Zone: Near 83,174.62 (already rejected)
Target: 81,660.29
Stop Loss Idea: Above 83,715.92 (EMA 200)
Btcusdtanalysis

BITCOIN SEEMS TO FOLLOW THIS PATH TOWARDS 120k !!!According to elliott wave count, If BTC has completed it's macro wave (IV), then we can expect it moving to complete it's macro wave (V).
In this case if recently impulse move is counted as micro wave (i), then we can expect reversal from 81-79K region very soon.
Otherwise, if micro count gets Invalid, then reversal can be expected from up to 76-70k .
Important key level is breakout of 95k which would confirm reverse in trend.

"Bitcoin vs Tether" Crypto Market Heist Plan (Swing Trade)🌟Hi! Hola! Ola! Bonjour! Hallo! Marhaba!🌟
Dear Money Makers & Robbers, 🤑 💰💸✈️
Based on 🔥Thief Trading style technical and fundamental analysis🔥, here is our master plan to heist the BTC/USDT "Bitcoin vs Tether" Crypto Market. Please adhere to the strategy I've outlined in the chart, which emphasizes long entry. Our aim is the high-risk Red Zone. Risky level, overbought market, consolidation, trend reversal, trap at the level where traders and bearish robbers are stronger. 🏆💸"Take profit and treat yourself, traders. You deserve it!💪🏆🎉
Entry 📈 : "The heist is on! Wait for the MA breakout (87000) then make your move - Bullish profits await!"
however I advise to Place Buy stop orders above the Moving average (or) Place buy limit orders within a 15 or 30 minute timeframe most recent or swing, low or high level.
📌I strongly advise you to set an alert on your chart so you can see when the breakout entry occurs.
Stop Loss 🛑:
Thief SL placed at the recent/swing low level Using the 2H timeframe (83000) swing trade basis.
SL is based on your risk of the trade, lot size and how many multiple orders you have to take.
🏴☠️Target 🎯: 93000 (or) Escape Before the Target
🧲Scalpers, take note 👀 : only scalp on the Long side. If you have a lot of money, you can go straight away; if not, you can join swing traders and carry out the robbery plan. Use trailing SL to safeguard your money 💰.
BTC/USDT "Bitcoin vs Tether" Crypto Market Heist Plan (Swing Trade) is currently experiencing a bullishness,., driven by several key factors.
📰🗞️Get & Read the Fundamental, Macro, COT Report, On Chain Analysis, Sentimental Outlook, Intermarket Analysis, Future trend targets.. go ahead to check 👉👉👉
📌Keep in mind that these factors can change rapidly, and it's essential to stay up-to-date with market developments and adjust your analysis accordingly.
⚠️Trading Alert : News Releases and Position Management 📰 🗞️ 🚫🚏
As a reminder, news releases can have a significant impact on market prices and volatility. To minimize potential losses and protect your running positions,
we recommend the following:
Avoid taking new trades during news releases
Use trailing stop-loss orders to protect your running positions and lock in profits
💖Supporting our robbery plan 💥Hit the Boost Button💥 will enable us to effortlessly make and steal money 💰💵. Boost the strength of our robbery team. Every day in this market make money with ease by using the Thief Trading Style.🏆💪🤝❤️🎉🚀
I'll see you soon with another heist plan, so stay tuned 🤑🐱👤🤗🤩

#BTC SHORT-TERM UPDATES!🔥 CRYPTOCAP:BTC is forming a bullish falling wedge on the 12H chart!
Price is compressing inside a key pattern —a breakout could send it flying!
Support is holding strong, and volume is cooking up!
Are you ready for the move?
CRYPTOCAP:BTC BITSTAMP:BTCUSD BINANCE:BTCUSDT

Bitcoin (BTC/USD) – Bearish Breakdown & Key Levels to WatchMarket Overview:
Bitcoin is trading at $84,185, showing a +1.63% increase. The price action suggests a potential breakout towards the upside.
🔹 Chart Structure:
BTC has been consolidating in a range-bound structure after a sharp upward move.
Previous rising wedge patterns led to corrections, but the price is holding key support levels.
A breakout setup is forming with a target towards $88,500 – $90,000.
🔹 Key Levels to Watch:
✅ Resistance: $85,249, $86,934, $88,500, $90,000
✅ Support: $82,000, $81,400
🔹 Potential Trade Setup:
📈 Bullish Scenario:
If BTC holds above $84,000, a push towards $86,500 – $88,500 is likely.
A breakout above $88,500 could lead to $90,000+.
📉 Bearish Scenario:
If BTC rejects $85,000, a pullback to $82,000 – $81,400 may occur before another move up.
🔹 Conclusion:
Bias: Bullish above $84,000
Target: $88,500 – $90,000
Invalidation: Below $81,400
Would you like a more detailed trade plan with stop-loss and entry points? 🚀

Bitcoin (BTC/USD) 4H Chart Analysis – Professional BreakdownBitcoin (BTC/USD) 4H Chart – Detailed Professional Analysis
This chart presents a Rectangle Pattern, a common consolidation structure in technical analysis. The price has been oscillating between a well-defined resistance level near $88,000 - $89,000 and a support level around $80,000 - $81,000. This pattern suggests an upcoming breakout, with bearish continuation being the most probable scenario.
Understanding the Rectangle Pattern
A rectangle pattern forms when price moves sideways, trapped between two horizontal levels. Traders watch for a breakout in either direction to determine the next trend. In this case, Bitcoin has tested the resistance multiple times but failed to break above, indicating strong selling pressure. Meanwhile, support has been retested several times, which weakens its strength over time.
A bearish breakdown is likely because:
Buyers appear unable to push past resistance, showing exhaustion.
Support has been tested multiple times, which increases the chance of a breakdown.
The dotted black trendline is now being tested, and a break below it would further confirm bearish momentum.
Trade Setup for a Breakdown
A short trade becomes valid only if Bitcoin breaks below the $81,000 - $82,000 support zone with strong momentum. The price must close below this level to confirm the move.
How to Enter the Trade?
Look for a strong bearish candle close below the $81,000 - $82,000 range.
If Bitcoin retests this broken support (now acting as resistance), this can be a secondary short entry point.
Once confirmation is seen, open a short position.
Stop Loss Placement
To protect against false breakouts, a stop loss should be set above the $88,457 resistance zone. If the price moves back into the rectangle and surpasses this level, it means the bearish setup is no longer valid.
Profit Target and Trade Expectation
The expected take profit target is $73,541. This is calculated using the measured move projection, meaning the height of the rectangle is subtracted from the breakdown point. If Bitcoin reaches this level, the trade will have successfully captured the bearish momentum.
Market Psychology Behind This Move
The repeated failure to break above resistance ($88,000 - $89,000) signals weak buying interest. Buyers have been stepping in at support, but each retest of the $80,000 - $81,000 zone makes it more vulnerable.
Once support finally breaks, several factors will accelerate the move:
Long positions will be forced to sell, increasing selling pressure.
Breakout traders will enter new short positions, pushing price further down.
Liquidity below support will be triggered, causing Bitcoin to fall sharply toward the $73,541 target.
Invalidation Scenario (Bullish Case)
If Bitcoin breaks above $88,000 - $89,000 and holds, the bearish setup becomes invalid. In that case:
The price would shift into a bullish continuation pattern.
Traders should avoid shorting and instead look for buying opportunities above resistance.
Final Thoughts
This is a high-probability bearish setup, but patience is key—wait for confirmation before entering.
Risk management is crucial : The stop loss at $88,457 ensures that losses are minimized if the market moves against the trade.
If Bitcoin remains inside the rectangle, traders can buy at support and sell at resistance until a breakout occurs.

BTCUSDT:Test support, go long on pullbackBitcoin has also experienced a rapid decline due to the tariff remarks of the U.S. government. It is currently testing a key support level. If it continues to fall and breaks below 81,126, a bearish trend will be confirmed. If this support level is not breached, one can initiate long positions at the low level.
Trading Strategy:
buy@81500-82500
TP:83500-84500
Get daily trading signals that ensure continuous profits! With an astonishing 90% accuracy rate, I'm the record - holder of an 800% monthly return. Click the link below the article to obtain accurate signals now!

BTCUSD hourly trend analysis for April 04, 2025It is in a bearish trend. Sell signal has confirmed the Stop Loss at 83382. This pair has a strong support at 82074 and 80900.

Bitcoin (BTC/USD) Technical Analysis: Breakout or Rejection at K200 EMA (Blue Line): 84,124 – This is a long-term trend indicator.
30 EMA (Red Line): 83,925 – A short-term trend indicator.
Key Levels
Resistance Point: Around 83,925 (marked in blue).
Support Zone: Around 82,184 (Stop Loss zone).
Target Point: 88,197, indicating a potential 6.34% upside.
Potential Trade Setup
Scenario 1 (Bullish Case):
If price breaks above resistance (83,925) and EMA 200, then a move towards 88,197 is expected.
A breakout confirmation might lead to an uptrend continuation.
Scenario 2 (Bearish Case):
If price rejects at resistance (83,925) and falls back below the support zone (82,184), a downward move could happen.
Pattern Analysis:
The chart suggests a potential accumulation phase before a breakout.
Possible retest of resistance before a rally.
Conclusion
Bullish above 83,925, targeting 88,197.
Bearish below 82,184, with potential downside.
Price action near the 200 EMA is crucial for the next move.

BTCUSDT:The long position strategy has reaped profits successfulAs I had anticipated, Bitcoin (BTC) has started to recover. BTC has successfully broken through the 86,500 mark and even reached 87,000. The long position strategy has achieved profitability.
Currently, Bitcoin still maintains a bullish trend. It is advisable to wait for a price pullback and then initiate long positions.
BTC Trading strategy:
buy@84500-85500
TP:86500-87500
Get daily trading signals that ensure continuous profits! With an astonishing 90% accuracy rate, I'm the record - holder of an 800% monthly return. Click the link below the article to obtain accurate signals now!

Bitcoin (BTC/USD) Reversal? Rising Wedge Breakdown Signals Sell! The chart suggests a potential bearish move after a rising wedge pattern breakdown.
Key Observations:
Rising Wedge Breakdown:
BTC formed a rising wedge, which is a bearish reversal pattern.
The price has broken down from this wedge, indicating a potential downtrend.
Support and Resistance Levels:
Resistance Zone: Around $88,188 – $88,792, marked as a key level where selling pressure may increase.
Support Zone: Around $85,368 – $84,226, where buyers may step in.
Target: $81,429 – $81,258, a strong support level where price could drop.
Bearish Setup:
The chart suggests a sell opportunity near resistance, expecting a downward move toward the target zone.
Trading Idea:
Entry: Sell near $88,000 after confirmation.
Target: $81,429 – $81,258 (support zone).
Stop-Loss: Above $89,991 (resistance zone).
This setup suggests Bitcoin could decline further, making it a potential short trade opportunity. However, traders should watch for confirmation and overall market sentiment before executing trades.

BTCUSDT:started to recover!!As I stated in my previous idea, the entire bearish trend is merely a well-structured catalyst. Its function is to attract breakout sellers, create the illusion of a sustained downward trend, and trap liquidity at the low points before the true direction becomes apparent. Retail traders who short this structure are providing momentum for the next upward rally.
BTC has started to recover. Today, it directly surged to around 85,500. Currently, Bitcoin still maintains a bullish trend. It is advisable to wait for a price pullback and then initiate long positions.
BTC Trading strategy:
buy@83500-84500
TP:85500-86500
Get daily trading signals that ensure continuous profits! With an astonishing 90% accuracy rate, I'm the record - holder of an 800% monthly return. Click the link below the article to obtain accurate signals now!

BTC:Start to recoverBTC broke below 83,000 and continued to decline, reaching around the lowest level of 82,000. Currently, it generally shows a downward trend.
In my opinion, the entire bearish trend is merely a well-structured catalyst. Its function is to attract breakout sellers, create the illusion of a sustained downward trend, and trap liquidity at the low points before the true direction becomes apparent. Retail traders who short this structure are providing momentum for the next upward rally.
Before that, BTC can still be regarded as bullish, and each pullback to the demand zone can be considered as an opportunity to go long.
BTC Trading strategy:
buy@82000-82500
TP:83000-85000
Get daily trading signals that ensure continuous profits! With an astonishing 90% accuracy rate, I'm the record - holder of an 800% monthly return. Click the link below the article to obtain accurate signals now!

BTCUSD Trading StrategyBTCUSD has experienced a significant decline. While the indicators have yet to show signs of stabilization or a trend reversal, the price action on the candlestick chart indicates that there is support in the range of 82,000-80,000. Therefore, I believe it is an opportune moment to position for a long trade within this range, exercising patience as we await a price rebound to achieve the TP1/TP2 targets.

Bullish medium termBINANCE:BTCUSDT.P may go 95K range again after a correction to 78K
DISCLAIMER: This is not a trading advice. Do your own research.

BTCUSD hourly chart projection till April 03, 2025BTCUSD looks bearish with the given Support and Resistance levels. Once the Dynamic Signal confirms the sell entry with stop loss and targets, that makes the best point to enter into the trade.

BTC:Anticipate an upward movementBTC broke below 83,000 and continued to decline, reaching around the lowest level of 82,000. Currently, it generally shows a downward trend.
In my opinion, the entire bearish trend is merely a well-structured catalyst. Its function is to attract breakout sellers, create the illusion of a sustained downward trend, and trap liquidity at the low points before the true direction becomes apparent. Retail traders who short this structure are providing momentum for the next upward rally.
Before that, BTC can still be regarded as bullish, and each pullback to the demand zone can be considered as an opportunity to go long.
BTC Trading strategy:
buy@82000-82500
TP:83000-85000
Get daily trading signals that ensure continuous profits! With an astonishing 90% accuracy rate, I'm the record - holder of an 800% monthly return. Click the link below the article to obtain accurate signals now!

BTCUSDT SELL/ SHORTBy utilizing Fibonacci retracement levels, historical patterns, , we can formulate a hypothesis that the market might follow a similar trajectory if bearish sentiment prevails.
"Bitcoin Breakout Setup: Potential Rally Towards $94K!"Key Observations:
Support Zone: A crucial support level is marked below the broken channel, indicating a potential area for a price reversal.
Bullish Projection: A breakout above this support level could push BTC higher towards the target price of 94,101.24 USD.
Technical Patterns: The price initially showed a strong downtrend, followed by a recovery forming an ascending channel, and now a potential bullish breakout is expected.
Trading Plan:
Bullish Scenario: If BTC holds above the support level, a strong move upwards toward 94,101.24 USD could be expected.
Bearish Scenario: A failure to hold support could result in further downside toward lower key levels.
Conclusion:
Traders might look for buying opportunities near the support zone with a potential upside target of 94,101.24 USD while managing risk in case of further breakdown.
Would you like to refine this further or add specific indicators? 🚀

BTCUSDT FALLING WEDGE PATTERN IN 30-M TFI Created This BTCUSDT Chart Analysis In 30-M Tf
Entry: BUY from 83300
Support zone : 83000 / 82600
Target Will Be : 85300
BINANCE:BTCUSDT Going to Uptrend and Already take support,

BTC:Seize the opportunity to go long
BTC broke below 83,000 and continued to decline, reaching around the lowest level of 82,000. Currently, it generally shows a downward trend.
In my opinion, the entire bearish trend is merely a well-structured catalyst. Its function is to attract breakout sellers, create the illusion of a sustained downward trend, and trap liquidity at the low points before the true direction becomes apparent. Retail traders who short this structure are providing momentum for the next upward rally.
Before that, BTC can still be regarded as bullish, and each pullback to the demand zone can be considered as an opportunity to go long.
BTC Trading strategy:
buy@82000-82300
TP:83000-85000
Get daily trading signals that ensure continuous profits! With an astonishing 90% accuracy rate, I'm the record - holder of an 800% monthly return. Click the link below the article to obtain accurate signals now!

BTCUSDT 1WBTC ~ 1W Analysis
#BTC I hope this is the last decline, Bitcoin is tired of the current decline. Selling pressure is decreasing we think.

BTCUSDT:Consider going long at a lower priceIt can be seen from the chart that BTC has successfully broken through the support level of 86,000 over the past few days and has approached the historical resistance level. We can monitor the latest support level around 83,500. If this level is not broken through within a short period of time, one may consider initiating a long position at a relatively low price.
BTC Trading strategy:
buy@83500-84000
TP:86500-87500
Get daily trading signals that ensure continuous profits! With an astonishing 90% accuracy rate, I'm the record - holder of an 800% monthly return. Click the link below the article to obtain accurate signals now!
