Bitcoin: Bullish Momentum Tests 109k, Eyes 110k
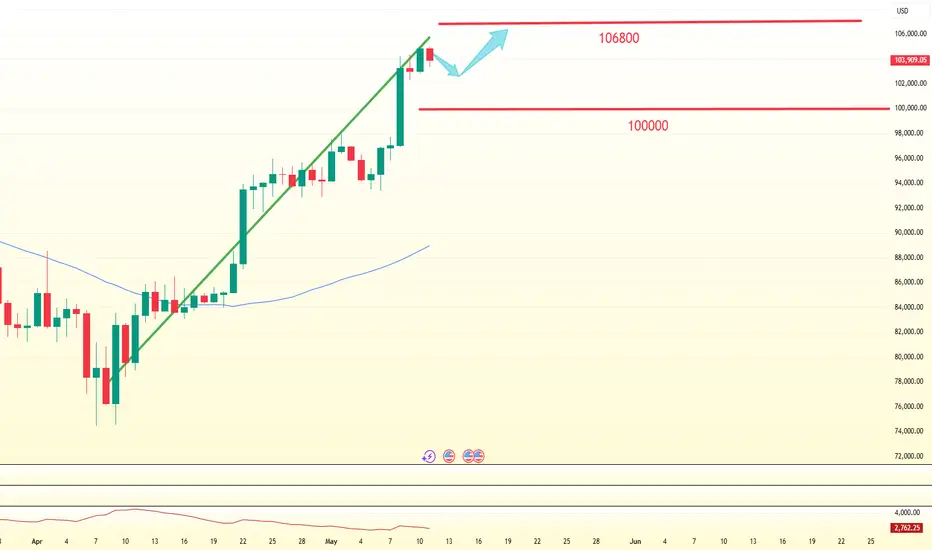
The Bitcoin price fluctuated in a narrow range near the 106,000 level 😊. After touching the 106,800 level, it failed to break through the 107,000 resistance level and subsequently fell back to consolidate near the 106,200 level 😐. Shortly after, the bulls regained momentum, pushing the price rapidly higher to hit a high of 109,410 🚀! Currently, the price is consolidating near the 109,100 level 🔄.
From a technical perspective, the 107,000 resistance level has turned into support after being broken, with short-term momentum favoring the bulls 👊. If the price can hold above 109,000, it may further challenge the psychological barrier of 110,000 🌟. However, caution is warranted regarding potential pullbacks from high levels 🚨. Key support below lies in the 107,000–106,200 range ⚠️.
For trading strategies: Short-term traders may consider light-position entry after the price stabilizes above 109,000, targeting 110,000 🎯. If the price pulls back and holds at the 107,000 support level, dip-buying opportunities may emerge 💰. Medium-term investors should adjust positions flexibly based on whether the 110,000 level is breached 📊.
Overall, market sentiment remains optimistic 😃, but attention should be paid to trading volume confirmation and unexpected news events 📢. Strict risk control and cautious operations are recommended ⚖️!
Buy@108000-108500
tp:109500-110500
Professional trading strategies are pushed daily 📊
Lock in precise signals amid market fluctuations 🚀
Confused about market trends? Stuck in strategy bottlenecks?
Real-time strategies serve as your "trading compass" 🌐
From trend analysis to entry/exit points, dissect market logic comprehensively
Refer now 📲
Help you move steadily forward in investments ✨
👇👇👇
Btcusdtanalysis

Shorting Analysis on Bitcoin - Fxdollars- {15/04/2025}Educational Analysis says that BTCUSD may give countertrend opportunities from this range, according to my technical analysis.
Broker - BITSTAMP
So, my analysis is based on a top-down approach from weekly to trend range to internal trend range.
So my analysis comprises of two structures: 1) Break of structure on weekly range and 2) External pushback to fill the remaining fair value gap
Let's see what this pair brings to the table for us in the future.
Please check the comment section to see how this turned out.
DISCLAIMER:-
This is not an entry signal. THIS IS ONLY EDUCATIONAL PURPOSE ANALYSIS.
I have no concerns with your profit and loss from this analysis.
I HAVE NO CONCERNS WITH YOUR PROFIT OR LOSS,
Happy Trading, Fx Dollars.

BTC Volatility Range Shifts Upward: Focus on Shorting The volatility range is moving upward, rising from 101,500–105,000 to 104,000–107,000 📈. It’s advisable to focus on shorting at higher levels ⏬. Currently, BTC is still in a range-bound fluctuation—just control your trade position sizes properly, and there won’t be any major issues essentially 😊!
⚡⚡⚡ BTCUSD ⚡⚡⚡
🚀 Sell@107000 - 106000
🚀 TP 104500 - 103500
👇Accurate signals are updated every day 📈 If you encounter any problems during trading, these signals can serve as your reliable guide 🧭 Feel free to refer to them! I sincerely hope they'll be of great help to you 👇

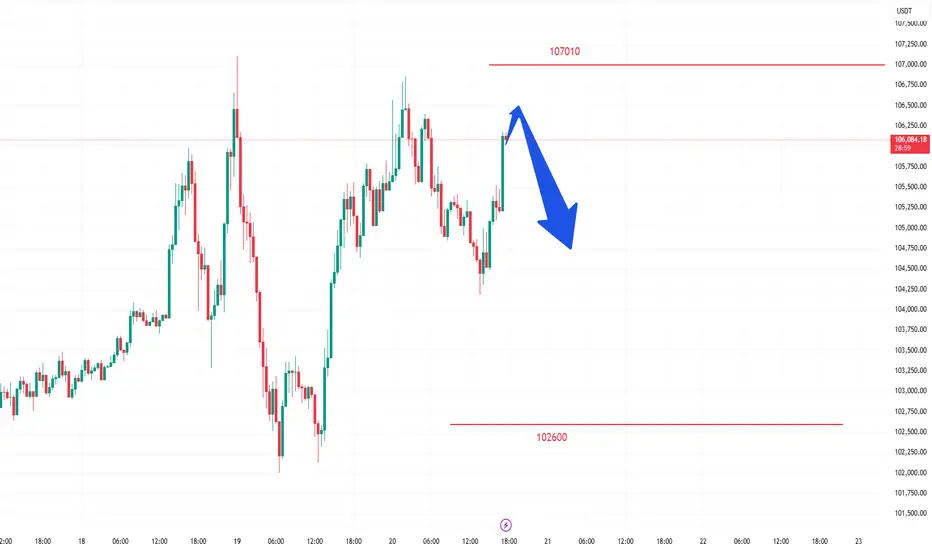
BTC - Short term playsAnalysis of today's BTC trend:
• Daily timeframe: Closed with a small bearish candle yesterday, showing a single bearish-bullish pattern. The price is consolidating at high levels, failing to sustain the breakout after news-driven highs, indicating a short-term range-bound oscillation.
• Hourly chart: The resistance at the high of 107,000 area (double top resistance), and the support at the low of 102,000 area (double bottom support), with an obvious range-bound pattern.
Short-term contract trading strategy:
1. Short position: Short at 105,800, stop loss at 106,300, target at 104,500.
2. Long position: Long at 104,500, stop loss at 104,000, target at 106,000.
In the market, there are no absolutes, and neither upward nor downward trends are set in stone. Therefore, the ability to judge the balance between market gains and losses is your key to success. Let money become our loyal servant.
Still bullish, it is recommended to focus on going long.Earlier, Bitcoin reached a weekly high of $106,518 before pulling back due to market liquidation, with total market liquidations exceeding $669 million. Bitcoin has closed higher for five consecutive weeks on the weekly chart, forming a "higher highs and higher lows" upward pattern, rising nearly 43.75% from its recent low. However, it encountered resistance near the all-time high of $109,588 and failed to break through. Currently, Bitcoin is trading in the $100,000-$110,000 range, with strong support at $100,000 and $90,000, and key resistance at $110,000.👉👉👉
After Bitcoin previously broke through $105,500, the moving averages showed an upward trend, and the RSI was in the overbought zone, indicating strong bullish momentum.
Overall, under the combined influence of news and technical factors, the Bitcoin market on May 19th showed a short-term volatile but long-term optimistic trend. Investors need to closely monitor changes in key support and resistance levels, as well as the impact of market news, and make investment decisions cautiously.
BTCUSD Trading Strategy
buy @ 102500-102700
sl 101000
tp 103800-104000
If you think the analysis helpful, you can give a thumbs-up to show your support. If you have different opinions, you can leave your thoughts in the comments. Thank you for reading!👉👉👉

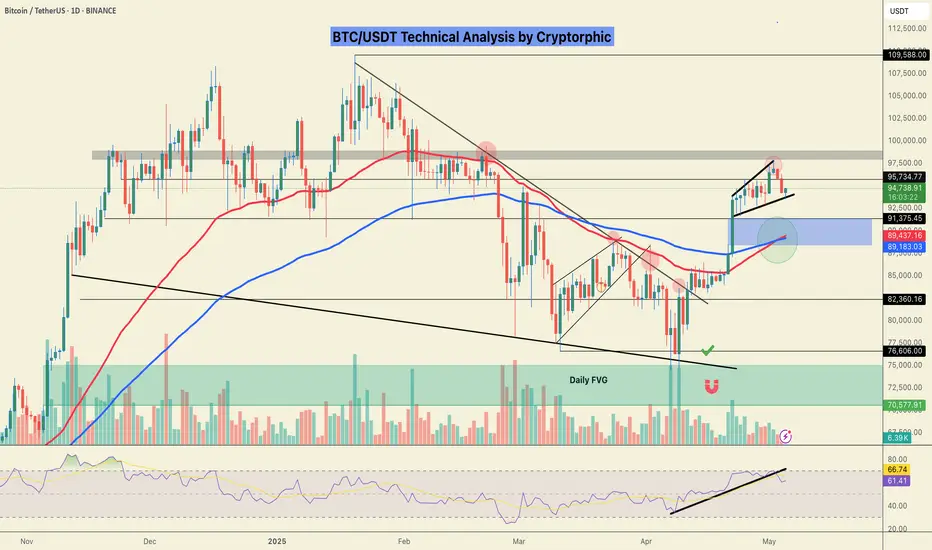
Bitcoin still has strong supportThe RSI index is in a neutral-to-strong zone but has retreated from earlier levels, indicating that short-term upward momentum has weakened. The MACD indicator still maintains a bullish pattern, though the height of the bars has decreased. The price remains well above both the 50-day and 200-day moving averages, with the medium-to-long-term upward channel intact, keeping the overall structure in a strong bull market. However, there are signs of a potential short-term pullback.👉👉👉
On the daily chart, the Bitcoin price remains above the long-term trend breakout point since April. The 20-day moving average is at $103,260, forming a direct resistance level, while the 50-day moving average at $101,904 coincides with a key support level. As long as the Bitcoin price stays above this dynamic range, bulls still have opportunities.
In view of the current market conditions, short-term trading is recommended for investors to closely monitor the breakthrough of key support and resistance levels. If the price pulls back to the $100,000-$101,000 range and finds support, while forming daily K-line doji or long lower shadow patterns, appropriate position increases can be considered, with targets set at $105,000. After a breakthrough, the target can be further adjusted to $110,000. At the same time, due to market uncertainties and short-term pullback risks, investors should control their position sizes and avoid excessive leverage and blind chasing of gains or panic selling.
BTCUSD Trading Strategy
buy @ 102500-102700
sl 101000
tp 103800-104000
If you think the analysis helpful, you can give a thumbs-up to show your support. If you have different opinions, you can leave your thoughts in the comments. Thank you for reading!👉👉👉

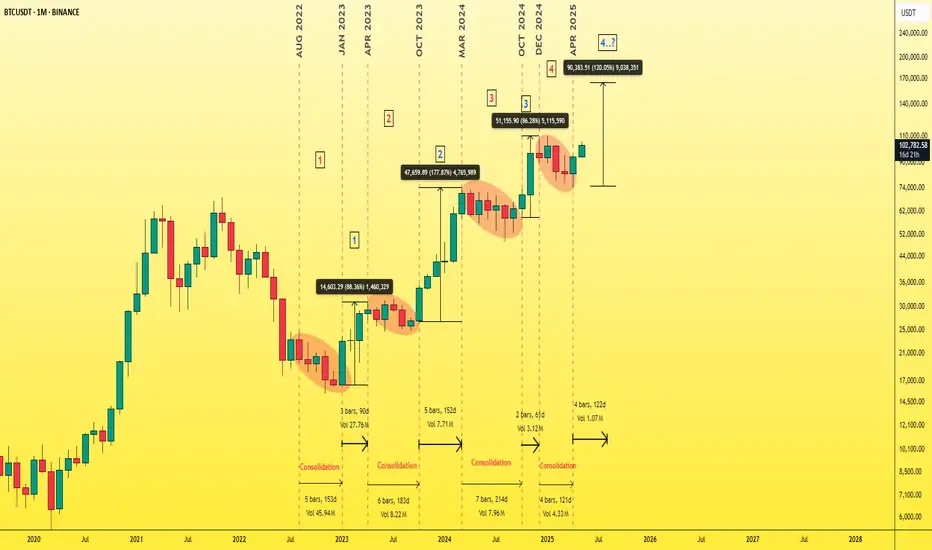
Bitcoin - An unusual chart!Over the past 3 years, I’ve noticed that Bitcoin has been moving in a consistently bullish pattern, as shown on the chart.
After breaking out of the red ellipse shape, Bitcoin tends to rally strongly—and that’s usually the signal for altcoins to follow. We’ve now broken out of this ellipse, and it looks like the real bullish move is just beginning.
In this chart, I’ve tried to illustrate both the potential upside ahead of us and the estimated timeframe in which this move could unfold.
I’ve divided the chart into segments from August 2022 to April 2025.
🔸The red numbers 1, 2, 3, 4 indicate periods of consolidation.
🔸The blue numbers 1, 2, 3, 4 represent strong Bitcoin and altcoin rallies that follow the breakouts.
While the exact percentage gains and time durations may vary, if we take the average, we can estimate the upcoming move to be around 120%, taking Bitcoin to around $165K.
Similarly, the average time duration for each bullish move has been approximately 120 days.
[b ]Welcome to the bull market.
Best Regards Ceciliones 🎯
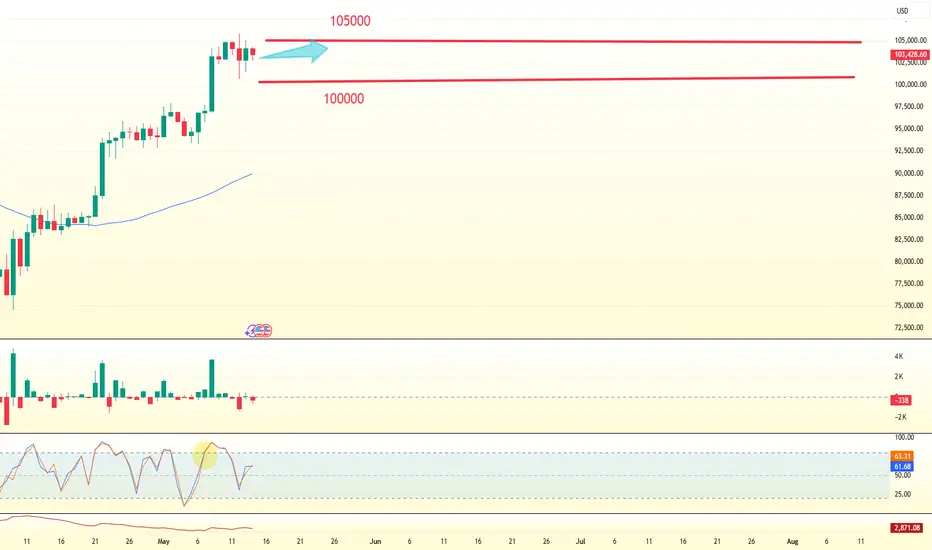
Bitcoin remains in high-level fluctuationsThe price of Bitcoin has generally remained above $103,000 today, demonstrating strong support. In the short term, after experiencing previous fluctuations, Bitcoin is currently in a relatively stable upward trend and continues to move towards higher prices.👉👉👉
Global economic events have contributed to the rise of Bitcoin. The decision between China and the U.S. to temporarily reduce tariffs has improved investor confidence and encouraged market risk appetite, making funds more willing to flow into risky assets like Bitcoin.
From a technical perspective, Bitcoin is in a strong upward trend. The RSI is above 70, indicating that Bitcoin may be in an overbought state in the short term. This could lead to a slight pullback or sideways consolidation in the upcoming market to digest excessive buying pressure. Investors need to pay attention to potential pullback risks, while closely monitoring factors such as macroeconomic data, policy changes, and market capital flows to adjust investment strategies in a timely manner.
BTCUSD Trading Strategy
buy @ 102700-103000
sl 101000
tp 104000-104200
If you think the analysis helpful, you can give a thumbs-up to show your support. If you have different opinions, you can leave your thoughts in the comments. Thank you for reading!👉👉👉

Bitcoin Breaks Wedge! Correction Coming Before Next Leg?The bitcoin spot ETF has seen net inflows for 20 consecutive days. BlackRock's IBIT has attracted more than $69 million in a single day, and the total inflow scale has exceeded $5 billion. The strong institutional allocation demand provides strong support for the price of bitcoin. The 4 - hour - level RSI (49) is approaching the neutral zone and shows a pattern of lower highs, indicating that the buying momentum is weakening. The MACD histogram remains negative, indicating short - term correction pressure. At the same time, the price has formed a double - top pattern near $105,000, and the Fibonacci resistance at $109,396 suppresses the upward space. Market expectations for a rate cut in June have cooled (with a probability of 65%). If the relevant economic data exceeds expectations, a stronger US dollar may suppress the price of bitcoin.
you are currently struggling with losses, or are unsure which of the numerous trading strategies to follow, at this moment, you can choose to observe the operations within our channel.
Bitcoin remains fluctuating at a high levelThe overall market trend is largely in line with my analysis chart. Today, the Bitcoin market shows a pattern of high-level fluctuations and a slight decline. The RSI index is 40.47, having retreated from the overbought area, indicating short-term pullback pressure. However, although the momentum of the MACD indicator has weakened, it still maintains a bullish trend.Moreover, the price is far above both the 50-day moving average and the 200-day moving average, and the medium- and long-term upward channel remains intact, with the overall market in a strong bullish structure.
The operation suggestion is mainly to go long on the pullback, and patiently wait to enter the market at the key position.👉👉👉
BTCUSD Trading Strategy
buy @ 103000-103200
sl 101000
tp 104200-104500
If you think the analysis is helpful to you, you can give a thumbs-up to show your support. If you have different opinions, you can leave your thoughts in the comments. Thank you!👉👉👉

#BTC/USDT Bullish Crossover in Play!CRYPTOCAP:BTC Update: Bitcoin is currently holding support and showing signs of strength with a bullish EMA crossover — the 50 EMA crossing above the 100 EMA, which historically signals upward momentum based on past fractals.
The lower support zone is marked in blue, in case the price dips further.
Immediate resistance remains at the GETTEX:98K level — a confirmed close above this could trigger a move toward $103K.
Stay tuned for more real-time updates.
Do hit the like button if you like it, and share your views in the comments section.
Thank you
btcusdt - short i thinq time to short?
Push like if you think this is a useful idea!
Before to trade my ideas make your own analysis.
Write your comments and questions here!
Thanks for your support!

BTCUSDTHello traders.
The first trade of the week will be from BTCUSDT.
The pair drew a lot of attention over the weekend with strong bullish momentum. Some analysts are even suggesting it could rise to 106,000 USD during the week.
However, the crypto market is currently very volatile. Despite that, I'm activating a trade based on my system.
🔍 Criteria:
✔️ Timeframe: 15M
✔️ Risk-to-Reward Ratio: 1:2
✔️ Trade Direction: Buy
✔️ Entry Price: 104000.00
✔️ Take Profit: 104596.14
✔️ Stop Loss: 103702.15
🔔 Disclaimer: This is not financial advice. It's a trade I’m taking based on my own system, shared purely for educational purposes.
📌 If you're also interested in systematic and data-driven trading strategies:
💡 Don’t forget to follow the page and subscribe to stay updated on future analyses.

Bitcoin is expected to maintain its upward trend throughout nextAgainst the backdrop of an unstable global macro and geopolitical environment, the resilience of Bitcoin will continue to be tested. The escalating geopolitical tensions between India and Pakistan pose a risk of evolving into a full-scale conflict. Meanwhile, the Federal Reserve finds itself in a dilemma between employment and inflation and has no immediate intention of cutting interest rates. Although the Trump administration's tough rhetoric on tariffs has somewhat softened, the market is still awaiting a clear direction for its trade policy. Based on these factors, it is expected that Bitcoin is likely to continue to fluctuate within the range of $70,000 to $109,000 in the coming two months.
you are currently struggling with losses, or are unsure which of the numerous trading strategies to follow, at this moment, you can choose to observe the operations within our channel.
BTCUSDT - High placed ? What's next ??#BTCUSDT - Market placed a very reasonable high so far.and doing to mature his selling turn
Keep close and if market tholda his current high region them we can expect a drop from here.
Region is around 104300 to 105100
Don't be lazy here n try to understand the market current pattern.
Good luck
Trade wisely

BTC/USDT Crypto Heist - Bullish Breakout Blueprint!🔥 Thief Trading Style: BTC/USDT Bullish Heist Plan 🔥
Greetings, Money Makers & Market Robbers! 🤑
Ready to execute a daring heist in the Bitcoin vs. Tether (BTC/USDT) crypto market? 📈 Our Thief Trading Style combines technical precision and fundamental insights to target a bullish breakout. Follow this charted strategy to ride the wave and exit before the risky Red Zone. Let’s grab those profits together! 💪🎯
---
📊 Trade Setup: The Heist Plan
- Market: BTC/USDT (Crypto) 🌐
- Bias: Bullish Breakout 🌟
- Timeframe: 1D (Swing Trade) ⏰
Entry 📈:
- Breakout Entry: Wait for a clean breakout above the Moving Average (MA) at 108000. Place Buy Stop orders just above 108000 to seize the momentum. 🚀
- Pullback Entry: For lower-risk entries, set Buy Limit orders at the recent 15M/30M swing low (e.g., 105000-106000) to catch pullbacks. 📍
- Trader Tip: Set a TradingView alert for the 108000 breakout to stay ahead of the move! 🔔
Stop Loss 🛑:
- Breakout Traders: After the breakout confirms, place your Stop Loss below the recent 1D swing low at 96000 to guard against reversals. ⚠️
- Pullback Traders: Tailor your Stop Loss to your risk appetite (e.g., 1-2% of account). Adjust based on lot size and multiple orders. 📏
- Risk Alert: This heist is high-stakes! Stick to disciplined position sizing to protect your capital.🔥
Target 🎯:
- Aim for 122000, near the risky Red Zone (an overbought area prone to consolidation or reversal). 🏴☠️
- Exit Strategy: Consider taking profits early if bearish signals (e.g., high volume, reversal candles) emerge near 122000. 💸
Scalpers 👀:
- Stick to Long-side scalps with tight trailing stops. Join swing traders for the full heist or scalp quick moves if your capital allows. 💰
---
📡 Why This Heist Has Potential
BTC/USDT is in a neutral trend with strong bullish prospects, driven by:
- Technicals: A breakout above the 108000 MA, backed by higher lows on the 1D chart, signals robust momentum. 📊
- Fundamentals: Institutional buying and positive crypto sentiment (check COT reports) fuel upside potential. 📰
- Seasonal Trends: Bitcoin often rallies in Q2, aligning with our setup. 📅
- Intermarket Factors: USD weakness and altcoin strength could lift BTC higher. 🌎
---
⚠️ Risk Management: Secure Your Gains
- News Caution: Skip new trades during major news events (e.g., CPI, FOMC) to avoid volatility spikes. 🗞️
- Trailing Stops: Use trailing Stop Loss to lock in profits as price nears 122000. 🔒
- Position Sizing: Limit risk to 1-2% of your account per trade for a safe heist. 🚨
---
💥 Power Up the Heist! 💥
Join our Thief Trading Style crew by liking, commenting, and following for more high-energy trade plans! 🚀 Your support strengthens our market raids, helping us profit with precision. Let’s conquer BTC/USDT together! 🤝🏆🎉
Stay Sharp: Another heist plan is on the horizon. Keep your charts locked and loaded, traders! 🐱👤😎
#BTCUSDT #Bitcoin #Crypto #Bullish #SwingTrading #Breakout

BTC/USD) Resistance level pullback Read The ChaptianSMC Trading point update
Technical analysis of Bitcoin (BTCUSDT), highlighting key levels and potential price movements based on trend channels, support/resistance, and RSI. Here's the breakdown:
---
Key Elements in the Analysis:
1. Trend Channel:
BTC is trading within an ascending channel, indicating an ongoing bullish trend.
The recent price action hit the upper boundary (resistance) of the channel, suggesting potential for a pullback.
2. Resistance Zone:
105,586.06 is marked as a resistance level, where price faced rejection.
Strong reaction here suggests sellers are defending this area.
3. Support Zone:
A new support level is established around 98,000.
This zone aligns with the lower boundary of the ascending channel and previous breakout structure.
4. Target Point (Bearish Projection):
The chart projects a potential drop to the 97,367.51 level, representing a ~7.4% correction.
This move mirrors the prior leg up, applying a measured move concept.
5. RSI Indicator:
RSI is around 66–71, indicating overbought conditions.
A bearish divergence or trendline break on RSI suggests weakening momentum.
Mr SMC Trading point
---
Summary of Trading Idea:
Bias: Short-term Bearish (correction within an overall bullish trend)
Expected Move: Potential dip toward 97,367.51 support
Confirmation: Rejection at resistance, RSI divergence, and trendline break
Invalidation: A strong breakout above 105,586.06 would nullify the correction setup and favor continued bullish movement
pelas support boost 🚀 analysis follow)

Will Bitcoin Break This Resistance – Or Is It a Bull Trap?MARKETSCOM:BITCOIN is once again at a critical resistance level, and the crypto world is split.
Some believe we’re gearing up for a new all-time high (ATH), while others argue the top is already in—and this could be a classic bull trap in disguise.
The key lies in how price reacts to this zone.
• A breakout above $109K would confirm a new ATH and likely spark another leg up.
• But a strong rejection here might signal that the rally was a trap, echoing patterns we’ve seen in past cycles.
My Take: We’re at a make-or-break moment. Confirmation from this level will decide the next big move.
What’s your take—breakout or bull trap?
Please support this idea with a LIKE👍 if you find it useful🥳
Happy Trading💰🥳🤗

BTCUSDT: Drops Towards $53000 region may help us hitting $80000.BINANCE:BTCUSDT price currently in making of AB=CD pattern, it is likely to touch and reject at the $53000 which area remain crucial for most of the swing investors. The following news we can significant impact in the crypto market also 50k to 53k area remain extremely bullish. With accurate entry at 530000 area when we can target 80-100k possibly.

BTCUSDT: Safe Zone Vs Risk Zone, Which one would you choose? Dear Traders,
WE have possible buying opportunities, with the first entry, the only reason that we think that price would reverse is, possible end of year bullish push which may take price to another record higher high. Although, since the price already has rejected we think price is unlikely to reject at the level, and may drop to 75k region.
good luck.

#BITCOIN: Another drop and then Swing Bounce $125,000The current market sentiment is bearish, indicating a potential further decline towards the 65k price point. However, we anticipate a rebound towards the 125k region. As we approach the 65k threshold, we expect a substantial price increase.
To make informed investment decisions, it is crucial to observe a strong bullish trend before considering any bullish entries.
For more insights and market analysis, please like and comment.🚀❤️
Team Setupsfx_

#BTCUSDT: Will Bitcoin Make Any Correction To $90,000?Hey Everyone,
Happy Sunday
Currently, Bitcoin’s price is consolidating within a shorter timeframe, which has heightened the likelihood of it reaching the $90,000 ‘FVG’ region. However, this could be attributed to the hectic week we experienced, with numerous significant market announcements that have heightened uncertainty in the cryptocurrency market. At present, there are two opportunities for Bitcoin: one is riskier, while the other is considerably safer. You can utilise this analysis as a secondary bias.
We extend our best wishes and good luck in your trading endeavours. Your unwavering support is greatly appreciated.
If you wish to contribute, here are several ways you can assist us:
- Like our ideas
- Comment on our ideas
- Share our ideas
Team Setupsfx_🚀❤️

BTCUSD longterm up trendThis analysis is based on the weekly chart.
The evolution of wave N is very beautiful.
First is the breaking of the all-time high.
Then comes the important levels such as 110K, 120K and 130K.
