"Bitcoin vs Tether" Crypto Market Heist Plan (Swing/Day)🌟Hi! Hola! Ola! Bonjour! Hallo! Marhaba!🌟
Dear Money Makers & Robbers, 🤑 💰💸✈️
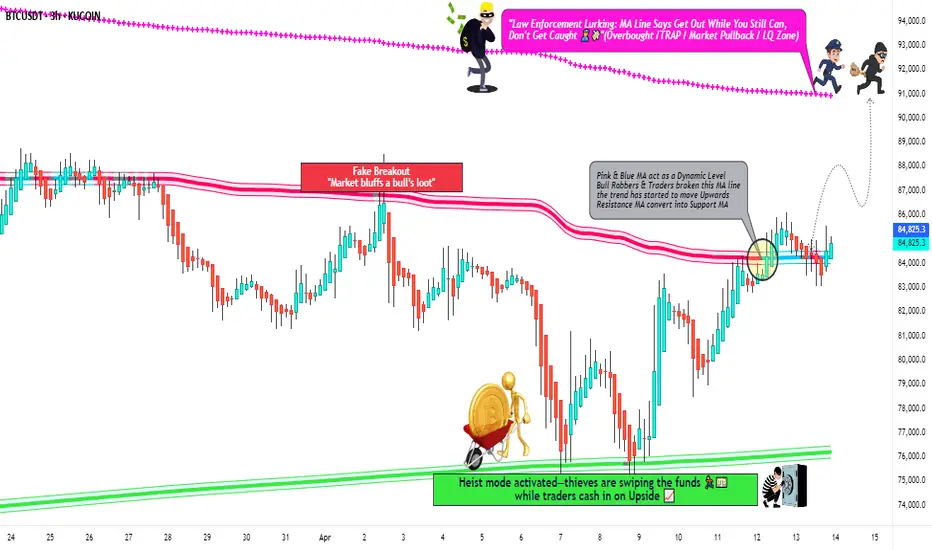
Based on 🔥Thief Trading style technical and fundamental analysis🔥, here is our master plan to heist the BTC/USDT "Bitcoin vs Tether" Crypto Market. Please adhere to the strategy I've outlined in the chart, which emphasizes long entry. Our aim is the high-risk MA Zone. Risky level, overbought market, consolidation, trend reversal, trap at the level where traders and bearish robbers are stronger. 🏆💸"Take profit and treat yourself, traders. You deserve it!💪🏆🎉
Entry 📈 : "The vault is wide open! Swipe the Bullish loot at any price - the heist is on!
however I advise to Place buy limit orders within a 15 or 30 minute timeframe nearest or swing low or high level for pullback entries.
Stop Loss 🛑:
Thief SL placed at the recent/swing low level Using the 30mins timeframe (81000) Day trade basis.
SL is based on your risk of the trade, lot size and how many multiple orders you have to take.
🏴☠️Target 🎯: 91000 (or) Escape Before the Target
🧲Scalpers, take note 👀 : only scalp on the Long side. If you have a lot of money, you can go straight away; if not, you can join swing traders and carry out the robbery plan. Use trailing SL to safeguard your money 💰.
BTC/USDT "Bitcoin vs Tether" Crypto Market Heist Plan (Swing/Day) is currently experiencing a bullishness,., driven by several key factors. 👇👇👇
📰🗞️Get & Read the Fundamental, Macro, COT Report, On Chain Analysis, Sentimental Outlook, Intermarket Analysis, Future trend targets... go ahead to check 👉👉👉🔗
⚠️Trading Alert : News Releases and Position Management 📰 🗞️ 🚫🚏
As a reminder, news releases can have a significant impact on market prices and volatility. To minimize potential losses and protect your running positions,
we recommend the following:
Avoid taking new trades during news releases
Use trailing stop-loss orders to protect your running positions and lock in profits
💖Supporting our robbery plan 💥Hit the Boost Button💥 will enable us to effortlessly make and steal money 💰💵. Boost the strength of our robbery team. Every day in this market make money with ease by using the Thief Trading Style.🏆💪🤝❤️🎉🚀
I'll see you soon with another heist plan, so stay tuned 🤑🐱👤🤗🤩
Btcusdtbinance
BTC/USDT "Bitcoin vs Tether" Crypto Market Bearish Heist Plan🌟Hi! Hola! Ola! Bonjour! Hallo!🌟
Dear Money Makers & Robbers, 🤑 💰🐱👤🐱🏍
Based on 🔥Thief Trading style technical and fundamental analysis🔥, here is our master plan to heist the BTC/USDT "Bitcoin Tether" Crypto Market. Please adhere to the strategy I've outlined in the chart, which emphasizes short entry. Our aim is the high-risk Green Zone. Risky level, oversold market, consolidation, trend reversal, trap at the level where traders and bullish robbers are stronger. 🏆💸Book Profits Be wealthy and safe trade.💪🏆🎉
Entry 📈 : The heist is on! Wait for the breakout of (94000) then make your move - Bearish profits await!"
however I advise placing Sell stop below the support line or Sell limit orders within a 15 or 30 minute timeframe. Entry from the most recent or closest low or high level should be in swing/retest.
I highly recommend to use alert in your trading platform.
Stop Loss 🛑: Thief SL placed at 97000 (swing Trade Basis) Using the 4H period, the recent / swing high or low level.
SL is based on your risk of the trade, lot size and how many multiple orders you have to take.
Target 🎯: 86500 (or) Escape Before the Target
🧲Scalpers, take note 👀 : only scalp on the Short side. If you have a lot of money, you can go straight away; if not, you can join swing traders and carry out the robbery plan. Use trailing SL to safeguard your money 💰.
📰🗞️Fundamental, Macro, COT, Sentimental Outlook:
The BTC/USDT "Bitcoin Tether" Crypto Market is currently experiencing a Neutral trend (there is a higher chance for Bullishness).., driven by several key factors.
🌟☀ Fundamental Analysis
Institutional adoption (e.g., MicroStrategy) remains strong, but ETF outflows (650.8M last week) signal caution.
Hash rate near all-time highs supports network security; post-2024 halving supply reduction is a bullish long-term factor.
Pro-crypto US regulatory shifts are positive, though global uncertainty persists.
🌟☀ Macro Economics
Potential US rate cuts in 2025 could weaken USD, boosting BTC; tighter policy may pressure it.
Recession fears in Europe vs. US resilience create mixed risk sentiment; BTC correlates with equities.
Geopolitical tensions enhance Bitcoin’s store-of-value appeal.
🌟☀ Commitments of Traders (COT) Data
Large speculators slightly net long, showing cautious optimism; no extreme positioning.
Hedgers net short, typical for futures; retail longs are moderate, not overcrowded.
🌟☀ On-Chain Analysis
Exchange outflows exceed inflows (ratio ~0.98), indicating accumulation.
Long-term holders steady, short-term holder realized price at 96,000 acts as support.
Whale activity mixed: some profit-taking, but accumulation persists below 97,000.
🌟☀ Market Sentiment Analysis
Retail sentiment neutral, cautious on X; no extreme greed or fear.
Institutional hesitancy (ETF outflows) offsets professional traders’ accumulation views.
🌟☀ Positioning
Support at 96,000, resistance at 98,500-99,000; liquidity pools suggest breakout potential.
RSI (~50) neutral, MACD shows fading bearish momentum.
🌟☀ Overall Summary Outlook
Short-term: Consolidation between 94,000-100,000, slight upward bias.
Medium-term: Bullish if macro aligns (104,000-110,000); downside risk to 90,000.
Long-term: Fundamentals favor 120,000 by mid-2025.
⚠️Trading Alert : News Releases and Position Management 📰 🗞️ 🚫🚏
As a reminder, news releases can have a significant impact on market prices and volatility. To minimize potential losses and protect your running positions,
we recommend the following:
Avoid taking new trades during news releases
Use trailing stop-loss orders to protect your running positions and lock in profits
📌Please note that this is a general analysis and not personalized investment advice. It's essential to consider your own risk tolerance and market analysis before making any investment decisions.
📌Keep in mind that these factors can change rapidly, and it's essential to stay up-to-date with market developments and adjust your analysis accordingly.
💖Supporting our robbery plan will enable us to effortlessly make and steal money 💰💵 Tell your friends, Colleagues and family to follow, like, and share. Boost the strength of our robbery team. Every day in this market make money with ease by using the Thief Trading Style.🏆💪🤝❤️🎉🚀
I'll see you soon with another heist plan, so stay tuned 🤑🐱👤🤗🤩

BTC/USDT "BITCOIN/TETHER" Crypto Market Bullish Heist PlanOla! Bonjour! Hi! Hallo!
Dear Money Makers & Robbers, 🤑 💰
Based on Thief Trading style technical analysis, here is our master plan to heist the BTC/USDT "BITCOIN/TETHER" Crypto market. Please adhere to the strategy I've outlined in the chart, which emphasizes long entry. Our aim is the high-risk Red Zone. Risky level, overbought market, consolidation, trend reversal, trap at the level where traders and bearish robbers are stronger. So Be Careful, wealthy and safe trade.
Entry 📈: You can enter a trade anywhere,
however I advise placing buy limit orders within a 15 or 30 minute timeframe. Entry from the most recent or closest low level should be in retreat.
Stop Loss 🛑: Using the 2H period, the recent / nearest low level.
Goal 🎯: 118.100
Scalpers, take note: only scalp on the long side. If you have a lot of money, you can go straight away; if not, you can join swing traders and carry out the robbery plan. Use trailing SL to safeguard your money 💰.
Warning : Our heist strategy is incompatible with Fundamental Analysis news 📰 🗞️. We'll wreck our plan by smashing the Stop Loss 🚫🚏. Avoid entering the market right after the news release.
Take advantage of the target and get away 🎯 Swing Traders Please reserve the half amount of money and watch for the next dynamic level or order block breakout. Once it is resolved, we can go on to the next new target in our heist plan.
💖Supporting our robbery plan will enable us to effortlessly make and steal money 💰💵 Tell your friends, Colleagues and family to follow, like, and share. Boost the strength of our robbery team. Every day in this market make money with ease by using the Thief Trading Style.
I'll see you soon with another heist plan, so stay tuned 🫂

BTCUSDT | Short Term | Buy OpportunityD: Took sell-side liquidity, likely to move bullish.
15m: Wait for a sell-side liquidity sweep and then take a long position after 15m and 1m bullish confirmation.

BTCUSDPair : BTCUSD ( Bitcoin / U.S Dollar )
Description :
Falling Wedge as an Corrective Pattern in Long Time Frame
Completed " 12345 " Impulsive Waves and Corrective Waves " wxyxz "
Break of Structure
RSI - Divergence
Bullish Channel in Short Time Frame


BTCUSD 30/10 Pair : BTCUSD ( Bitcoin / U.S Dollar )
Description :
Consolidation Phase as an Corrective Pattern in Long Time Frame. Completed " ABCD " Corrective Waves. It will Reject from the Lower Trend Line of the Corrective Pattern " Symmetrical Triangle " in Short Time Frame or from LTL of Consolidation
Entry Precaution :
Wait until it gives Strong Bullish Price Action Rejection

BTCUSDT BINANCE:BTCUSDT
The chart under consideration is characterized by exceptional clarity and detail. An examination of the chart reveals that the bearish weekly trendline was effectively broken, followed by a pullback featuring a hammer candle. The hammer candle was subsequently confirmed with a robust green candle that broke through the purple resistance level and has not fallen below it. The present pricing position is of the utmost importance, as it has the potential to reach a specific area if it successfully overcomes the resistance level. Conversely, if the resistance level rebuffs the price, no growth will occur. In light of this analysis, it is my professional opinion that October bodes well for BTC.

Bitcoin 25/10 MovePair : BTCUSD ( Bitcoin / U.S Dollar )
Description :
Completed " 12345 " Impulsive Waves. If it Rejects from the Upper Trend Line of the Corrective Pattern " Rising Wedge " in Long Time Frame then It will Completed the Retracement for the Break of Structure and " A " Corrective Wave
Entry Precaution :
Wait for the Proper Trend Reversal / Rejected Price Actions

I remain bearish on BTC as the downtrend is far from overI'm shorting some BTC here, and the power to withdraw is great, but I don't think it will break through the previous high, otherwise there will be a reversal.
All we have to do now is be patient

BTCUSDT Price PredictionAs BTC on 4h timeframe has broken back above a key level of structure (highlighted as green) and is currently retesting it as support, a rally to the next supply zone around 30000 mark (highlighted in red) could be expected.

BTC DailyI think BTC is going to go down at least to 21k ish. But from here it might rise to 28600 or so. If it is the case the right shoulder of the H&S will be formed.

Bitcoin BTC Next Expected move on 4H CHARTHello guyz!!
Bitcoin currently trading now at 22889$.
from last 5 days bitcoin trading.... in a down trend.
bitcoin bounce back expected from 224000$ ( if you want open trade in long at this price)
if bitcoin brok 22400$ support then possible we see bitcoin price at 21100$ ( soo manage trade in proper way)
CURRENTLY.... rsi indicator is bearish on 4H time fram chart.
and macd indicator bearish toon on 4H tf.
do trade at your own risk.
follow me for mor more updates.

BTC / USDT 4HBTC / USDT Short term possibility path , we need to look for more confirmation clues regarding to opening proper short position

BTC/USDTHey everyone, this is my analysis for BTC there's huge liquidity below this trend line I shared each and everything in the chart its price goes up from the D leg, so don't panic that will be just a liquidity wick and make trend lines just for that.
Good luck everyone.
#Bitcoinanalysis #btc

BTC cycle based Wave CountsThis is our macro view on BTC based on cycle based wave counts.
--> BTC is in the final leg down of a full macro corrective wave 4, nobody knows what the excact low would be.
Based on wavecounts, Fibonacci extension + retracement targets the most confluence is founded in the 13-11.5k zone (also the launchepad of the previous bullrun) with an potential overshoot towards 10k
We dont want to try buy the exact bottem, we always waiting to get conformation on a bottem formation or we buying at prices where we feel comfort with to hold for the next wave up.
--> BTC never was able to make new ATH's before the halving date. The next logical top should be in 2025
This is just one of the many scenario's we could think of, along the way with having more chart data our vieuw on this TA could change.
On wich prices are you feeling comfort to buy in without having any regret over the next years?
What is your trade plan?
Cheers,
Team Quantistic

BTCUSDT ANALYSIS , 1 DAYI will share two possible scenarios for you
The Federal Reserve is not done yet
The possibility of war between China and Taiwan
The possibility of more attacks from Russia
Downturn
Fundamental bad news that is very likely to form a new bottom for us

Descending Broadening WedgeAs you can see there is a broadening wedge forming in the hourly time frame, it looks like we are going on a bullish trend in a few hours.
Yellow line price target

BTCUSDT Chart AnalysisCurrently in the 1h BTCUSDT chart, BTC price is moving near the $23,400 area. After forming a double bottom and a W pattern at the $22,700 - $23,000 supply zone, and then after price rejected from that supply zone area and after breakout the upper line of the descending triangle, we can see the price started to move to upward direction. Now, BTC price is moving near the neck level of the W pattern. Other than that we can see there is a resistance line above that level at the $23,500 area.We can expect that, If the price reject at that resistance level it will be comeback again to the supply zone and if the price successfully breakout and stable on that resistance level the price will be going to upward direction.
Trading is highly risk. Always focus about the risk management. Put less than 2% of your capital and less than 10 trades per day. 1:2 Risk reword ratio is appropriate. Keep more than 50% win rate. These things are according to my knowledge. This is only for the educational purposes and not as the financial advice. Do your own research. Trade carefully. Good luck!

BTCUSDTMarket expecting to reach the blue zone WCL after breaking the corrective zone (yellow) which indicated that the market to reach more higher selling area (WCL)

BTC is holding above $20,000 as global global market openCheck out my previous long on BTC BTC is holding above $20,000 as global markets open in green. Bitcoin is trading in the range now where $21,000 is working as resistance and $19,650-$19,750 working as a support level. If BTC is able to break above $21,000 then we see a move towards the major resistance of the $23,000 area. If BTC breaks below $19,650 then we see more downfall in the market. Trade with tight stop loss and wait for BTC's next move.

Btc is still in sideway+bearish range Btc is still in sideway+bearish range
Few Shitcoins still can pump hard
That is what is happening
Just be careful on any trade u open use stop lose

#BTC/USDT UPDATE Hi guys, This is CryptoMojo, One of the most active trading view authors and fastest-growing communities.
Consider following me for the latest updates and Long /Short calls on almost every exchange.
I post short mid and long-term trade setups too.
Let’s get to the chart!
I have tried my best to bring the best possible outcome to this chart, Do not consider it as FINANCIAL ADVICE.
#BTC/USDT ANALYSIS
It bounced from the horizontal support and currently it is on the support of this horizontal and trendline. MACD crossover is showing bullish momentum.
IF IT BREAKS LOWER SUPPORT THE CART WILL BE INVALIDED.
We might see some upside move from here but a certain breakout or breakdown will come from its next move.
Stay tuned
This chart is likely to help you make better trade decisions if it does consider upvoting it.
I would also love to know your charts and views in the comment section.
Thank you
