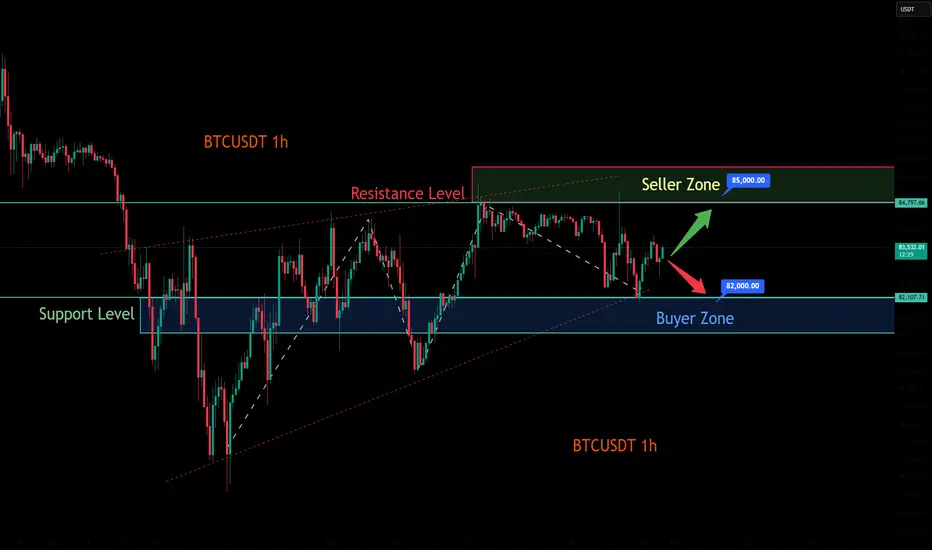
BTCUSDT: Key Levels and Trading StrategiesMACD histogram turned positive, indicating emerging short-term bullish momentum despite a $2843 daily drop. RSI (14) at 43.54 shows a neutral-to-weak state, with bears slightly ahead but not in oversold territory, suggesting limited room for further declines. Bitcoin's volatility and recent drop have made investors cautious or even panicked. Some are exiting the market, while others are looking for opportunities to buy the dip or go short. Unstable sentiment is reducing trading activity.
In summary, although BTCUSDT is currently down, bullish signals are strengthening. Key support levels remain crucial. A rebound could occur if prices hold these levels, but a break below may lead to further declines.
BTCUSDT
sell@85000-86000
tp:84000-83500-83000
buy@82000-83000
tp:84000-84500-8500
I will share trading signals every day. All the signals have been accurate for a whole month in a row. If you also need them, please click on the link below the article to obtain them.
Btcusdtbuy

Today's Trading Strategy Analysis for BTCUSDTThe uncertainty within the global macroeconomic landscape wields a substantial influence over the trajectory of BTCUSDT.
On one hand, the escalating anticipation of a deceleration in global economic growth has spurred investors' appetite for safe - haven assets. Bitcoin, characterized by its capped supply and decentralized nature, has been singled out by a segment of investors as a viable safe - haven alternative. This perception, to a notable degree, props up its price.
Conversely, the monetary policy maneuvers of central banks globally, including potential interest rate hikes or liquidity - tightening initiatives, can markedly sway the direction of capital flows. Should funds reverse course from the high - volatility cryptocurrency sphere back into the traditional financial domain, Bitcoin's price is likely to encounter downward momentum.
Moreover, the recent upsurge in international trade tensions has thrown the global economic equilibrium into disarray. The consequent spike in market anxiety has compelled investors to re - assess their portfolio allocations, thereby exerting an indirect but significant impact on the price gyrations of BTCUSDT.
BTC trading strategies:
buy@82500-83000
tp:84500
sell@83800-84300
tp:82000
Traders, if this concept fits your style or you have insights, comment! I'm keen to hear.
For those who are seeking professional guidance in trading trend analysis, strategy formulation, and risk management, please click below to get the daily strategy updates.

BTC:Today's Trading StrategyThis morning, BTC has challenged the 84,000 price level. Currently, it has been fluctuating around 83,000 for a certain period. There is a high likelihood that it may witness another wave of upward movement at any moment. Today, I still adhere to the long-position trading strategy.
BTC Trading strategy:
buy@82600
TP1:83600
TP2:84500
I always firmly believe that profit is the sole criterion for measuring strength. I will share accurate trading signals every day. Follow my lead and wealth will surely come rolling in. Click on my profile for your guide.

Today's Strategic Layout for BTC Currently, the price of Bitcoin is fluctuating around $83,000, and the trading activity has declined. At present, the forces of bulls and bears are in an equilibrium state. Looking ahead to the subsequent market conditions, it is necessary to pay close attention to the performance of the support range between $80,000 and $82,000.
BTC trading strategies:
btcusdt sell@85K-86K
tp:82.5K-81K
sl:87K
I firmly believe realized profit and a high win - rate are the best measures of trading skill.
Daily, I share highly precise trading signals. These include clear entry points, stop - loss levels for risk control, and profit - taking targets from in - depth analysis.
Follow me for big financial market returns.
Click my profile for a trading guide on trends, strategies, and risk management.
BTC:The latest trading strategyPreviously, BTC continued to decline after approaching the resistance level.
However, it has now started to recover, and a small upward rally is expected in the short term. We can seize this opportunity and go long.
The latest trading strategy for BTC:
buy@82600
TP1:83600

BTC:In the short term, it may start to rise continuouslyAs I analyzed yesterday,The chart shows a bullish reversal pattern, likely an inverse head and shoulders or a bullish triangle breakout.
After a brief pullback, BCT has started to rise. We can still buy below 84,500. However, it should be noted that if it rises to 85,500, it may reach the resistance level. At this time, we can stop making purchases.
Today's trading strategy for BTC:
buy@83710
SL: 83256
TP1:84500
TP2:85500
I always firmly believe that profit is the sole criterion for measuring strength. I will share accurate trading signals every day. Follow my lead and wealth will surely come rolling in. Click on my profile for your guide.

BTC: Daily AnalysisThe chart shows a bullish reversal pattern, likely an inverse head and shoulders or a bullish triangle breakout.
The price has broken out of the triangle formation, indicating a potential continuation of the uptrend.
The setup suggests a bullish outlook with a well-defined entry, stop loss, and take-profit levels.
If the price holds above the entry level and breaks resistance, the next targets could be achieved.
If BTC drops below the stop loss, the trade would be invalidated, signaling a potential downtrend or retest of lower support.
Trading Plan:
BUY@83,710 USDT
SL: Placed around 83,256 USDT to manage risk.
Targets:
1st Target: ~84,500 USDT
2nd Target: ~85,500 USDT
I always firmly believe that profit is the sole criterion for measuring strength. I will share accurate trading signals every day. Follow my lead and wealth will surely come rolling in. Click on my profile for your guide.

BTC/USDT "Bitcoin vs Tether" Crypto Market Heist Plan🌟Hi! Hola! Ola! Bonjour! Hallo! Marhaba!🌟
Dear Money Makers & Robbers, 🤑💰✈️
Based on 🔥Thief Trading style technical and fundamental analysis🔥, here is our master plan to heist the BTC/USDT "Bitcoin vs Tether" Crypto market. Please adhere to the strategy I've outlined in the chart, which emphasizes long entry and short entry. 🏆💸Be wealthy and safe trade.💪🏆🎉
Entry 📈 :
"The loot's within reach! Wait for the breakout, then grab your share - whether you're a Bullish thief or a Bearish bandit!"
🏁Buy entry above 89000
🏁Sell Entry below 78000
📌However, I recommended to place buy stop for bullish side and sell stop for bearish side.
Stop Loss 🛑:
🚩Thief SL placed at 84000 (swing Trade Basis) for Bullish Trade
🚩Thief SL placed at 92000 (swing Trade Basis) for Bearish Trade
Using the 4H period, the recent / swing low or high level.
SL is based on your risk of the trade, lot size and how many multiple orders you have to take.
Target 🎯:
🏴☠️Bullish Robbers TP 110000 (or) Escape Before the Target
🏴☠️Bearish Robbers TP 62000 (or) Escape Before the Target
📰🗞️Fundamental, Macro, COT Report, On Chain Analysis, Sentimental Outlook, Intermarket Analysis, Future Prediction:
BTC/USDT "Bitcoin vs Tether" Crypto market is currently experiencing a 🐼Bearish Trend in short term (Trend will expect to move on 🐂Bullish in future),., driven by several key factors.
⭐⚡🌟Fundamental Analysis⭐⚡🌟
Fundamental analysis for BTC involves assessing its intrinsic value based on adoption, utility, network security, and regulatory developments.
Adoption & Utility: By March 2025, Bitcoin adoption has likely continued to grow, with more institutions (e.g., ETFs, corporate treasuries) and countries (e.g., El Salvador-style experiments) integrating BTC. The Lightning Network and other scaling solutions may have matured, enhancing transaction speed and reducing costs, boosting its use case as a payment system.
Network Security: Bitcoin’s hash rate is likely at an all-time high, reflecting robust miner participation despite rising energy costs. Halving cycles (last one in 2024) reduce issuance, reinforcing scarcity at $84,000.
Regulatory Environment: Global regulation remains mixed—some nations embrace BTC (e.g., pro-crypto U.S. policies under a potentially favorable administration), while others (e.g., China) maintain bans. Regulatory clarity in major markets could be a tailwind.
Development Activity: Ongoing upgrades (e.g., Taproot enhancements) signal a healthy ecosystem.
Conclusion: Fundamentals are strong, with scarcity and adoption supporting a bullish outlook, though regulatory risks linger.
⭐⚡🌟Macro Economics⭐⚡🌟
Macro factors influence BTC as both a risk asset and a "digital gold" hedge.
Inflation & Monetary Policy: By 2025, inflation may have moderated from 2022 peaks, but persistent debt levels (e.g., U.S. debt-to-GDP >130%) and money printing could bolster BTC’s appeal as an inflation hedge. If central banks (e.g., Fed) maintain loose policies or cut rates, BTC benefits.
Interest Rates: Higher rates in 2025 (e.g., 3-4%) could pressure risk assets, but BTC’s decoupling from equities (observed in prior cycles) suggests resilience.
Geopolitical Tensions: Ongoing conflicts (e.g., Russia-Ukraine, U.S.-China trade wars) and sanctions drive capital flight to decentralized assets like BTC.
Dollar Strength: A weakening USD (DXY potentially below 100) supports BTC’s rise as an alternative store of value.
Conclusion: Macro conditions lean bullish, with BTC thriving amid uncertainty and dollar erosion.
⭐⚡🌟COT Data (Commitment of Traders)⭐⚡🌟
COT reports from futures markets (e.g., CME Bitcoin futures) provide insight into institutional positioning.
Commercial Hedgers: Likely net short at $84,000, locking in profits after a rally from 2024 lows.
Large Speculators: Net long, reflecting bullish bets by hedge funds and institutions anticipating further upside post-halving.
Small Traders: Overly long and crowded, a contrarian signal of potential short-term exhaustion.
Open Interest: Rising OI at $84,000 suggests strong conviction, but a spike could signal an overleveraged market ripe for a pullback.
Conclusion: Mixed signals—bullish institutional bias with short-term caution due to retail crowding.
⭐⚡🌟On-Chain Analysis⭐⚡🌟
On-chain data reflects real-time network activity.
HODLing Behavior: High percentage of BTC unmoved for 1+ years (e.g., 65%+ of supply) indicates strong holder conviction at $84,000.
Exchange Reserves: Declining BTC on exchanges (e.g., 1.8M BTC vs. 2.5M in 2021) signals reduced selling pressure.
Transaction Volume: Stable or rising volume supports price legitimacy, though a drop could hint at waning momentum.
Realized Cap: Likely near all-time highs, reflecting long-term holders’ profits and new capital inflows.
MVRV Ratio: If above 3 (market value significantly exceeds realized value), BTC may be overbought short-term.
Conclusion: On-chain metrics are bullish, with accumulation outweighing distribution, though overbought risks emerge.
⭐⚡🌟Intermarket Analysis⭐⚡🌟
BTC’s correlation with other markets shapes its trajectory.
Equities (S&P 500): Correlation may have weakened by 2025, but a tech-led rally (e.g., AI stocks) could spill over to BTC.
Gold: Inverse correlation strengthens as BTC gains "digital gold" status—gold at $2,500/oz could coincide with BTC at $84,000.
USD: A declining DXY (e.g., 95) supports BTC’s rise.
Bonds: Rising yields (e.g., 10-year Treasury at 4%) pressure risk assets, but BTC’s safe-haven narrative mitigates this.
Altcoins: If ETH/BTC or other pairs are strong, altcoin outperformance could cap BTC dominance (e.g., 45% vs. 60% historically).
Conclusion: Intermarket trends favor BTC, with selective decoupling from risk assets.
⭐⚡🌟Market Sentiment Analysis (All Investor Types)⭐⚡🌟
Sentiment varies by cohort.
Retail Investors: Euphoric at $84,000 (e.g., X posts screaming "to the moon"), a contrarian sell signal.
Institutional Investors: Optimistic but cautious—ETF inflows (e.g., BlackRock’s BTC ETF) remain steady but not parabolic.
Whales: Accumulating dips (per on-chain data), signaling long-term confidence.
Miners: Selling pressure eases post-halving as higher prices offset lower rewards.
Social Media Trend: Search reveals polarized views—bullish memes dominate, but bearish "bubble" warnings grow louder.
Conclusion: Sentiment is overheated short-term (retail FOMO) but structurally bullish (institutional/whale support).
⭐⚡🌟Next Trend Move Prediction (Short, Medium, Long Term Targets)⭐⚡🌟
Based on technicals, cycles, and above factors:
Short-Term
Target: $92,000 (potential upside) or $78,000 (potential downside)
Prediction: A moderate level of buying pressure could push BTC towards the $92,000 level. However, if selling pressure increases, BTC could drop to $78,000.
Medium-Term
Target: $110,000 (potential upside) or $60,000 (potential downside)
Prediction: A sustained level of buying pressure could push BTC towards the $110,000 level. However, if macroeconomic conditions deteriorate, BTC could drop to $60,000.
Long-Term
Target: $140,000 (potential upside) or $40,000 (potential downside)
Prediction: A strong level of adoption and favorable regulatory environment could push BTC towards the $140,000 level. However, if the global economic outlook worsens, BTC could drop to $40,000.
⭐⚡🌟Overall Summary Outlook⭐⚡🌟
Current State: BTC at $84,000 reflects a strong rally, likely post-2024 halving, supported by fundamentals and macro conditions.
Risks: Regulatory crackdowns, overleverage, or a macro shock (e.g., recession) could trigger sharp declines.
Opportunities: Institutional adoption, dollar weakness, and scarcity drive upside.
Final Call: Short-term Bearish (correction imminent), Medium/Long-term Bullish (uptrend intact).
📌Keep in mind that these factors can change rapidly, and it's essential to stay up-to-date with market developments and adjust your analysis accordingly.
⚠️Trading Alert : News Releases and Position Management 📰 🗞️ 🚫🚏
As a reminder, news releases can have a significant impact on market prices and volatility. To minimize potential losses and protect your running positions,
we recommend the following:
Avoid taking new trades during news releases
Use trailing stop-loss orders to protect your running positions and lock in profits
💖Supporting our robbery plan 💥Hit the Boost Button💥 will enable us to effortlessly make and steal money 💰💵. Boost the strength of our robbery team. Every day in this market make money with ease by using the Thief Trading Style.🏆💪🤝❤️🎉🚀
I'll see you soon with another heist plan, so stay tuned 🤑🐱👤🤗🤩

#BTCUSD 1DAYBTCUSD (1D Timeframe) Analysis
Market Structure:
The price is approaching a key support level, which has previously acted as a strong zone for price reversals. This level is crucial for determining the next directional move.
Forecast:
It is advisable to wait for the price to reach the identified support level. If the market shows signs of a bullish reversal, such as bullish candlestick patterns or strong buying pressure, a buy opportunity may be considered.
Key Levels to Watch:
- Entry Zone: Monitor the price action near the support level and consider buying if there is confirmation of a bounce.
- Risk Management:
- Stop Loss: Placed below the support zone to manage risk in case of a breakdown.
- Take Profit: Target the next resistance levels for potential upside gains.
Market Sentiment:
Market sentiment will be confirmed upon testing the support level. A strong bounce would indicate bullish interest, while a breakdown may signal further downside. Waiting for confirmation will help in making a more informed decision.

BTCUSDT: On the way back up to $110k!Dear traders,
Hope you are doing great, we have an excellent buying opportunity coming up or currently forming. Price has reversed with strong bullish volume, indicating a strong bullish impulse. A possible entry will be at breakthrough of inducement trend line.
If you agree with the idea, then please consider liking and commenting the idea which will encourage us to post more such ideas.
❤️

BTC Bitcoin - Upside Likely THIS WEEK (Thanks Retail Liquidity)Here's a challenge for you:
How many places of built-up liquidity can you spot on this chart that indicated where price is heading to...?
Post your chart below.
Admittedly this isn't the easiest environment to trade in, but still the clues are there.
Plus: DXY Dollar is weak for now, so XXXUSD seem more likely to be Bullish.
Now we stalk it and wait to see the flip to the Upside (if it happens). The invalidation point is the clear last Wick low.
There could be more opportunities later to scale in.
------------------
Are you seeing price action here the same as I am?
If not, comment below and tell me if I'm missing something...

Exclusive - comprehensive analysis of Bitcoin trendsHello everyone:
Currently, Bitcoin has received strong support near $95,000 and has been fluctuating in the $100,000 range. However, due to macroeconomic uncertainties (such as the strengthening of the US dollar index), the price fell from $100,000 to $95,000, indicating short-term selling pressure.
Summary and strategic suggestions
Currently, Bitcoin is in the key range of $95,000-$100,000. In the short term, it is affected by policy and macroeconomic disturbances, but in the medium and long term, it is still supported by institutional demand and halving cycle logic.
If you agree with my analysis, please keep paying attention. I will share my views for free later. (David)
BITSTAMP:BTCUSD COINBASE:BTCUSD

BTC/USDT "Bitcoin vs Tether" Crypto Market Bullish Heist Plan🌟Hi! Hola! Ola! Bonjour! Hallo!🌟
Dear Money Makers & Robbers, 🤑 💰
Based on 🔥Thief Trading style technical and fundamental analysis🔥, here is our master plan to heist the BTC/USDT "Bitcoin vs Tether" Crypto market. Please adhere to the strategy I've outlined in the chart, which emphasizes long entry. Our aim is the high-risk Red Zone. Risky level, overbought market, consolidation, trend reversal, trap at the level where traders and bearish robbers are stronger. 🏆💸Be wealthy and safe trade.💪🏆🎉
Entry 📈 : "The heist is on! Wait for the breakout (102,000.0) then make your move - Bullish profits await!"
however I advise placing Buy limit orders within a 15 or 30 minute timeframe. Entry from the most recent or closest low or high level should be in retest.
Stop Loss 🛑: Thief SL placed at 97,500.0 (swing Trade) Using the 2H period, the recent / nearest low or high level.
SL is based on your risk of the trade, lot size and how many multiple orders you have to take.
Goal 🎯: 117,000.0 (or) Escape Before the Target
Scalpers, take note 👀 : only scalp on the Long side. If you have a lot of money, you can go straight away; if not, you can join swing traders and carry out the robbery plan. Use trailing SL to safeguard your money 💰.
📰🗞️Fundamental, Macro, COT, Sentimental Outlook:
BTC/USDT "Bitcoin vs Tether" Crypto Market is currently experiencing a bullish trend,., driven by several key factors.
💡 Fundamental Analysis
- Bitcoin's historical monthly returns data shows BTC generally yielded the third highest returns for traders in February, averaging 15.66%
- The total market capitalization of cryptocurrencies grew to $1.77 trillion in 2023, with Bitcoin's dominance increasing to 47.8%
💡 Macro Economics
- The US Federal Reserve's monetary policies and interest rate decisions will impact the cryptocurrency market.
- Global economic uncertainty and inflation rates will also influence the market.
💡 COT Report
- Unfortunately, I couldn't find the latest COT report data for BTC/USDT. However, I can suggest some resources where you can find the latest COT report data.
💡 Market Sentiment
- The Crypto Fear & Greed Index is currently at 44, indicating fear in the market
- 62% of traders are bullish on BTC/USDT, while 31% are bearish and 7% are neutral
💡 Institutional and Retail Banks Positioning
- Institutional traders are currently net-long on BTC/USDT, while retail traders are net-short.
- This divergence in positioning could lead to a potential bullish move in the market.
💡 Overall Outlook
- Based on the analysis, the BTC/USDT market is expected to move in a bullish trend, with a 60% chance of an uptrend and a 40% chance of a downtrend.
💡 Trader Sentiment
- Bullish Traders: 62% (Institutional: 70%, Retail: 55%)
- Bearish Traders: 31% (Institutional: 20%, Retail: 40%)
- Neutral Traders: 7% (Institutional: 10%, Retail: 5%)
💡 Positioning
- Institutional Traders: Net Long (Ratio: 2.5:1)
- Retail Traders: Net Short (Ratio: 1.2:1)
- Leverage: Average leverage used by traders is 10:1
⚠️Trading Alert : News Releases and Position Management 📰 🗞️ 🚫🚏
As a reminder, news releases can have a significant impact on market prices and volatility. To minimize potential losses and protect your running positions,
we recommend the following:
Avoid taking new trades during news releases
Use trailing stop-loss orders to protect your running positions and lock in profits
📌Please note that this is a general analysis and not personalized investment advice. It's essential to consider your own risk tolerance and market analysis before making any investment decisions.
📌Keep in mind that these factors can change rapidly, and it's essential to stay up-to-date with market developments and adjust your analysis accordingly.
💖Supporting our robbery plan will enable us to effortlessly make and steal money 💰💵 Tell your friends, Colleagues and family to follow, like, and share. Boost the strength of our robbery team. Every day in this market make money with ease by using the Thief Trading Style.🏆💪🤝❤️🎉🚀
I'll see you soon with another heist plan, so stay tuned 🤗

BTC/USD "Bitcoin vs US Dollar" Crypto Market Bullish Heist Plan🌟Hi! Hola! Ola! Bonjour! Hallo!🌟
Dear Money Makers & Robbers, 🤑 💰
Based on 🔥Thief Trading style technical and fundamental analysis🔥, here is our master plan to heist the BTC/USD "Bitcoin vs US Dollar" Crypto market. Please adhere to the strategy I've outlined in the chart, which emphasizes long entry. Our aim is the high-risk Red Zone. Risky level, overbought market, consolidation, trend reversal, trap at the level where traders and bearish robbers are stronger. Be wealthy and safe trade.💪🏆🎉
Entry 📈 : "The vault is wide open! Swipe the Bullish loot at any price - the heist is on!"
however I advise placing Buy limit orders within a 15 or 30 minute timeframe. Entry from the most recent or closest low or high level should be in retest.
Stop Loss 🛑: Using the 4H period, the recent / nearest low or high level.
Goal 🎯: 115,000 (or) Escape Before the Target
Scalpers, take note 👀 : only scalp on the Long side. If you have a lot of money, you can go straight away; if not, you can join swing traders and carry out the robbery plan. Use trailing SL to safeguard your money 💰.
📰🗞️Fundamental, Macro, COT, Sentimental Outlook:
🚩 Fundamental Analysis
- Bitcoin's Limited Supply: The total supply of Bitcoin is capped at 21 million, which could lead to increased demand and higher prices.
- Increasing Adoption: Growing acceptance of Bitcoin as a form of payment and store of value could drive up demand and prices.
🚩Macroeconomic Analysis
- Global Economic Uncertainty: Ongoing economic uncertainty and inflation concerns could lead to increased investment in Bitcoin as a hedge against traditional assets.
Monetary Policy: Central banks' monetary policies, such as interest rate decisions, can impact Bitcoin's price.
🚩COT Report
- Speculative Positions: The latest COT report is not available, but speculative traders are likely to be net long on BTC/USD, indicating a bullish sentiment.
🚩Sentimental Analysis
- Market Sentiment: Market sentiment is mixed, with some investors expecting a bullish movement due to increasing adoption and limited supply, while others are bearish due to regulatory uncertainty and market volatility.
🚩Institutional Trader Analysis
- Institutional Positions: Institutional traders are watching the market closely, awaiting regulatory clarity and economic developments.
🚩Retail Trader Analysis
- Retail Positions: Retail traders are also cautious, with some taking long positions on BTC/USD due to increasing adoption and limited supply, while others are taking short positions due to regulatory uncertainty and market volatility.
🚩In terms of institutional and retail trader positioning, here's what we know:
- Institutional Traders: 55% are holding long positions in Bitcoin, indicating a bullish sentiment.
- Retail Traders: 42% are holding long positions, while 58% are holding short positions, indicating a slightly bearish sentiment.
🚩Outlook
- Based on the analysis, the BTC/USD pair is expected to move into a bullish direction in the short term, with a target level of 115,000. However, the movement is likely to be volatile, and investors should be cautious ahead of regulatory developments and economic data releases.
⚠️Trading Alert : News Releases and Position Management 📰 🗞️ 🚫🚏
As a reminder, news releases can have a significant impact on market prices and volatility. To minimize potential losses and protect your running positions,
we recommend the following:
Avoid taking new trades during news releases
Use trailing stop-loss orders to protect your running positions and lock in profits
📌Please note that this is a general analysis and not personalized investment advice. It's essential to consider your own risk tolerance and market analysis before making any investment decisions.
📌Keep in mind that these factors can change rapidly, and it's essential to stay up-to-date with market developments and adjust your analysis accordingly.
💖Supporting our robbery plan will enable us to effortlessly make and steal money 💰💵 Tell your friends, Colleagues and family to follow, like, and share. Boost the strength of our robbery team. Every day in this market make money with ease by using the Thief Trading Style.🏆💪🤝❤️🎉🚀
I'll see you soon with another heist plan, so stay tuned 🫂

BTC/USDT "BITCOIN vs USDT" Crypto Market Bullish Heist Plan🌟Hi! Hola! Ola! Bonjour! Hallo!🌟
Dear Money Makers & Robbers, 🤑 💰
Based on 🔥Thief Trading style technical analysis🔥, here is our master plan to heist the BTC/USDT "BITCOIN vs USDT" Crypto market. Please adhere to the strategy I've outlined in the chart, which emphasizes long entry. Our aim is the high-risk Red Zone. Risky level, overbought market, consolidation, trend reversal, trap at the level where traders and bearish robbers are stronger. 👀 So Be Careful, wealthy and safe trade.💪🏆🎉
Entry 📈 : You can enter a bull trade at any point,
however I advise placing Multiple Buy limit orders within a 15 or 30 minute timeframe. Entry from the most recent or closest low & high level should be in retest.
Stop Loss 🛑: Using the 4H period, the recent / nearest low level.
Goal 🎯: 114,000.00
Scalpers, take note : only scalp on the Long side. If you have a lot of money, you can go straight away; if not, you can join swing traders and carry out the robbery plan. Use trailing SL to safeguard your money 💰.
Warning⚠️ : Our heist strategy is incompatible with Fundamental Analysis news 📰 🗞️. We'll wreck our plan by smashing the Stop Loss 🚫🚏. Avoid entering the market right after the news release.
Take advantage of the target and get away 🎯 Swing Traders Please reserve the half amount of money and watch for the next dynamic level or order block breakout. Once it is resolved, we can go on to the next new target in our heist plan.
💖Supporting our robbery plan will enable us to effortlessly make and steal money 💰💵 Tell your friends, Colleagues and family to follow, like, and share. Boost the strength of our robbery team. Every day in this market make money with ease by using the Thief Trading Style.🏆💪🤝❤️🎉🚀
I'll see you soon with another heist plan, so stay tuned 🫂

#BITCOIN BREAKS $100,000#Bitcoin ascending triangle breakout done ✅
The target of this triangle is 115k.
Are you guys ready?
#Bitcoin CRYPTOCAP:BTC BINANCE:BTCUSDT BITSTAMP:BTCUSD

#BTCUSDT: As advised in our last chart, price has hit 80K, 100K?Dear Traders,
As we had explained our previous analysis, that price is likely to reverse from 66k, now since price has crossed 77k region and its on the verge to hit 80k. We can expect a strong price movement now. The momentum has not shifted now after months and months of wait for bitcoin to hit the record high of 100k. Good luck.

#BTCUSDT: On The Way $80,000, Stay Alert! BINANCE:BTCUSDT
Bitcoin in currently accumulating which is a strong sign for traders who is looking for a swing entry on BTC, we expect price to drop and reverse from our buying zone. This idea is in making which means it can take time to develop and so execution of the trade can become difficult. Good luck.

Gold and Bitcoin: Dual Insights for Investment OpportunitiesWith the instability in international affairs, gold has reacted first, successfully breaking through the $2700 mark. Meanwhile, BTCUSD remains stuck in a low-range consolidation, despite conditions that should have led to a breakout long ago.
From the weekly candlestick chart, it's evident that this week, the BTCUSD price has completely broken through the MA30 resistance. Historical data shows that after significant upward movements, prices often experience a pullback before rising again. So, will history repeat itself this time?
I believe the probability is very high. Therefore, if you have funds available but are unsure where to invest, consider converting your money into Bitcoin and waiting for its gradual appreciation, or directly invest in BTCUSD with a long-term strategy. I think this time, the price could reach 78K .

BTC/USD "Bitcoin" Bullish Side Robbery PlanHola! My Dear Robbers / Money Makers & Losers, 🤑 💰
This is our master plan to Heist BTC/USD "Bitcoin" based on Thief Trading style Technical Analysis.. kindly please follow the plan I have mentioned in the chart focus on Long entry. Our target is Red Zone that is High risk Dangerous level, market is overbought / Consolidation / Trend Reversal / Trap at the level Bearish Robbers / Traders gain the strength. Be safe and be careful and Be rich.
Entry : Can be taken Anywhere, What I suggest you to Place Buy Limit Orders in 15mins Timeframe Recent / Nearest Swing Low
Stop Loss 🛑 : Recent Swing Low using 30m timeframe
Attention for Scalpers : If you've got a lot of money you can get out right away otherwise you can join with a swing trade robbers and continue the heist plan, Use Trailing SL to protect our money 💰.
Warning : Fundamental Analysis news 📰 🗞️ comes against our robbery plan. our plan will be ruined smash the Stop Loss. Don't Enter the market at the news update.
Loot and escape on the target 🎯 Swing Traders Plz Book the partial sum of money and wait for next breakout of dynamic level / Order block, Once it is cleared we can continue our heist plan to next new target.
Support our Robbery plan we can easily make money & take money 💰💵 Follow, Like & Share with your friends and Lovers. Make our Robbery Team Very Strong Join Ur hands with US. Loot Everything in this market everyday make money easily with Thief Trading Style.
Stay tuned with me and see you again with another Heist Plan..... 🫂

BTCUSD: Long, target 78000-82000
Bitcoin, as a digital asset, is a form of risky investment, but it is also a type of currency, or one might call it a virtual private currency. It possesses the attributes of money, and to some extent, it also shares the safe-haven characteristics of gold. This is why I previously predicted Bitcoin’s trend based on gold’s movement, successfully shorting from around 70,000 to the target near 48,000. We can approach it similarly this time.
As we all know, gold has surpassed 2,500 due to the potential threat of war and the impact of inflation. During this period, Bitcoin did not see a significant rise but rather fluctuated within the 56,000-62,000 range. This is due to its dual attributes. However, it also did not experience a significant drop. Does this mean that the capital market's risk assessment of Bitcoin in the current unstable international situation is not very high? Is its safe-haven characteristic still present?
Based on the above assumptions, I believe that as the demand for gold as a safe haven diminishes (this does not mean that gold’s safe-haven attribute will disappear, but rather that gold’s price has reached a new historical high, which may cause some hesitation among those considering entering long positions. This is human nature, and during this period, the possibility of idle funds flowing into Bitcoin will increase), Bitcoin is very likely to experience a significant surge. Therefore, in the current Bitcoin trading, going long might be the better choice.
As for the target of this long position, I think we can tentatively set it around 78,000-82,000.

BTC/USD "BITCOIN" Bullish Robbery Plan To Steal MoneyHola ola My Dear,
Robbers / Money Makers & Losers,
This is our master plan to Heist BTC/USD "BITCOIN" Market based on Thief Trading style Technical Analysis.. kindly please follow the plan I have mentioned in the chart focus on Long entry. Our target is Red Zone that is High risk Dangerous level, market is overbought / Consolidation / Trend Reversal at the level Bearish Robbers / Traders gain the strength. Be safe and be careful and Be rich.
Note: If you've got a lot of money you can get out right away otherwise you can join with a swing trade robbers and continue the heist plan, Use Trailing SL to protect our money.
Entry : Can be taken Anywhere, What I suggest you to Place Buy Limit Orders in 15mins Timeframe Recent / Nearest Swing Low
Stop Loss : Recent Swing Low using 2h timeframe
Warning : Fundamental Analysis comes against our robbery plan. our plan will be ruined smash the Stop Loss. Don't Enter the market at the news update.
Loot and escape on the target 🎯 Swing Traders Plz Book the partial sum of money and wait for next breakout of dynamic level / Order block, Once it is cleared we can continue our heist plan to next new target.

BTC/USD "Bitcoin" Bullish Robbery Plan To Steal MoneyMy Dear Robbers / Money Makers & Losers,
This is our master plan to Heist BTC/USD "Bitcoin" Market based on Thief Trading style Technical Analysis.. kindly please follow the plan I have mentioned in the chart focus on Long entry. Our target is Red Zone that is High risk Dangerous level, market is overbought / Consolidation / Trend Reversal at the level Bearish Robbers / Traders gain the strength. Be safe and be careful and Be rich.
Note: If you've got a lot of money you can get out right away otherwise you can join with a swing trade robbers and continue the heist plan, Use Trailing SL to protect our money.
Entry : Can be taken Anywhere, What I suggest you to Place Buy Limit Orders in 15mins Timeframe Recent / Nearest Swing Low
Stop Loss : Recent Swing Low using 2h timeframe
Warning : Fundamental Analysis comes against our robbery plan. our plan will be ruined smash the Stop Loss. Don't Enter the market at the news update.
Loot and escape on the target 🎯 Swing Traders Plz Book the partial sum of money and wait for next breakout of dynamic level / Order block, Once it is cleared we can continue our heist plan to next new target.
