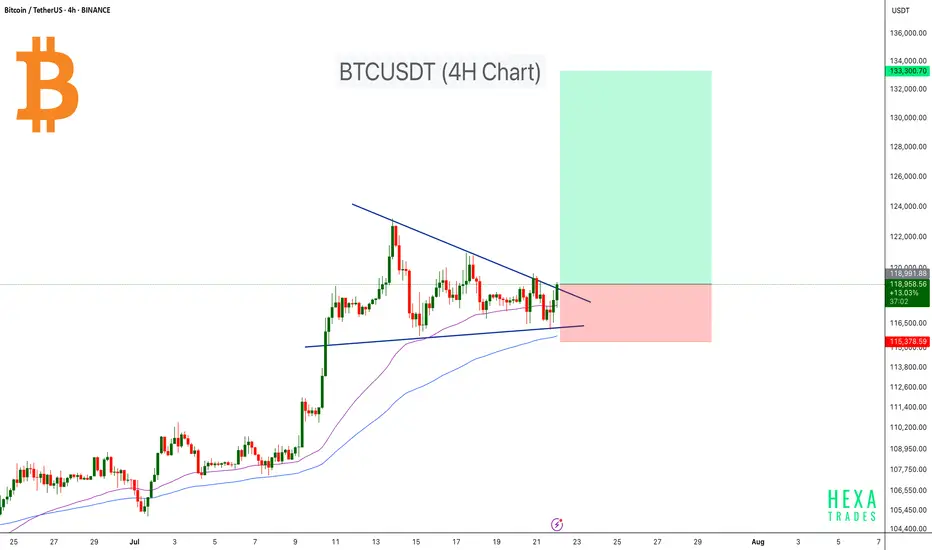
BTC Next Move Toward $150K?Bitcoin recently broke out above a long-standing resistance zone ($110K–$115K), supported by a clean move through the volume profile high node. After testing local highs, BTC is now pulling back to retest the breakout area, a critical level that could act as new support.
Key Points:
Breakout Retest: Price has pulled back into the breakout zone around $114K, aligning with strong previous resistance that may now flip to support.
Volume Profile: A strong high-volume node is visible below ($105K–$110K), which reinforces this area as a major demand zone.
EMA Confluence: The 50-day and 100-day EMAs are trending upward and aligning near the retest area, providing additional support.
If this level holds, BTC could resume its bullish leg toward the $150K level.
Cheers
Hexa
Btcusdtlong

BTCUSDT: Elliot Wave AnalysisAs you can see in the chart, the fourth wave has ended and there is a possibility of an increase in the next stage to the level between 128,000 and 131,000, followed by a correction for a larger fourth wave and finally the last leg of the increase to the fifth wave, which has the possibility of reaching 139,000 to 140,000.

BTCUSD INCREASES Bitcoin looking to be targeting new highs and I’m simply following the trend and keeping trading simple
Bullish Flag Forming on BTCUSDT – Is the Next Big Move Coming?🧠 Complete and Insightful Technical Analysis:
The 12H BTCUSDT chart is currently showcasing a textbook Bullish Flag pattern, a powerful continuation structure that often precedes major upward moves.
---
🏗️ Pattern Breakdown: Bullish Flag
1. Flagpole:
The sharp breakout from around $107,000 to $123,000 marks the impulsive rally — this is the flagpole, created by strong bullish momentum.
Represents the "lift-off" phase where buyers dominate the market.
2. Flag (Consolidation Phase):
After the strong rally, price consolidates inside a downward-sloping parallel channel, forming the flag.
This pullback is healthy, characterized by declining volume, a key feature of the Bullish Flag.
Indicates temporary profit-taking before continuation.
3. Confirmation:
A breakout above the flag's upper boundary (around $123,000 – $124,000) with strong volume would confirm the pattern.
Breakout traders often use this as a high-probability entry.
---
📈 Bullish Scenario (High Probability):
If BTC breaks above the flag structure:
🎯 Measured Move Target (Based on Flagpole Height):
$123,000 + ($123,000 - $107,000) = $139,000
🚀 Potential for further upside if macro conditions and sentiment support the move, possibly reaching $135,000+ in the medium term.
Confirmation Required: A strong candle close above $123,500 with volume spike.
---
📉 Bearish Scenario (If Breakdown Occurs):
If BTC breaks down below the flag (~$117,000):
Retracement likely toward previous breakout zones at $112,000 – $109,000
Such a breakdown could turn the current structure into a fakeout or bear trap
However, this zone may present a strong re-entry opportunity for long-term bulls.
---
📚 Educational Insight for Traders:
Bullish Flags often appear during strong uptrends, acting as a pause before the next leg up.
A healthy pattern shows shrinking volume during the flag and rising volume at breakout.
Traders should monitor key horizontal resistance and volume behavior for confirmation.
---
🧭 Conclusion:
BTCUSDT is at a critical technical juncture. The formation of a clean Bullish Flag suggests the potential for a major continuation rally. Confirmation through a breakout is key — this is the time to prepare, not react.
#BTCUSDT #Bitcoin #BullishFlag #BTCBreakout #CryptoTechnicalAnalysis #CryptoTrading #PriceAction #BTCAnalysis #BitcoinPattern #CryptoEducation #BTCFlag #ContinuationPattern

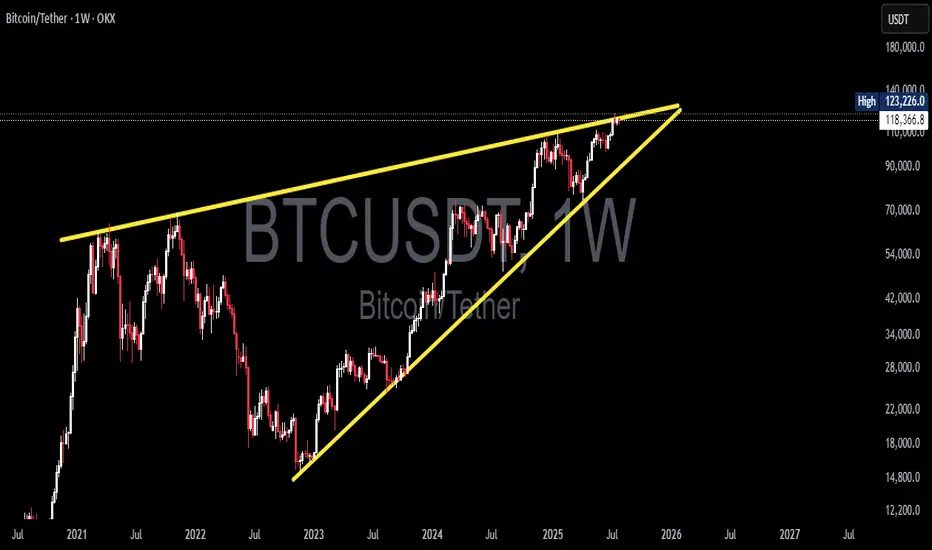
Bitcoin at a Decisive Moment! Rising Wedge Formed — Breakout?🧠 In-Depth Technical Analysis (BTCUSDT – Weekly Timeframe)
Bitcoin is currently trading within a large Rising Wedge pattern, formed over the long term from late 2022 to mid-2025. This structure is typically a bearish reversal formation, although it can also lead to a breakout in strong bull markets.
The wedge is defined by:
Consistently higher lows on the lower trendline
A gradually rising upper resistance line that currently caps price around $123K–$125K
Decreasing volume, indicating consolidation and energy buildup near the apex
This wedge reflects a period of euphoric price action post-2022 bear market accumulation, with price now testing the top of a historically significant resistance zone.
---
📊 Key Price Levels:
🔹 Current Price: ≈ $118,436
🔹 Recent Weekly High: $123,226
🔹 Critical Resistance (Wedge Top): $123,000–$125,000
🔹 Dynamic Support: Rising wedge base (~$90,000–$95,000)
---
🐂 Bullish Scenario: “Historic Breakout Incoming”
If BTC successfully breaks above the wedge’s upper resistance and closes a weekly candle above $125K with strong volume, it would signal a confirmed breakout from the long-term wedge structure.
📈 Upside Targets:
🎯 Target 1: $140,000
🎯 Target 2: $155,000+ (based on Fibonacci extension and macro targets)
🚀 A breakout of this magnitude may trigger a new parabolic rally, especially if accompanied by:
Increased institutional adoption
Spot ETF inflows
Favorable macroeconomic shifts (e.g., rate cuts)
---
🐻 Bearish Scenario: “False Breakout or Breakdown Risk”
If Bitcoin fails to break out and faces strong rejection from the resistance zone (possibly a false breakout), the rising wedge formation may break down — leading to a steep correction.
📉 A breakdown from this structure often leads to sharp drops due to:
Overextension of the current trend
Distribution phase by smart money
🎯 Downside Targets:
Support 1: $95,000–$90,000
Support 2: $76,000
Major Support: $54,000 (historical demand & EMA zones)
---
🔍 Optional Indicators for Chart Confirmation:
Weekly RSI: Watch for bearish divergence
Volume Profile: Can highlight distribution or accumulation zones
EMA 21/50: Ideal for identifying dynamic support levels in retracements
---
📌 Conclusion:
Bitcoin is at a crucial inflection point within this multi-year Rising Wedge. A confirmed breakout could lead to new all-time highs, while a breakdown may trigger a broad correction. Traders should prepare for high volatility, wait for clear confirmation signals, and manage risk wisely in this pivotal zone.
#Bitcoin #BTCUSDT #RisingWedge #BTCBreakout #TechnicalAnalysis #CryptoMarket #PriceAction #BearishReversal #CryptoSignal #ChartPattern #BitcoinAnalysis #Cryptocurrency
FUTURES SIGNALFUTURES SIGNAL
Coin: BTC
Direction: LONG
🟢Input range: 118109
✔️ТР: 118890
❌SL: 117923
We trade with the trend, stop at the minimums

#BTCUSDT: Minor Correction In Price Then $150,000?Hi everyone,
Hope you are doing great we are witnessing some minor bearish correction in the price and think this might be a sellers trap. We think $110,000 can be a good area to buy. Our target is at $150,000 area which look possible after looking at how price recently behaved.

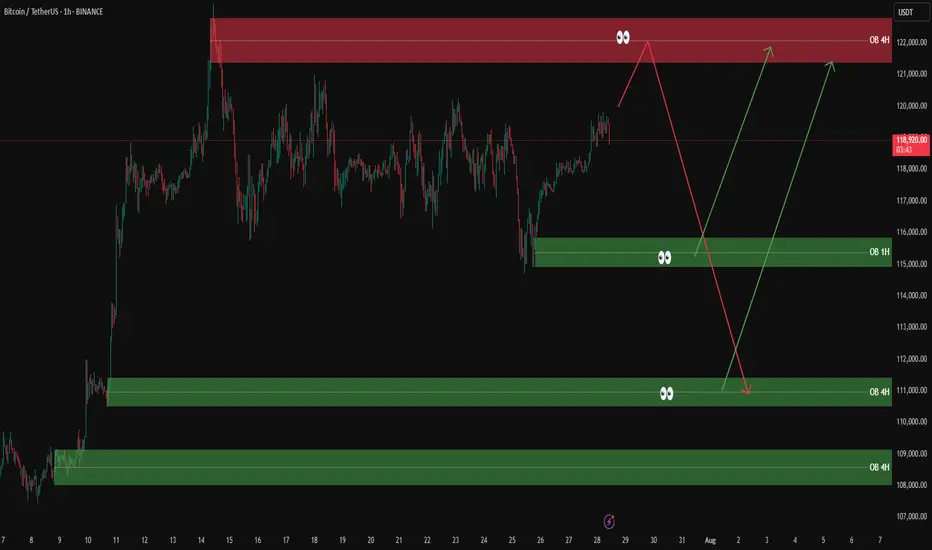
BTCUSDT analysis – 1H & 4H OB setups✅ The overall market trend is still bullish on the 1H and 4H timeframes. However, we’re watching the red 4H supply zone (around 122,000) closely for a possible short-term sell setup.
🟥 If price reaches this red OB, we’ll look for a light short position only with confirmation on the 5M or 3M timeframe.
🟩 On the downside, we are mainly interested in buy setups from the following key green OB zones:
🔹 OB 1H around 115,000
🔹 OB 4H around 111,000
🔹 OB 4H around 108,000
📌 Possible scenarios:
1️⃣ Price reaches the red OB → short with confirmation
2️⃣ Price pulls back to lower green OB zones → long with confirmation
3️⃣ Market bias remains bullish unless proven otherwise.
❌ No entry without confirmation.
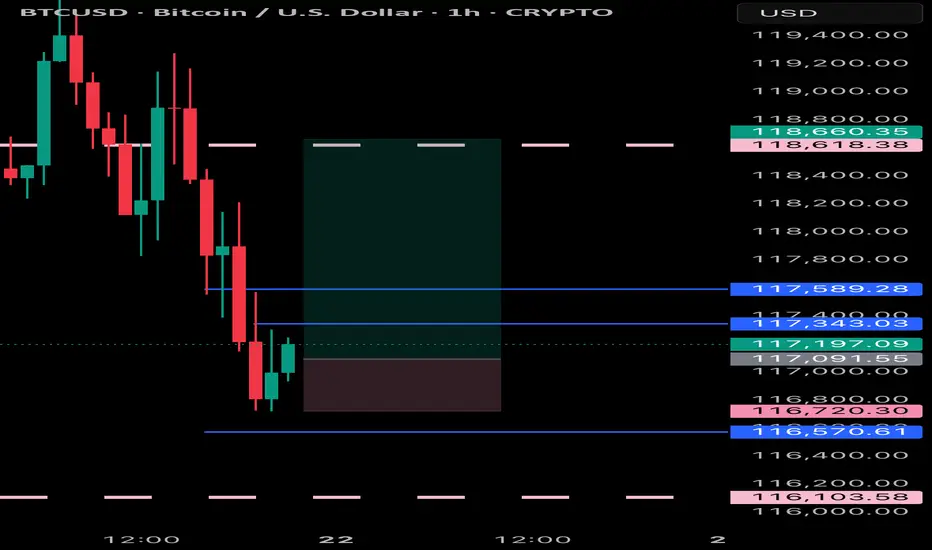
BTCUSDT NEXT Impulse !Hi fellow traders, BTCUSD will be ready to make a move higher from the blue box after it completes the expanding flat pattern in a WXY formation. Target will be 113604.87 USD. Good luck and trade safe!

Double Bullish Flag on Bitcoin — Next Rally to $135K?📊 BTCUSDT (12H) In-Depth Analysis: Major Momentum Brewing
Bitcoin (BTC) is currently exhibiting a very promising technical structure — a Double Bullish Flag, a rare yet powerful continuation formation that often precedes strong upside momentum.
This dual-pattern structure reflects market strength and smart accumulation, with bulls maintaining control while allowing for healthy pauses before potential expansion to higher levels.
---
🔍 Technical Breakdown: Double Bullish Flag Structure
🔸 1. Primary Bullish Flag:
Formed after a sharp rally from around $95,000 to $113,000 (flagpole).
Price then consolidated within a clear descending channel, forming a classic Bullish Flag pattern.
Breakout from this pattern occurred in early July, confirming bullish continuation.
🔸 2. Secondary Bullish Flag (Mini Flag):
After the breakout from the main flag, BTC formed a second smaller flag pattern — a narrow descending channel from ~$123K to ~$119K.
This is known as bullish flag stacking — a pattern of "flag on top of flag", signaling trend strength and smart consolidation.
This mini-flag now acts as a launchpad for the next potential breakout.
---
🚀 Bullish Scenario: Preparing for a Breakout
If BTC breaks above the upper resistance of the mini flag (~$123,200), it will signal a fresh bullish continuation.
🎯 Potential Upside Targets:
Conservative target: $126,000 – $128,000
Full measured move target (from flagpole): $132,000 – $135,000
✅ Confirmation criteria:
Strong candle close above $123.2K
Accompanied by rising volume and upward RSI momentum (but not overbought)
---
🧨 Bearish Scenario: Breakdown and Retest
If BTC fails to break above the flag and instead drops below the flag support (~$119,400), we may see a short-term correction.
🔻 Key Support Levels:
$117,000 – minor horizontal support
$113,000 – $115,000 – strong demand zone and previous breakout area
⚠️ As long as price holds above $113K, the broader bullish trend remains intact. A pullback to this zone could offer a prime retest-buying opportunity.
---
📌 Key Price Levels to Watch:
Level Role
$123,200 Mini-flag resistance (breakout trigger)
$121,600 Mid-range resistance
$119,400 Flag support
$117,000 Horizontal retest zone
$113,000 Major support (trend invalidation if lost)
$132K – $135K Projected breakout target
---
💡 Conclusion: BTC in Critical Zone Before Potential Expansion
This Double Bullish Flag formation is one of the most technically constructive setups BTC has shown in weeks. It reflects a strong, patient market — with bulls preparing for another leg higher.
If the breakout from the second flag confirms, Bitcoin could rally toward $135,000, backed by momentum, volume, and clean structure. However, a breakdown would only signal a short-term cooldown unless support at $113K is lost.
🧭 Stay focused on breakout confirmation, volume spikes, and market sentiment. This could be the calm before a bullish storm.
#BTCUSDT #BitcoinBreakout #BullishFlag #TechnicalAnalysis #DoubleBullFlag #BTCMomentum #BitcoinRally #CryptoOutlook #BitcoinTo135K

"Bitcoin’s Big Heist – Are You In or Out?"🚨 BTC/USDT HEIST MISSION – SWIPE THE BULL RUN BEFORE THE BEARS WAKE UP 💰💣
🌟Hi! Hola! Ola! Bonjour! Hallo! Marhaba!🌟
Money Makers & Robbers, assemble! 🤑💰✈️💸
Here’s your decoded BTC/USDT “Bitcoin vs Tether” Crypto Market Heist Plan, fully loaded with Thief Trading Style 🔥 TA + FA combo. We’re prepping for a bullish breakout loot – eyes on the vault, ignore the noise.
🎯 PLAN OF ATTACK:
🎯 ENTRY (BUY ZONE):
💥 “The vault’s open—time to sweep!”
DCA/Layer your buy limit orders near the 15–30 min swing lows/highs for sniper pullback entries.
Use multi-entry method to stack positions (layering / DCA) as per your ammo (capital 💵).
🛑 STOP LOSS:
Set SL at the nearest swing low wick (4H TF) — around 115000.00, adjust based on your risk/load.
SL = insurance. Not optional.
🏁 TARGET:
Lock sights on 125000.00
🎉 Or… vanish with profits before the bear cops arrive.
🔎 MARKET BACKDROP & ANALYSIS:
📈 BTC/USDT currently signals bullish vibes on the swing/day horizon — fueled by:
Macro Fuel & Fundamentals
Sentiment Radar
COT Reports
On-Chain Pulse
Intermarket Clues
🚀 Connect the dots. The smart money's already prepping a breakout move.
🧲 Scalpers Note:
Stick to the long side only. No shorting the beast — unless you’re made of diamonds.
Secure your bag with trailing SLs.
⚠️ NEWS TRIGGER ZONE – TRADE WITH TACT:
📢 Upcoming high-volatility news events can spike charts.
Avoid new entries during releases and guard open trades with trailing SLs.
Protect the loot. Always.
💖 SUPPORT THE HEIST GANG: BOOST IT!
Smash that ❤️ to boost our thief squad’s momentum!
Every click powers this underground mission – making money with style, one pip at a time. 🎯💣💵
🚀 See you in the next heist drop.
Until then – Stay stealthy. Stay profitable. Stay legendary. 🐱👤💸🏆

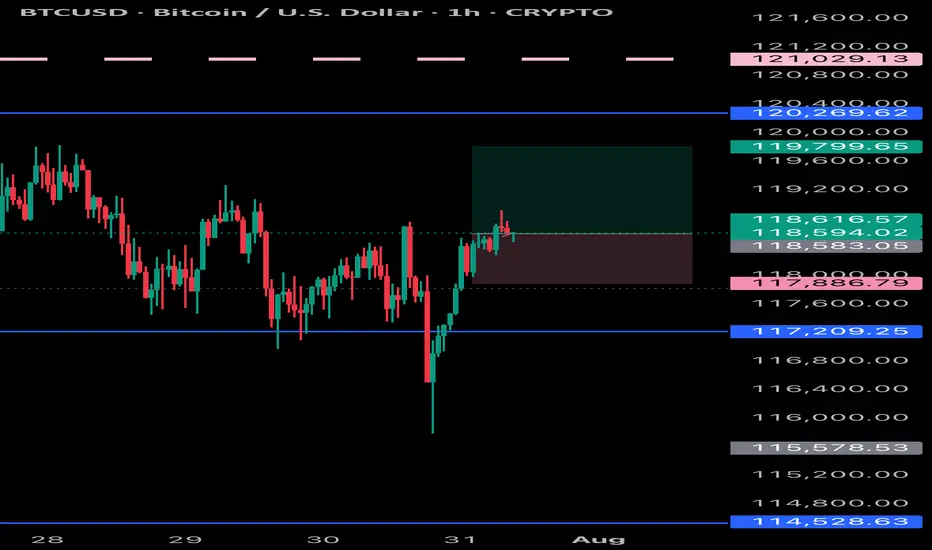
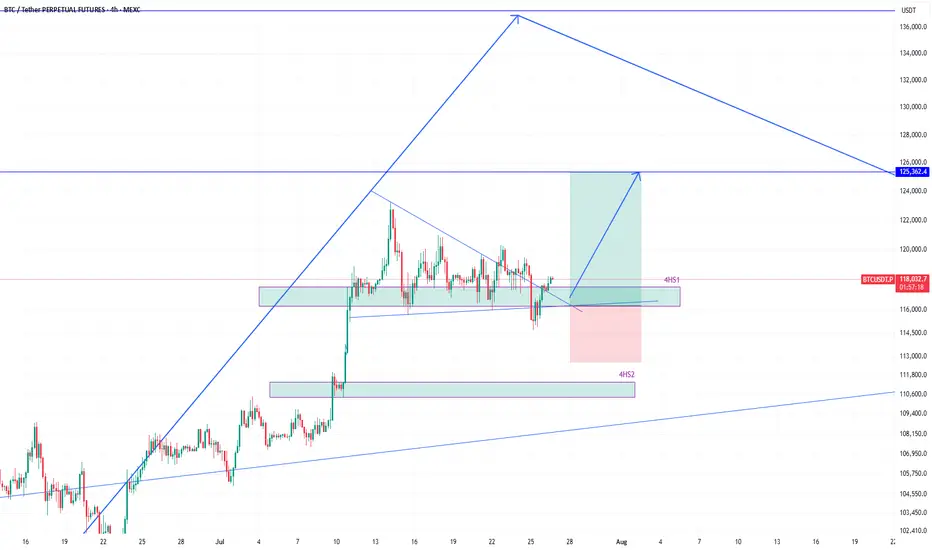
BTCUSDT eyeing 125k next after bounce from 116k zoneEarlier I shared the high time frame view of #BTCUSDT. We know that its heading higher and that helps in holding spot positions.
However, the move to the high frame target will not happen in a straight line, instead with various push to the upside and then subsequent corrections to the down side.
Therefore, as a trader, we must profit from those movements as we see some good high probability setups.
And there is one right now which is a long position.
The price broke 4h support 4HS1, but quickly reclaimed it. That is a sign of demand and strength required to move higher.
Therefore, this presents a long opportunity where the target of this long position should be 125k.
As the price enters into 4HS1 zone, I will scale into long position.
It is quite likely that the price will bounce hard once it taps into 4HS1 zone.
I am talking this long position targeting 125k. What about you? Share with me what you think.
BTCUSDT ready to march towards 140k zoneHere is once again a view of what I had shared when BTCUSDT was trading around 95k in may 2025.
The price action has been similar to our expectation. A push towards 106k-110k and then drop around 95k-98k before boucing towards 137k.
So the next stop for the current upward move is 137k. The push from 98k has brought us into 120k zone and currently we were holding in that range from 114k-120k for a while.
However, this is going to change now. I believe the last drop towards 114k was a false breakdown from 4h support 4HS1 since the price quickly grabbed this region again by moving towards 117k.
I believe the path to 137k-144k is clear now and we see that in coming weeks. After that we shall likely see a correction towards 120k area before move to the target around 150k.
Lets see how the price moves. We will keep monitoring it time to time and I will provide updates. But till now it has been moving according to the plan.
#BTC #BTCUSD #BTCUSDT #BITCOIN #CRYPTO CRYPTOCAP:BTC $crypto

BTC Retested and Ready for the Next Leg Up?This CRYPTOCAP:BTC weekly chart shows a clean pattern of breakout → retest → rally.
The 50 EMA has been acting like a strong dynamic support throughout the uptrend, keeping the structure intact. Every time price broke out of a consolidation or resistance zone, it came back, retested it, and then continued moving higher.
Most recently, BTC broke above a key resistance, pulled back to retest it, and now it looks like the breakout has held. This is a classic bullish continuation setup, and historically, it’s led to strong follow-through moves.
As long as BTC stays above the 50 EMA and holds support, the bullish structure remains intact.
Thanks for reading! Stay sharp and trade safe.

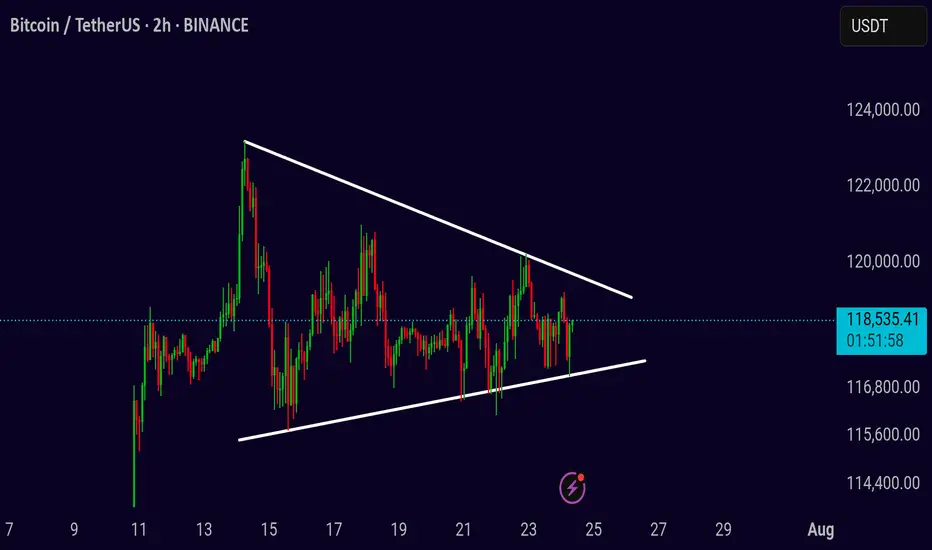
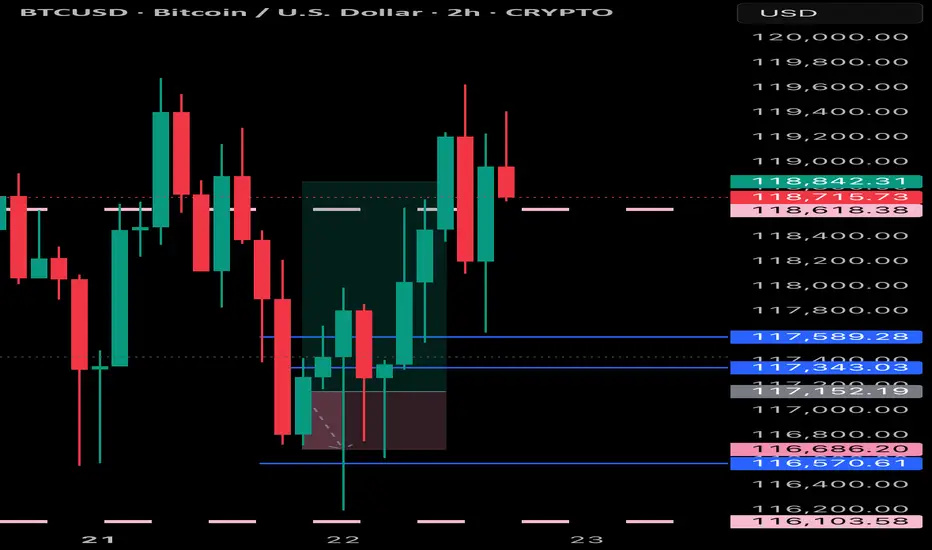
BTC Symmetrical Triangle – Decision Time Soon
BTCUSDT Idea (2H Chart)
BTC is consolidating inside a symmetrical triangle, creating pressure for a breakout. Price is currently ranging between 116K–120K, with volatility compressing.
Patience is key here — don’t rush entries.
A confirmed breakout or breakdown will give the real direction.
Break above the triangle = bullish continuation
Break below = further correction ahead
Wait for 2H close outside the pattern with volume
Watch levels:
* Upside: 120K → 124K → 128K
* Downside: 116K → 112K → 108K
Setup is maturing — breakout is just a matter of time. Let the chart lead, not emotions.
BTCUSD Daily Analysis – Golden Pocket Hold Before a Bullish?🧠 Chart Description & Market Structure:
The BTCUSD daily chart is showing a consolidation phase after forming a local high near $123,231. Currently, the price is retracing and approaching a key Fibonacci retracement zone between the 0.5 level ($115,557) and 0.618 level ($113,740) — also known as the Golden Pocket, which is often a strong reversal area.
---
📈 Bullish Scenario:
If the price holds within or just above the 0.5–0.618 Fibonacci zone (highlighted in yellow) and forms a bullish reversal candlestick (like a hammer, bullish engulfing, or pin bar), there’s a high probability for BTC to resume its uptrend.
Bullish upside targets include:
$119,842 as minor resistance.
$123,231 as the previous swing high and a key breakout confirmation.
A successful break above $123,231 could send BTC toward the next major targets around $128K–$132K.
---
📉 Bearish Scenario:
If the price fails to hold the 0.618 Fibonacci level ($113,740) and breaks down below the key psychological support at $111,500, a deeper correction may occur.
Downside targets:
$108K–$106K as the next major support zone.
A break below this could lead to the formation of a lower high structure and potentially trigger a bearish continuation.
---
📊 Pattern Observations:
Potential Bullish Flag or Rectangle Consolidation: The price action suggests horizontal consolidation after a strong rally — possibly a re-accumulation zone before a bullish continuation.
Golden Pocket Retest: Price is currently testing the Fibonacci 0.5–0.618 zone, often targeted by institutional buyers and technical traders as a potential entry point.
---
🧭 Key Levels to Watch:
Major Resistance: $123,231 (swing high)
Minor Resistance: $119,842
Fibonacci 0.5: $115,557
Fibonacci 0.618: $113,740
Key Support: $111,500
---
🔖 Conclusion:
BTC is currently in a decision zone. Price action within the $115,500–$113,700 range will be crucial. Will this be a healthy retracement before the next leg up — or the beginning of a deeper correction?
#BTCUSD #BitcoinAnalysis #CryptoTA #FibonacciRetracement #CryptoChart #BitcoinDaily #BullishSetup #BearishSetup #CryptoMarket

BTCUSDT Forming Bullish WaveBTCUSDT is currently forming a bullish wave pattern, signaling a potential continuation of its upward momentum. This technical setup suggests a series of higher highs and higher lows, indicative of strong buyer demand and consistent market optimism. With volume remaining robust, the foundation for a significant breakout is solid. If the pattern plays out, analysts expect a 09% to 10% gain in the mid to long term, which could be fueled by renewed institutional interest and global adoption.
Bitcoin has historically responded well to bullish wave formations, often leading to aggressive rallies once key resistance levels are breached. As the largest cryptocurrency by market cap, BTCUSDT not only reflects investor sentiment in Bitcoin itself but also often sets the tone for the broader crypto market. The current price action shows consolidation with positive volume spikes, which further supports the bullish thesis and provides a potential launchpad for another major leg upward.
With increasing attention on macroeconomic shifts, regulatory developments, and halving cycles, Bitcoin continues to position itself as a hedge against traditional market uncertainties. The bullish wave pattern now forming could signal that Bitcoin is entering a new phase of growth, especially as global interest in decentralized finance, ETFs, and blockchain innovation surges.
Traders and long-term investors alike should closely monitor this structure. A breakout with volume confirmation could offer an excellent entry point, backed by strong technicals and a solid fundamental backdrop. The combination of a bullish pattern and broader adoption trends makes BTCUSDT one of the most watched assets in the market right now.
✅ Show your support by hitting the like button and
✅ Leaving a comment below! (What is You opinion about this Coin)
Your feedback and engagement keep me inspired to share more insightful market analysis with you!

BTCUSD RECAPBITCOIN has preformed as expected in short period of time can continue even more to the up side but will wait for good entries
BTCUSD BTCUSD still expecting some good run within to the up side as there’s a new higher price that’s not been touched
Bitcoin Ready for the Next Leg Higher!Bitcoin is currently consolidating within a symmetrical triangle on the 4-hour timeframe, showing signs of a potential breakout. After a strong rally earlier in July, BTC has entered a compression phase, forming lower highs and higher lows — a classic setup for a volatility breakout.
Price is moving near the apex of the triangle, suggesting that a decisive move is imminent. The 50 EMA and 100 EMA are both acting as dynamic support, helping bulls maintain control of the structure. A breakout above the descending trendline could initiate a sharp move toward the $130K–$133K target zone.
Cheers
Hexa
BINANCE:BTCUSDT
BTCUSD BULLYING Bitcoin is still respecting price and is buying can expect some nice moves (New Highs)