Will it break the all-time high again?
Over the past week, the Bitcoin market has seen volatile trends, attracting widespread attention. In terms of price performance, Bitcoin carried forward the upward momentum from the previous week, opening at $103,500 and continuing its upward trend. On May 22nd, Bitcoin reached a high point, breaking through the $110,000 mark and hitting a record high of $112,000. Its market capitalization also surged to over $2.15 trillion, ranking among the top five global asset market capitalizations.
In terms of market capital flows, Bitcoin ETF products saw a total net outflow of up to $616 million on May 30th, with IBIT alone experiencing an outflow of $431 million, ending a consecutive 10-day net inflow trend. However, BlackRock's iShares Bitcoin ETF recorded a total net inflow of over $6.35 billion in May, with assets under management exceeding $71 billion, indicating that institutional investors maintain a long-term optimistic view of Bitcoin, and the short-term outflows are mostly profit-taking.
Humans need to breathe, and perfect trading is like breathing—maintaining flexibility without needing to trade every market swing. The secret to profitable trading lies in implementing simple rules: repeating simple tasks consistently and enforcing them strictly over the long term.
Btcusdtlong
BTCUSDT/IBIT: No Recovery in Sight Yet. Don't Be Fooled.Hello everyone. As I closely examine BTCUSDT and IBIT, I have a significant observation: there are no clear signals yet that selling is slowing down. This means it's too early to speak of a recovery in the market.
As intelligent investors, we look not only at price movements but also at the market's underlying dynamics. Currently, I see no clear indication in either BTCUSDT or IBIT that selling pressure is diminishing.
In such situations, a meticulous examination of the volume footprint is essential. We analyze every detail in the volume to understand if buyers are truly stepping in, and if selling orders are being absorbed. At the same time, I am closely monitoring CDV (Cumulative Delta Volume) divergences. If selling pressure were truly decreasing, we would expect to see clues in the CDV, but as of now, such confirmation is absent.
To confidently state that the market has entered a recovery phase, we need strong and confirmed breakouts on a low timeframe (LTF). Following these breakouts, a successful retest of the broken levels as support would be a reliable signal that the market has shifted direction. However, at present, such a structure has not formed.
As you know, I only trade coins that show a sudden and significant increase in volume. This approach allows me to focus my capital where the market is truly revealing its intentions. My current observation in BTCUSDT and IBIT is that this type of volume increase is not yet signaling a recovery.
Therefore, for those anticipating a market recovery, it is crucial not to act hastily and to await concrete confirmation signals. The market rewards the patient.
📌I keep my charts clean and simple because I believe clarity leads to better decisions.
📌My approach is built on years of experience and a solid track record. I don’t claim to know it all but I’m confident in my ability to spot high-probability setups.
📌If you would like to learn how to use the heatmap, cumulative volume delta and volume footprint techniques that I use below to determine very accurate demand regions, you can send me a private message. I help anyone who wants it completely free of charge.
🔑I have a long list of my proven technique below:
🎯 ZENUSDT.P: Patience & Profitability | %230 Reaction from the Sniper Entry
🐶 DOGEUSDT.P: Next Move
🎨 RENDERUSDT.P: Opportunity of the Month
💎 ETHUSDT.P: Where to Retrace
🟢 BNBUSDT.P: Potential Surge
📊 BTC Dominance: Reaction Zone
🌊 WAVESUSDT.P: Demand Zone Potential
🟣 UNIUSDT.P: Long-Term Trade
🔵 XRPUSDT.P: Entry Zones
🔗 LINKUSDT.P: Follow The River
📈 BTCUSDT.P: Two Key Demand Zones
🟩 POLUSDT: Bullish Momentum
🌟 PENDLEUSDT.P: Where Opportunity Meets Precision
🔥 BTCUSDT.P: Liquidation of Highly Leveraged Longs
🌊 SOLUSDT.P: SOL's Dip - Your Opportunity
🐸 1000PEPEUSDT.P: Prime Bounce Zone Unlocked
🚀 ETHUSDT.P: Set to Explode - Don't Miss This Game Changer
🤖 IQUSDT: Smart Plan
⚡️ PONDUSDT: A Trade Not Taken Is Better Than a Losing One
💼 STMXUSDT: 2 Buying Areas
🐢 TURBOUSDT: Buy Zones and Buyer Presence
🌍 ICPUSDT.P: Massive Upside Potential | Check the Trade Update For Seeing Results
🟠 IDEXUSDT: Spot Buy Area | %26 Profit if You Trade with MSB
📌 USUALUSDT: Buyers Are Active + %70 Profit in Total
🌟 FORTHUSDT: Sniper Entry +%26 Reaction
🐳 QKCUSDT: Sniper Entry +%57 Reaction
📊 BTC.D: Retest of Key Area Highly Likely
📊 XNOUSDT %80 Reaction with a Simple Blue Box!
📊 BELUSDT Amazing %120 Reaction!
📊 Simple Red Box, Extraordinary Results
📊 TIAUSDT | Still No Buyers—Maintaining a Bearish Outlook
📊 OGNUSDT | One of Today’s Highest Volume Gainers – +32.44%
I stopped adding to the list because it's kinda tiring to add 5-10 charts in every move but you can check my profile and see that it goes on..

BTCUSDT on daily support, likely to head to 109kWe have the price revisiting the daily support DS1.
This presents a long opportunity for us.
The price is likely to find support in this zone and bounce from here.
The target of this long trade shall be the daily resistance DR1 marked on the chart. This resistance zone DR1 sits around 109k area.
In case the price reaches there, it is likely to experience some pullback there.
We will reevaluate the price action on DR1 once it reaches there and decide about the next steps.
What do you think about BTC price and this trade setup presented? Share it with me in the comments.

BTCUSDT 4H AnalysisBTC ~ 4H Analysis
#BTC On the 4H Time frame Bitcoin is retesting this multi support level. Let's see how far this support can hold.

Bullish Momentum Building, $112K Breakout on the Horizon?Hey Realistic Traders!
Can BINANCE:BTCUSDT Break Past $112K and Set a New All-Time High? Let’s Break It Down...
Trend Analysis
On the H4 timeframe, BTCUSDT has consistently traded above the EMA-90 line, confirming the continuation of a bullish trend. Within this trend, a falling wedge pattern formed, which is typically considered a bullish reversal signal. This pattern was followed by a breakout marked by a bullish Marubozu candle, further strengthening the bullish outlook.
In addition, a bullish crossover appeared on the oscillator, providing additional confirmation of upward momentum. Based on these technical signals, the price is expected to continue its upward move toward the first target at 113,613, with a potential extension to the second target at 117,968.
The outlook remains valid as long as the price stays above the key stop-loss level at 105,681.
Support the channel by engaging with the content, using the rocket button, and sharing your opinions in the comments below.
Disclaimer: "Please note that this analysis is solely for educational purposes and should not be considered a recommendation to take a long or short position on Bitcoin.

$FWOG/USDT Ready to Fly MEXC:FWOGUSDT has officially broken out of its long-term downtrend and flipped the key resistance zone into support.
After a clean retest of the breakout level around $0.07021, the price is showing strength again.
With bullish momentum building, this setup offers a solid potential upside, targeting the $0.52424 zone, a 643% move from here.
As long as the price holds above the green demand zone, this chart looks primed for a strong rally.
DYRO, NFA

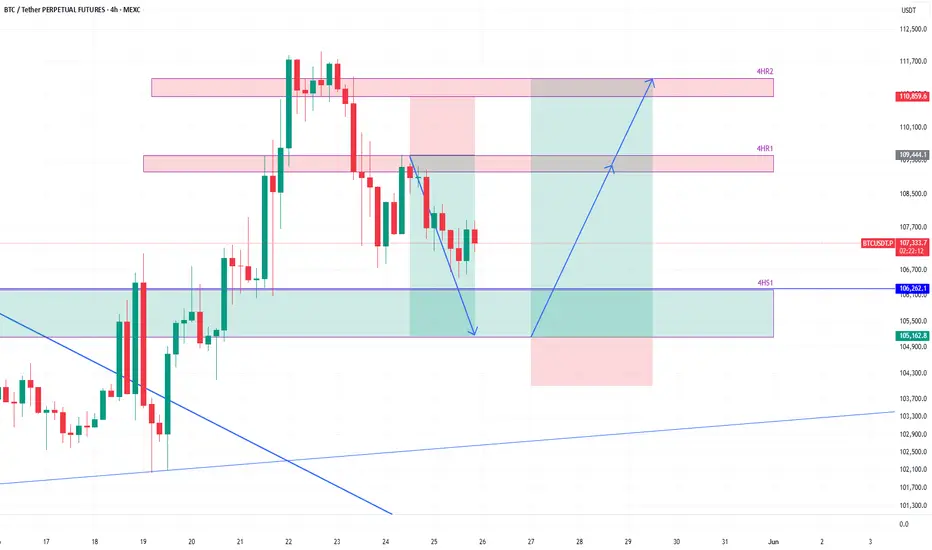
BTCUSDT to bounce from 4h supportHere is an idea for trade on BTCUSDT. The price is coming close to the 4h support zone 4HS1.
It is likely that it will find support there and bounce from there towards 4h resistance 4HR1 and possibly towards 4HR2.
We will take some profit at 4HR1 level if the price reaches there and look to refill the position on any pullback.
We will also reevaluate if the price is really heading towards 4HR2 or likely to go around 96k-97k before fueling up for upward move.
BTCUSDT 4H Analysis BTC ~ 4H Analysis
#BTC Let's start Long/Buy back at this support block with long term target of $120K - $130K - $140K - $150K above this is just bonus for you.

BTCUSDT Hello everyone!
Today's first signal came from the BTCUSDT pair. After reaching an all-time high of $112,000 yesterday, BTC formed an ABCD pattern and retraced down to the Fibonacci extension level 1.000. In this pattern, a buy trade is typically initiated after the price retraces to the 1.000 level, and the Take Profit is set at the 0.618 Fibonacci level drawn from the B wave to the D wave.
Although I didn’t open this trade based on the ABCD strategy, I noticed the pattern forming and wanted to share it with you purely for educational purposes.
As for the current active trade, here are the detailed parameters:
🔍 Trade Details:
✔️ Timeframe: 15-Minute
✔️ Risk-to-Reward Ratio: 1:1.50
✔️ Trade Direction: Buy
✔️ Entry Price: 110844.19
✔️ Take Profit: 111497.09
✔️ Stop Loss: 110408.00
🔔 Disclaimer: This is not financial advice. I'm sharing a trade I'm personally taking based on my own system, strictly for educational and illustrative purposes.
📌 Interested in a systematic, data-driven approach to trading?
💡 Follow the page and turn on notifications to stay informed about future trade ideas and advanced market insights.

$MAGIC is breaking out after 30+ days of consolidation!Now testing the trendline with strong support at $0.16–$0.17 and holding above the 100 EMA.
If confirmed, we could see a move toward $0.36+ 🚀
Entry: CMP $0.1811
SL: $0.1631
Target: $0.3623
DYRO, NFA

BTCUSDT✅ New Trade Opportunity on BTCUSDT
There’s a new trade opportunity on BTCUSDT.
Earlier this morning, I took a trade but chose not to share it due to higher risk — it ended up hitting take profit.
Now, I’m entering a new setup and wanted to share it with you.
Since BTC is currently trading near all-time highs, I’ve kept the **Risk-to-Reward Ratio conservative at 1:1 for now.
However, if I see strong bullish momentum, I may extend the take profit target to \$112,400 — which I believe is likely to be tested later today.
🔍 **Trade Details:**
✔️ Timeframe: 15-Minute
✔️ Risk-to-Reward Ratio: 1:1
✔️ Trade Direction: Buy
✔️ Entry Price: **111,034.51**
✔️ Take Profit: **111,712.33**
✔️ Stop Loss: **110,479.90**
🔔 **Disclaimer:** This is not financial advice. I'm simply sharing a trade I'm personally taking based on my own system, strictly for educational and illustrative purposes.
📌 **Interested in a systematic, data-driven approach to trading?**
💡 Follow the page and turn on notifications to stay informed on future trade ideas and professional market insights.

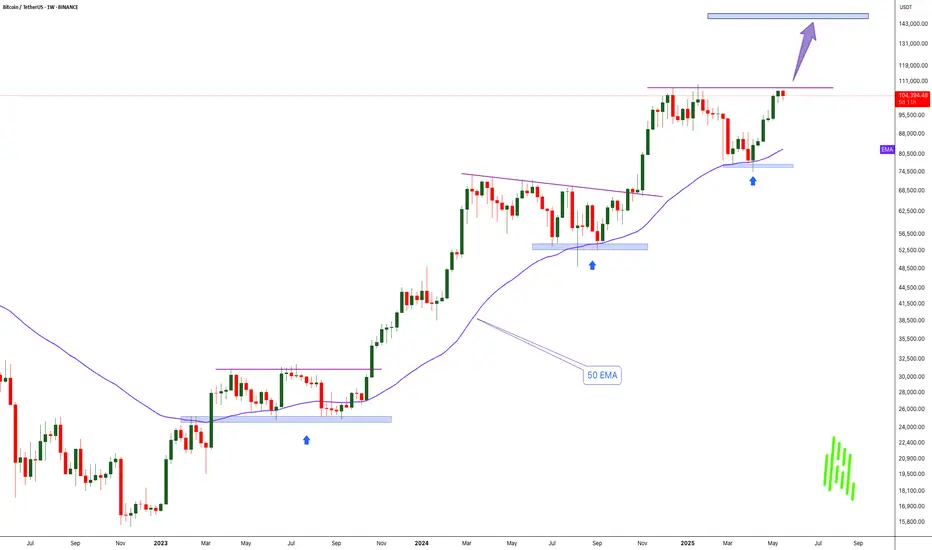
BTC Building Strength – Breakout Ahead?$BTC/USDT Weekly Analysis
Bitcoin continues to respect the 50 EMA on the weekly timeframe — a key dynamic support level that has consistently held throughout this bullish structure.
Each time BTC corrected, it found support near the 50 EMA before bouncing back with strength. The current structure mirrors past price action, with price again rebounding from the EMA after a consolidation phase.
We’re also seeing a pattern of lower highs forming a potential descending resistance line. A breakout above this trendline could trigger a fresh rally, possibly taking BTC to new highs.
As long as Bitcoin stays above the 50 EMA, the mid-to-long-term bias remains bullish. A confirmed breakout above the descending resistance could open the door for a strong upside continuation.
DYOR, NFA
Thanks for following along — stay tuned for more updates!

Bitcoin: Bullish Momentum Tests 109k, Eyes 110k
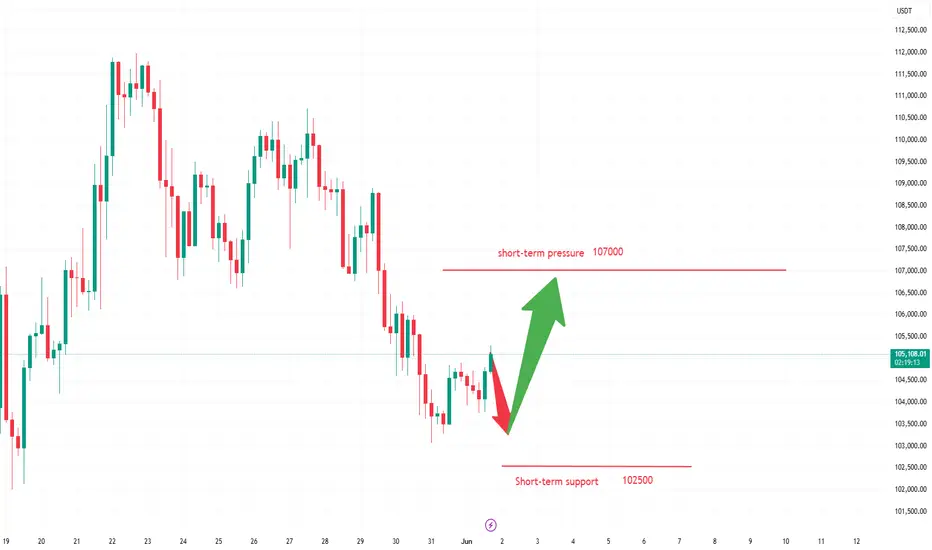
The Bitcoin price fluctuated in a narrow range near the 106,000 level 😊. After touching the 106,800 level, it failed to break through the 107,000 resistance level and subsequently fell back to consolidate near the 106,200 level 😐. Shortly after, the bulls regained momentum, pushing the price rapidly higher to hit a high of 109,410 🚀! Currently, the price is consolidating near the 109,100 level 🔄.
From a technical perspective, the 107,000 resistance level has turned into support after being broken, with short-term momentum favoring the bulls 👊. If the price can hold above 109,000, it may further challenge the psychological barrier of 110,000 🌟. However, caution is warranted regarding potential pullbacks from high levels 🚨. Key support below lies in the 107,000–106,200 range ⚠️.
For trading strategies: Short-term traders may consider light-position entry after the price stabilizes above 109,000, targeting 110,000 🎯. If the price pulls back and holds at the 107,000 support level, dip-buying opportunities may emerge 💰. Medium-term investors should adjust positions flexibly based on whether the 110,000 level is breached 📊.
Overall, market sentiment remains optimistic 😃, but attention should be paid to trading volume confirmation and unexpected news events 📢. Strict risk control and cautious operations are recommended ⚖️!
Buy@108000-108500
tp:109500-110500
Professional trading strategies are pushed daily 📊
Lock in precise signals amid market fluctuations 🚀
Confused about market trends? Stuck in strategy bottlenecks?
Real-time strategies serve as your "trading compass" 🌐
From trend analysis to entry/exit points, dissect market logic comprehensively
Refer now 📲
Help you move steadily forward in investments ✨
👇👇👇

History Repeats: Bitcoin Bounces from Weekly 50 EMA-$150K Next!!MARKETSCOM:BITCOIN continues to show exceptional strength and bullish momentum. If we look back at the charts from 2023 and 2024, a clear pattern emerges — every time BINANCE:BTCUSDT touched the 50 EMA on the weekly chart, it led to a significant rally and eventually new all-time highs. That same setup seems to be unfolding again right now.
Recently, COINBASE:BTCUSD tested the 50 EMA around the $75,000 level and has since bounced strongly. The price has reclaimed the $100,000 mark and is now challenging previous all-time high resistance. Historically, after a successful bounce from this key moving average, Bitcoin hasn’t just recovered — it’s exploded to new highs.
Based on this repeating pattern, our current cycle target is set at $150,000. A clean breakout above the current resistance zone could be the catalyst that propels BYBIT:BTCUSDT Bitcoin into uncharted territory once again. The structure remains bullish, momentum is building, and the trend clearly favors the upside.
This is a classic “Buy and HODL” moment. The technicals are aligning, the market psychology is shifting, and all signs point toward a continued bull run. Buckle up — it looks like we’re in for another legendary Bitcoin rally.
#BTC/USDT#BTC
The price is moving within a descending channel on the 1-hour frame, adhering well to it, and is heading for a strong breakout and retest.
We are experiencing a rebound from the lower boundary of the descending channel, which is support at 103200.
We are experiencing a downtrend on the RSI indicator, which is about to break and retest, supporting the upward trend.
We are looking for stability above the 100 moving average.
Entry price: 103708
First target: 104152
Second target: 104900
Third target: 105900

BTC | New ATH Incoming | + 135% ??A very interesting fractal from 2021 lead to a 135% increase - and a new all time high.
Bitcoin has been following similar patterns to the bullish twin-peaks in 2021. After a multi-month correction, the price proceeded to increase another 135% over the next few months. Some weeks fast, and some weeks sideways.
Is it possible that BTC follows a similar pattern - and increase another 135%, all the way to 170k?
Hec, I'd even be happy with just a 100% ! That would lead us up to around 149k, which can also be considered a phycological resistance zone.
While you're here! Check out this post on PEPE:
_________________
BINANCE:BTCUSDT

BTCUSDT: Drops Towards $53000 region may help us hitting $80000.BINANCE:BTCUSDT price currently in making of AB=CD pattern, it is likely to touch and reject at the $53000 which area remain crucial for most of the swing investors. The following news we can significant impact in the crypto market also 50k to 53k area remain extremely bullish. With accurate entry at 530000 area when we can target 80-100k possibly.

BTCUSDT: Safe Zone Vs Risk Zone, Which one would you choose? Dear Traders,
WE have possible buying opportunities, with the first entry, the only reason that we think that price would reverse is, possible end of year bullish push which may take price to another record higher high. Although, since the price already has rejected we think price is unlikely to reject at the level, and may drop to 75k region.
good luck.

#BITCOIN: Another drop and then Swing Bounce $125,000The current market sentiment is bearish, indicating a potential further decline towards the 65k price point. However, we anticipate a rebound towards the 125k region. As we approach the 65k threshold, we expect a substantial price increase.
To make informed investment decisions, it is crucial to observe a strong bullish trend before considering any bullish entries.
For more insights and market analysis, please like and comment.🚀❤️
Team Setupsfx_

#BITCOIN: $130,000 Is Where Price Headed To? BINANCE:BTCUSDT consolidated at 75k and reversed from the region as predicted in our previous chart. We now have strong confirmation that price will likely break through the daily bearish trendline. We can enter when it retests the identified area.
We have two major targets. Do your own research and analysis, and use this as secondary bias.
Good luck trading.
❤️
Hope you’re having a great weekend.
Team Setuspfx_

#BTCUSDT:Price Moving Well From $88,000 to $96,000,Next $128,000Bitcoin has moved well from our last idea of $88,000 to $96,000. However, a small correction is expected, which could be a good point to enter a swing trade. This could take the price to a new record high of around $128,000.
We have three targets, but each can be set based on your overview. The last three candles are not clear, so it’s best to wait for price to have a clearer indication of its next move.
We wish you the best and good luck in your trading journey. Thank you for your unwavering support! 😊
If you’d like to contribute, here are a few ways you can help us:
- Like our ideas
- Comment on our ideas
- Share our ideas
Team Setupsfx_
❤️🚀

Scenario #BTCUSDT long📉 LONG BYBIT:BTCUSDT.P from $104,353.0
🛡 Stop loss: $103,572.0
🕒 Timeframe: 1H
✅ Market overview:
➡️ The price confidently broke above $103,729 and held, confirming the uptrend.
➡️ The next target zone is $104,720–$105,090 — nearest movement objectives.
➡️ Volume increased during the impulse, indicating strong buyer presence.
➡️ A local support level formed around $103,729 — on a pullback, this zone may hold the price.
➡️ POC at $94,479 remains far below — the market has left the balance zone and is trading in an impulsive phase.
🎯 TP Targets BYBIT:BTCUSDT.P :
💎 TP1: $104,720.0
💎 TP2: $105,090.0
💎 TP3: $105,275.0
⚠️ Important: current structure BYBIT:BTCUSDT.P suggests possible correction (wedge breakdown), requiring caution or exit on key level loss.
⚠️ Despite the initial long from $104,353, a breakdown below $103,572 (stop loss) invalidates the long setup.
📢 If H1 closes below $103,572 — better to exit, scenario invalid.
🚀 Scenario BYBIT:BTCUSDT.P valid while holding above $103,729 — below that, correction likely toward lower targets!

Bitcoin bullish rsi can lead to 133kbitcoin can lead to 133k without any stop as bullish convergence and diversion has been identified with RSI above 50 there is no stopping.
MA & EMA BOTH ARE SHOWING GOLDEN CROSS OVER .
Probable higher high ,lower low pattern can form for more push to 200k
