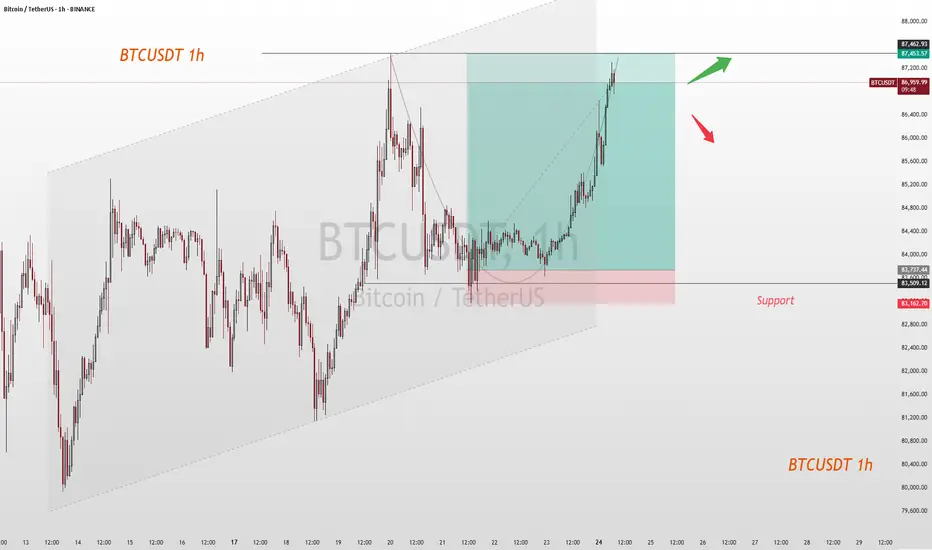
BTCUSDT: Target Achieved, What's Next for 87,500 Resistance?Upon reviewing the trading strategy devised last week, the current market price has successfully rallied to the targeted level. Bitcoin against Tether (BTCUSDT) is quoted at 86,780, registering an intraday gain of 0.84%. From the vantage points of technical analysis and market dynamics, the robust resistance level in the vicinity of 87,500 above emerges as a pivotal factor in determining whether the price can sustain its upward trajectory.
I will share trading signals every day. All the signals have been accurate for a whole month in a row. If you also need them, please click on the link below the article to obtain them.
Btcusdtlong
$BTC FINALLY BULL RALLY ON CHART NOW & 2nd TAKE PROFIT DONEJUST IN NEWS : BTC Bear Market To Last 90 Days, Analyst Predicts, as Trade War Fears and Whale Activity Impact Prices
Bitcoin has entered a bear market, with its price dropping over 20% from its all-time high. Market analyst Timothy Peterson expects the downturn to last 90 days, arguing that this decline is weaker than most past bear markets. He noted that out of the 10 previous downturns, only four—2018, 2021, 2022, and 2024—have been worse in terms of duration. Peterson does not see BTC sinking far below $50,000 but says a slide in the next 30 days could be followed by a 20-40% rally after April 15. He believes this could trigger renewed buying interest and push Bitcoin higher.
Investor sentiment has been affected by global trade war concerns following tariffs imposed by U.S. President Donald Trump and retaliatory measures from multiple trading partners. The uncertainty has led to a decline in speculative investments. The Glassnode Hot Supply metric, which tracks BTC held for a week or less, has fallen from 5.9% in November 2024 to 2.3% by March 20, signaling reduced short-term trading activity. A CryptoQuant report also suggests that most retail investors are already in the market, countering expectations that a surge of new traders would drive prices up.
Ether has also struggled, losing over 51% in three months since peaking above $4,100 on December 16, 2024. Analysts say ETH must reclaim the $2,200 range to gain upward momentum. “If price can generate a strong enough reaction here, then #ETH will be able to reclaim the $2,196-$3,900 Macro Range (black),” wrote crypto analyst Rekt Capital in a March 19 X post. Despite positive regulatory developments, such as the U.S. Securities and Exchange Commission dropping its lawsuit against Ripple, ETH has yet to see significant gains.
Market uncertainty remains high, with some analysts expecting economic pressures to last until at least April 2025. Despite short-term volatility, long-term projections remain optimistic. VanEck has predicted a $6,000 cycle top for ETH and a $180,000 peak for BTC in 2025.
Disclaimer: This article is for informational purposes only and does not constitute financial advice. Always conduct your own research before making any investment decisions.

Bitcoin (BTC/USD) 4H Analysis: Bullish Breakout or Pullback?🔍 Key Observations:
🔹 📈 Trendline Breakout: The descending trendline (white) has been broken, signaling a potential uptrend.
🔹 📍 Support & Resistance Zones:
🟢 Strong Support (~$80,349 - $82,000): 📉 If price drops, this zone could act as a bounce area. 🛑 Stop-loss is placed below.
🟡 Resistance (~$86,000 - $88,000): 🔄 Currently testing this level—either a breakout or a rejection could follow.
🔵 Next Target (~$94,000): 🚀 If Bitcoin pushes above resistance, this could be the next stop.
📊 Possible Price Action Scenarios:
✅ Bullish Path:
🟢 Breaks Above $86,000 → Targets $94,000 🚀
🔄 Small retest of support before continuing up 📈
❌ Bearish Path:
❌ Rejected at $86,000 → Pullback to $82,000 🔽
📉 If support fails, price may drop further
🎯 Conclusion:
🔥 Bullish Bias: 🟢 A breakout above $86,000 increases the chance of hitting $94,000+.
⚠️ Watch for retests! 🔄 A pullback before an upward move is possible.
🚀 Final Thought: If BTC **

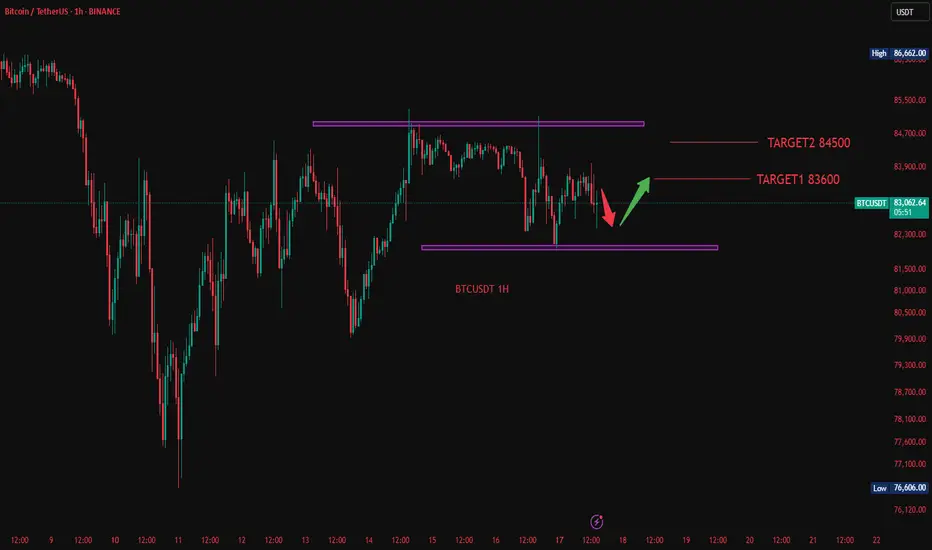
BTC Nears Key Breakout: Can It Push Past 84.5K?Right then, BTC/USDT is at a bit of a crucial point at the moment. The buying range we flagged earlier, 82,000 - 83,500, has been left behind, with the price now sitting at 84,139.51 – up 0.06% on the day.
The target for taking profits is still 84,500 - 86,000, and we’re currently hovering near the lower end of that at 84,500. If it manages to break through that level, there’s a decent chance it could push higher – but it’s worth keeping an eye on whether the rally’s got enough steam to keep going.
Things to watch:
84,500 Breakout: If it cracks this level and holds, we could be in for more upside.
Momentum: Keep tabs on volume and market sentiment to see if this move’s got legs.
Pullback Risk: If it doesn’t break through, don’t be surprised if we see a bit of a dip.
BTCUSDT
Buy82000-83500
tp:84500-86000
I will share trading signals every day. All the signals have been accurate for a whole month in a row. If you also need them, please click on the link below the article to obtain them.

BTCUSDT:Wait for retracement and go longBTC has been fluctuating around 84,000, showing an overall upward trend in its movement. It is advisable to continue waiting for a pullback before taking a long position.
BTC Trading strategy:
buy@83500
TP1:85500
TP2:86500
Get daily trading signals that ensure continuous profits! With an astonishing 90% accuracy rate, I'm the record - holder of an 800% monthly return. Click the link below the article to obtain accurate signals now!

BTCUSDT , we near to bullish runHello everyone
According to the chart that you see , we were in correction wave from the top until now , but the wave of correction is weakness and we think that the price wanna re-check the downward trendline and after that is ready to start bull run.
if you have any question and need help for managing your portfolio send us messages
Thank you
AA

BTCUSDT TRDAING POINT UPDATE > READ THE CHAPTIAN Buddy'S dear friend
SMC Trading Signals Update 🗾🗺️ crypto Traders SMC-Trading Point update you on New technical analysis setup for crypto BTC USDT list time post signals 💯 reached target 🎯✔️ New technical analysis Setup two said fisrt make close above ground that expect bullish trend 🚀 target point 88k 90k. Next patterns if close below 👇 ⬇️ 83k 80k strong 💪 support level up trand target point 88k 90k fisrt entry risk 🙏. Good luck 💯💯
Key Resistance level 87k + 80k + 90k
Key Support level 83k - 80k
Mr SMC Trading point
Pales support boost 🚀 analysis follow)

Long Term Bitcoin SituationRemember the time that we broke out the major bull flag in Bitcoin? It caused many new all time high levels in recent months. The problem is that Bitcoin lost its 5 waved bullish momentum. We see an upwards move only because of the fundemantel news.
I believe we are currently in a correction phase known as A-B-C pattern according to Elliot Waves theory. In order for Bitcoin to create another all time high level, there some requirements to achieve.
First, another bullish fundemantel actor in macro economic events. This could be an interest rate cuts, something about ETF's or even some crayz idea from Trump himself. Problably, it will be about intrest rates to be cut down in next june.
Second, Bitcoin needs to gain its delta momentum back (it's called CVD). For many weeks while Bitcoin has risen up, there were some significant movements in futures section. Bulls and long term holders were keeping their positions. With acceptence of the ETF's, spot Bitcoin volume was increased as well. The problem about this part of the story is, big instutial money that carried Bitcoin upwards is leaving. It's mostly because of the new politics that Trump has brought to the US. Instutial money or simple retail traders don't really like when there is an uncertainity about the economy. Fear and uncertainity is taking smart money away from Bitcoin. When this situation changes, money flow will change again and Bitcoin may catch the momentum it needs.
As the last requirement, Bitcoin hasn't actualy swept all the remaining liquidtiy below the lastly formed bullish flag. It's important for two reasons:
1: In technical terms, it will be fine retest and safe entry.
2: All the rookies who play around with futures sections in exchanges will be eliminated. So there will enough liquidty to go upwards again.
Remember, market always run for the liquidty and all the tecnical things you heard from people around is shaped by this consept. We will meet below 70K again before this summer.
For short term, I believe there will be another uprising move before upcoming pullback. It will be a short one and will get people in.
You see RSI below the chart that it's broken a trendline. Usually it's something good but in this case, even though some other indicators tells us that Bitcoin catch is momentum back again, I don't believe its that simple. As an another example, MACD also screaming out for Bitcoin to rise at the this moment in the daily chart. As I mentioned earlier, it's all caused because of the fundemantel news. Nothing real.
Good Luck to us all .

#BTC #BTCUSDT #BITCOIN #LONG #Scalp #Scalping #Eddy#BTC #BTCUSDT #BITCOIN #LONG #Scalp #Scalping #Eddy
BTCUSDT.P Scalping Long Setup
Important areas of the upper time frame for scalping are identified and named.
This setup is based on a combination of different styles, including the volume style with the ict style.
Based on your strategy and style, get the necessary confirmations for this scalping setup to enter the trade.
Don't forget risk and capital management.
The entry point, take profit point, and stop loss point are indicated on the chart along with their amounts.
The responsibility for the transaction is yours and I have no responsibility for not observing your risk and capital management.
Be successful and profitable.


BTCUSDT EA MAN UPDATE >READ THE CHAPTAIN **BTCUSDT EA MAN Update – Analysis in English**
---
### **BTC/USDT Analysis (15 min) – Bullish Trend in Sight**
#### **Key Observations:**
- **FVG Support Zone (Fair Value Gap):** The price has reacted positively to this zone and is showing signs of a bullish recovery.
- **EMA Confluence:** The price is currently below the 30 EMA (red), but a breakout above could confirm stronger bullish momentum.
- **Target Point:** The analysis anticipates a move towards **85,104 USDT**, possibly after a slight pullback to test the support zone.
If the price sustains above the 30 EMA and breaks through the minor resistance, the bullish target seems achievable.

BTCUSDT - UniverseMetta - Signal#BTCUSDT - UniverseMetta - Signal
D1 - Potential formation of Double Bottom + formation of the 3rd wave from the level. It is better to reduce risks - news background + correction. Stop at the minimum of the 2nd wave.
Entry: 85302.95
TP: 87193.74 - 90677.11 - 94083.46 - 99390.73
Stop: 81089.58

Bitcoin Correction & Accumulation Phase!#Bitcoin is in a correction and accumulation phase, something we’ve seen multiple times in this cycle.
As long as we don’t see any bearish confirmation on the higher time frame, this remains a normal correction within the bull run
We’re near the range's lower bound, which could be a good spot for short-term long setups on lower timeframes.
The next bullish breakout requires a weekly close above $110,000 🚀
History repeats itself—stay patient, accumulate smartly
What’s your strategy during these corrections? Let’s discuss it! 👇
DYOR, NFA

Today's Trading Strategy Analysis for BTCUSDTThe uncertainty within the global macroeconomic landscape wields a substantial influence over the trajectory of BTCUSDT.
On one hand, the escalating anticipation of a deceleration in global economic growth has spurred investors' appetite for safe - haven assets. Bitcoin, characterized by its capped supply and decentralized nature, has been singled out by a segment of investors as a viable safe - haven alternative. This perception, to a notable degree, props up its price.
Conversely, the monetary policy maneuvers of central banks globally, including potential interest rate hikes or liquidity - tightening initiatives, can markedly sway the direction of capital flows. Should funds reverse course from the high - volatility cryptocurrency sphere back into the traditional financial domain, Bitcoin's price is likely to encounter downward momentum.
Moreover, the recent upsurge in international trade tensions has thrown the global economic equilibrium into disarray. The consequent spike in market anxiety has compelled investors to re - assess their portfolio allocations, thereby exerting an indirect but significant impact on the price gyrations of BTCUSDT.
BTC trading strategies:
buy@82500-83000
tp:84500
sell@83800-84300
tp:82000
Traders, if this concept fits your style or you have insights, comment! I'm keen to hear.
For those who are seeking professional guidance in trading trend analysis, strategy formulation, and risk management, please click below to get the daily strategy updates.

BTC:Today's Trading StrategyThis morning, BTC has challenged the 84,000 price level. Currently, it has been fluctuating around 83,000 for a certain period. There is a high likelihood that it may witness another wave of upward movement at any moment. Today, I still adhere to the long-position trading strategy.
BTC Trading strategy:
buy@82600
TP1:83600
TP2:84500
I always firmly believe that profit is the sole criterion for measuring strength. I will share accurate trading signals every day. Follow my lead and wealth will surely come rolling in. Click on my profile for your guide.

BTC:Wait for opportunities and continue to go longToday, Bitcoin has experienced relatively limited price fluctuations, oscillating within a range of around 1,000 points. It has consistently failed to break through the resistance level of 84,000.
However, I believe that after a period of retracement, it will make another attempt to breach the resistance level. We can wait for the retracement to go long.
Trading strategy:
buy@82600
TP1:83600
TP2:84500
BTCUSDT TRADING POINT UPDATE >READ THE CHPTAIANBuddy'S dear friend
SMC Trading Signals Update 🗾🗺️ crypto Traders SMC-Trading Point update you on New technical analysis setup for crypto BTC USDT. ) list time post signals 💯 reached target point ) 👉 New technical analysis setup BTC USDT looking for bullish trend 📈 FVG level support level. 83k 82k support level 87k 88k resistance level ). Guys 🤝 good luck 💯💯
Key Resistance level 87k + 88k
Key Support level 83k - 82kà
Mr SMC Trading point
Pales support boost 🚀 analysis follow)

BTC:Successfully predicted the rebound of BTCSuccessfully predicted the rebound of BTC, and the trading strategy has made a profit again.
I always firmly believe that profit is the sole criterion for measuring strength. I will share accurate trading signals every day. Follow my lead and wealth will surely come rolling in. Click on my profile for your guide

BTC:The latest trading strategyPreviously, BTC continued to decline after approaching the resistance level.
However, it has now started to recover, and a small upward rally is expected in the short term. We can seize this opportunity and go long.
The latest trading strategy for BTC:
buy@82600
TP1:83600

Bitcoin’s Monthly RSI Nearing Danger Zone – Time to Sell?The chart above illustrates Bitcoin’s price action alongside the Relative Strength Index (RSI) on a monthly timeframe, which helps identify overbought and oversold conditions. Historically, Bitcoin’s major bull cycle peaks in 2013, 2017, and 2021 coincided with the monthly RSI reaching between 85-95, as highlighted by the blue circles. A downward trendline connects these peaks, suggesting that each cycle has seen slightly lower RSI highs, indicating a potential long-term momentum decline.
Currently, the RSI is approaching this historical resistance zone, signaling that Bitcoin may be nearing its market peak. If this trend continues, it could mark the final phase of the bull run, making it a strategic period for profit-taking. Traders should closely monitor RSI behavior, as a rejection from this level could indicate the start of a correction.
Historically, a monthly RSI of 85-95 has been a strong sell signal, marking the end of Bitcoin’s bull markets. If Bitcoin follows this pattern again, a distribution phase followed by a downturn could be expected.

Bitcoin's 1065-Day Bull Run Nearing Its End – A Cycle ComparisonThis chart illustrates Bitcoin’s historical price action over three major market cycles, each lasting approximately 1065 days (35 months). The pattern suggests that Bitcoin follows a well-defined four-year cycle, influenced by its halving events. Each cycle begins with a bearish phase (marked in red), followed by a strong uptrend (green), leading to a peak before another correction phase starts.
A key observation is that the duration of each bull run remains consistent, lasting around 35 months (~1065 days) before reaching its peak. Historically, Bitcoin has followed a similar trajectory, with price action mirroring previous cycles. If this pattern holds, the current bull run may reach its peak within the next 6-8 months, placing the market top around late 2025.
Additionally, past cycles show that altcoins tend to experience their strongest moves after Bitcoin peaks, meaning an altseason could emerge by Q3–Q4 2025.

BTC:In the short term, it may start to rise continuouslyAs I analyzed yesterday,The chart shows a bullish reversal pattern, likely an inverse head and shoulders or a bullish triangle breakout.
After a brief pullback, BCT has started to rise. We can still buy below 84,500. However, it should be noted that if it rises to 85,500, it may reach the resistance level. At this time, we can stop making purchases.
Today's trading strategy for BTC:
buy@83710
SL: 83256
TP1:84500
TP2:85500
I always firmly believe that profit is the sole criterion for measuring strength. I will share accurate trading signals every day. Follow my lead and wealth will surely come rolling in. Click on my profile for your guide.

BTC: Daily AnalysisThe chart shows a bullish reversal pattern, likely an inverse head and shoulders or a bullish triangle breakout.
The price has broken out of the triangle formation, indicating a potential continuation of the uptrend.
The setup suggests a bullish outlook with a well-defined entry, stop loss, and take-profit levels.
If the price holds above the entry level and breaks resistance, the next targets could be achieved.
If BTC drops below the stop loss, the trade would be invalidated, signaling a potential downtrend or retest of lower support.
Trading Plan:
BUY@83,710 USDT
SL: Placed around 83,256 USDT to manage risk.
Targets:
1st Target: ~84,500 USDT
2nd Target: ~85,500 USDT
I always firmly believe that profit is the sole criterion for measuring strength. I will share accurate trading signals every day. Follow my lead and wealth will surely come rolling in. Click on my profile for your guide.
