#BTC Rising Wedge📊#BTC Rising Wedge📉
🧠From a structural perspective, we started to fall after building a short structure near the blue resistance zone and the downward trend line. Because it is a downward trend line at the daily level, we need to be wary of a deep pullback of at least $5,000+.
The first support area can be watched around 82,662-83,800.
The second support area can be watched around 81,112-81,628.
➡️From a graphical perspective, the previous 4-hour upward trend has ended because a classic rising wedge model has been formed, and we generally fall according to this model.
➡️From a cyclical perspective, the daily downward trend may be coming to an end. Because we are currently in the daily support area and have been consolidating here for a long enough time, a healthy pullback is a good time for us to participate in long trades.
Let's take a look👀
🤜If you like my analysis, please like💖 and share💬
BITGET:BTCUSDT.P
BTCUSDTPERP
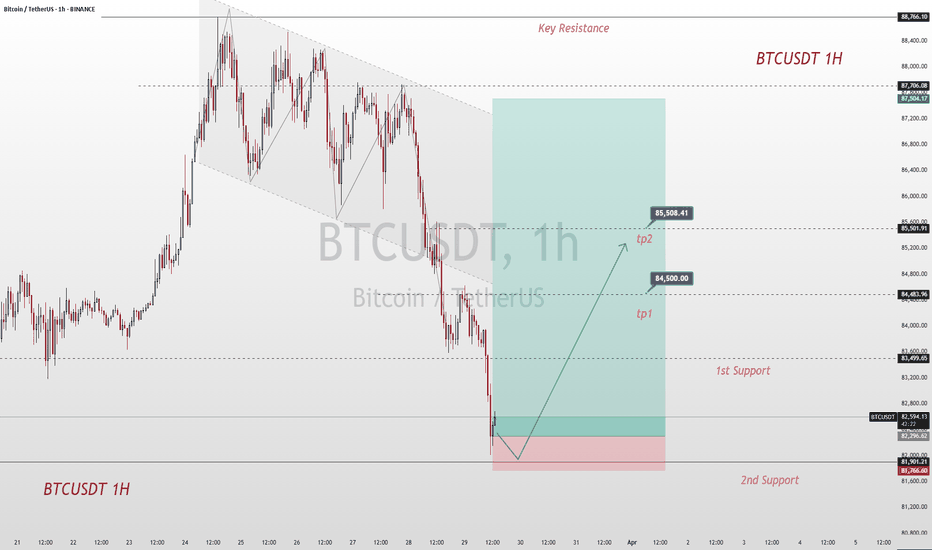
U.S. Econ Shocks: Bitcoin & Profit SignalsThe latest U.S. economic data has brought significant impacts. The core PCE inflation witnessed a 0.4% month - on - month increase, hitting the highest growth in a year, with a year - on - year rise of 2.8%, exceeding market anticipations. Meanwhile, the long - term inflation expectation from the University of Michigan has soared to a 32 - year high, intensifying market concerns about inflation's resurgence. Currently, the market remains enveloped in macro - risks, pending a softening of market sentiment.
Turning to the Bitcoin market, as depicted in today's price trend (the current BTCUSDT price is $82,338.01, dropping by $2,086.37, a 2.47% decline), the K - line chart analysis indicates a downward trend. The Williams indicator signals an oversold condition. Additionally, trading volume has contracted recently, with both price and volume decreasing, suggesting a sluggish and inactive market.
Nevertheless, if Bitcoin can stabilize above $82,000 and there are signs of capital reflux, gradual position - building may be considered, with a target price set above $90,000. Investors must recognize that the Bitcoin market brims with uncertainties. Variables such as forthcoming U.S. economic data, regulatory policies, and geopolitical scenarios will all sway Bitcoin prices. In this volatile financial landscape, meticulous analysis and judicious decision - making are of utmost importance for investors navigating the Bitcoin market.
BTCUSDT
buy@82000-83000
tp:84500-86500
I will share trading signals every day. All the signals have been accurate for a whole month in a row. If you also need them, please click on the link below the article to obtain them.
15-Min Bitcoin Setup – Quick Scalping Opportunity?First of all, I must say that this is a short-term analysis in a 15-minute time frame . Please be careful .
Let's take risks while respecting capital management. Be sure to respect capital management.
Bitcoin ( BINANCE:BTCUSDT ) is currently trading in the support zone($84,120_$81,500) , Potential Reversal Zone(PRZ) near the lower line of the ascending channel .
In terms of Elliott Wave theory , it seems that Bitcoin could complete its 5 bearish waves near the lower line of the ascending channel .
Also, we can see the Regular Divergence(RD+) between Consecutive Valleys .
I expect Bitcoin to be able to rise to at least $85,400.
Cumulative Short Liquidation Leverage: $86,397_$85,760
Cumulative Long Liquidation Leverage: $84,262_$83,336
Note: One of the reasons for Bitcoin's decline is the decline in US indices such as CME_MINI:NQ1! , SP:SPX , and TVC:DJI .
Note: If Bitcoin falls below $83,000, we can expect more dumps.
Please respect each other's ideas and express them politely if you agree or disagree.
Bitcoin Analyze (BTCUSDT), 15-minute time frame.
Be sure to follow the updated ideas.
Do not forget to put a Stop loss for your positions (For every position you want to open).
Please follow your strategy and updates; this is just my Idea, and I will gladly see your ideas in this post.
Please do not forget the ✅' like '✅ button 🙏😊 & Share it with your friends; thanks, and Trade safe.
The Global BTC Shake out is coming before 1 million BTC in 2037I believe it worth stating that we might be in a moment where bitcoin is gonna shake everyone out and make everyone sell or at least all those who think 1 million BTC is coming soon. The great Bitcoin reset cycle will occur eventually before true mass adoption... we could very well retest $15,000 as bottom sometime next year.. if true BUY and hodl and invest consistantly for a whole decade and reap the reward of a 1 million bitcoin probably in 2037-38 and Bitcoin by then will be nearly on par with golds market cap by then or below it. And youll become among the weathiest of the wealth.
XLMUSDT, We are near buy zone areaHello everyone
According to the chart that you can see , the price is in correction wave and we think the price should come and do the end of corretion in buy zone area and after that is ready to move up , you can buy in 2 part in each of the buy zone area and after that at least 50% percent profit is near to us.
Be lucky
AA
BTCUSDT - Low Time Frame Support Level I believe that BTCUSDT is at a critical level right now, and this blue box combined with the blue line is where we could see some price reaction. However, don't expect a major move, this is a low timeframe zone that might only give us smaller, more precise opportunities.
🔹 What To Watch For:
Reaction Potential: If the price touches this blue box and blue line, there may be a short-term reaction, but don't overestimate it.
Low Timeframe Focus: Keep an eye on the lower timeframes for breakouts or rejections around these areas.
Patience Is Key: This isn't a large move zone, so we will wait for confirmation before acting.
💡 Stay Smart: Always trade with confirmation. If the price moves fast and unexpectedly, we won't chase it. Stay in control, and wait for the right signals!
📌I keep my charts clean and simple because I believe clarity leads to better decisions.
📌My approach is built on years of experience and a solid track record. I don’t claim to know it all but I’m confident in my ability to spot high-probability setups.
📌If you would like to learn how to use the heatmap, cumulative volume delta and volume footprint techniques that I use below to determine very accurate demand regions, you can send me a private message. I help anyone who wants it completely free of charge.
🔑I have a long list of my proven technique below:
🎯 ZENUSDT.P: Patience & Profitability | %230 Reaction from the Sniper Entry
🐶 DOGEUSDT.P: Next Move
🎨 RENDERUSDT.P: Opportunity of the Month
💎 ETHUSDT.P: Where to Retrace
🟢 BNBUSDT.P: Potential Surge
📊 BTC Dominance: Reaction Zone
🌊 WAVESUSDT.P: Demand Zone Potential
🟣 UNIUSDT.P: Long-Term Trade
🔵 XRPUSDT.P: Entry Zones
🔗 LINKUSDT.P: Follow The River
📈 BTCUSDT.P: Two Key Demand Zones
🟩 POLUSDT: Bullish Momentum
🌟 PENDLEUSDT.P: Where Opportunity Meets Precision
🔥 BTCUSDT.P: Liquidation of Highly Leveraged Longs
🌊 SOLUSDT.P: SOL's Dip - Your Opportunity
🐸 1000PEPEUSDT.P: Prime Bounce Zone Unlocked
🚀 ETHUSDT.P: Set to Explode - Don't Miss This Game Changer
🤖 IQUSDT: Smart Plan
⚡️ PONDUSDT: A Trade Not Taken Is Better Than a Losing One
💼 STMXUSDT: 2 Buying Areas
🐢 TURBOUSDT: Buy Zones and Buyer Presence
🌍 ICPUSDT.P: Massive Upside Potential | Check the Trade Update For Seeing Results
🟠 IDEXUSDT: Spot Buy Area | %26 Profit if You Trade with MSB
📌 USUALUSDT: Buyers Are Active + %70 Profit in Total
🌟 FORTHUSDT: Sniper Entry +%26 Reaction
🐳 QKCUSDT: Sniper Entry +%57 Reaction
📊 BTC.D: Retest of Key Area Highly Likely
📊 XNOUSDT %80 Reaction with a Simple Blue Box!
📊 BELUSDT Amazing %120 Reaction!
I stopped adding to the list because it's kinda tiring to add 5-10 charts in every move but you can check my profile and see that it goes on..
#BTC/USDT Update! This is the only Bullish trigger point!#BTC has reached our key resistance zone, the exact area I've been highlighting since last week.
So far, we've seen a clear rejection from this level.
Bitcoin still needs more momentum to break above this zone convincingly.
As long as we remain below this range, it won’t be smooth sailing for BTC or altcoins.
📊 I’ll be sharing some important altcoin charts later today.
Stay tuned!
Please hit the like button to support my content and share your views in the comment section.
Thank you
#PEACE
#BTC Ascending Triangle📊#BTC Ascending Triangle📈
🧠From a structural perspective, we have been consolidating sideways in the blue resistance area to digest the selling pressure here, so we need to be alert to the risk of further surges. The resistance to note is around 89,000-90,000.
➡️From a graphical perspective, the price is gradually being compressed to form an ascending triangle. Generally, we regard this model as a signal that the trend is about to end. We are currently in an upward trend at the 4h level, so we need to be alert to the correction after the trend ends.
⚠️Note that if we fall below the yellow turning point 86,984, the market will choose to break down, which means that the correction phase will start early.
Let's see👀
🤜If you like my analysis, please like💖 and share💬
BITGET:BTCUSDT.P
BTC's Bull Run: Profit Realized, Resistance AheadCurrently, BTC is hovering around $88,000. We had already achieved our profit target yesterday. Ever since BTC broke through the $85,000 mark, it has been rising continuously. The market is in a bullish - dominated trend, with strong buying power driving the price up steadily. Although it's in an uptrend, there's uncertainty about its future movement as it hasn't broken through the $89,000 - $90,000 resistance range. If it fails to break through this resistance zone effectively, the price may decline again eventually.
I will share trading signals every day. All the signals have been accurate for a whole month in a row. If you also need them, please click on the link below the article to obtain them.
BTC/USDT:Pay attention to the resistance zone.BTC fluctuated within the forecast and reached the profit point. However, the 88K-89K resistance area needs to be watched, and if it cannot be effectively broken this week, then it will fall
This week, the BTC trading strategy was completely correct and the account made more than 200% profit in two weeks
We share various trading signals every day with over 90% accuracy
Fans who follow us can get high rewards every day
If you want stable income,You can follow the link below this article
BTC OVERVIEW AND TRADE IDEA.BTC has break through previous high and with strong volume and now trading at 87200, expecting price to fill bearish FVG at 87700 and then drop to our next buy zone which is 85600 and target will be 92k. This buy zone is an internal liquidity as FVG and its also below sell side liquidity and important fibb levels.
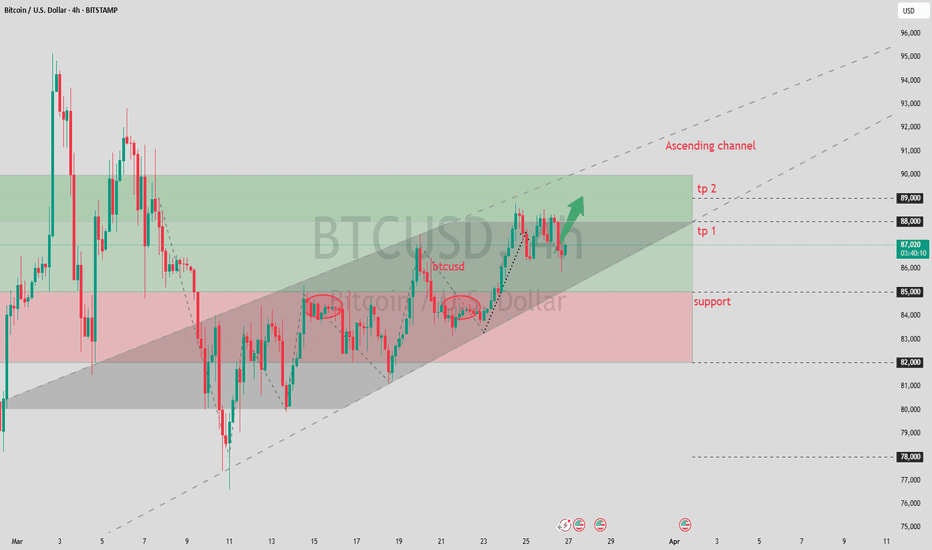
BTC Rejected at $89K, Uptrend Holds. Bullish Bets?BTC faced rejection at the $89,000 resistance level yesterday, triggering a pullback. However, the overall uptrend remains intact. Investors may consider long positions on signs of stabilization after this corrective move.
BTCUSDT
buy@84500-85500
tp:87000-88000
I will share trading signals every day. All the signals have been accurate for a whole month in a row. If you also need them, please click on the link below the article to obtain them.
BTC Today's strategyYesterday's chart already shows an upward channel for BTC, let's continue to hit the resistance area of 88K-89K
btcusdt buy@85.5K-86K
tp:88K-89K
We share various trading signals every day with over 90% accuracy
Fans who follow us can get high rewards every day
If you want stable income, you can contact me
Bitcoin (BTC/USD) Bullish Momentum: Key Levels and Trade Setupuddy'S dear friend 👋 SMC Trading Signals Update 🗾 🗺️
Technical Analysis:
Timeframe: 4-hour chart
Current Price: $88,244
Trend: Uptrend within an ascending channel
Supply Resistance Zone: $92,721 (Potential reversal area)
Fair Value Gap (FVG) Support Zone: $87,200 - $87,600
200 MA Resistance: Price is approaching the 200 Moving Average, which could act as resistance.
Key Levels:
1. Support:
FVG Zone (~$87,200 - $87,600) – Potential buy zone
Major Support: $86,649
2. Resistance:
$92,721 (Supply Zone) – Key target level
$90,000 Psychological Resistance
3. RSI Indicator:
Currently at 76.37, indicating overbought conditions.
A potential pullback could occur before further upside.
Mr SMC Trading point
Risk Management Strategy:
Long Entry: Near FVG Zone (~$87,200 - $87,600) if price retraces.
Stop Loss: Below $86,649 to limit downside risk.
Take Profit: Around $92,721 for a risk-reward trade.
Market Outlook:
Bitcoin remains bullish, but the RSI suggests a possible pullback before continuation.
A retracement into the FVG Zone may provide a better buying opportunity before the next leg up.
If price breaks below the FVG zone, the uptrend could weaken.
Pales support boost 🚀 analysis follow)
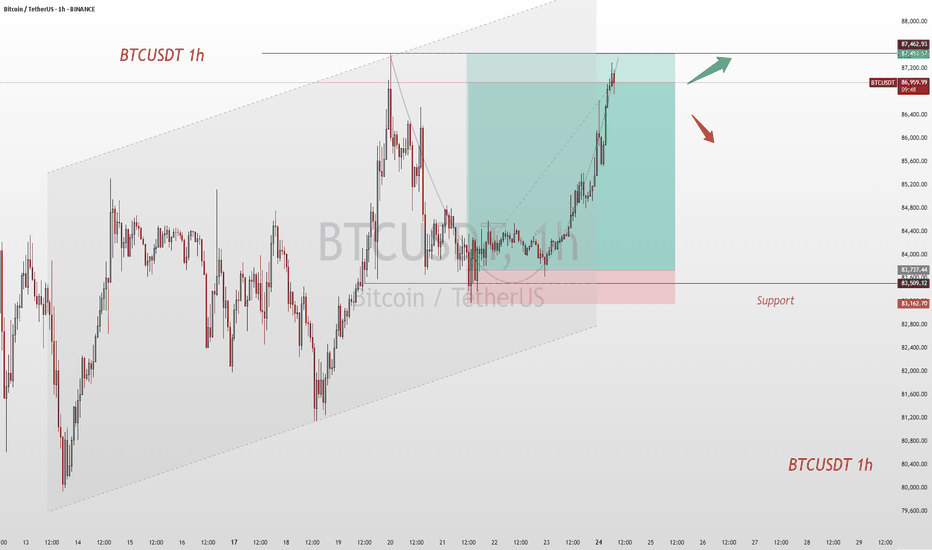
BTCUSDT: Target Achieved, What's Next for 87,500 Resistance?Upon reviewing the trading strategy devised last week, the current market price has successfully rallied to the targeted level. Bitcoin against Tether (BTCUSDT) is quoted at 86,780, registering an intraday gain of 0.84%. From the vantage points of technical analysis and market dynamics, the robust resistance level in the vicinity of 87,500 above emerges as a pivotal factor in determining whether the price can sustain its upward trajectory.
I will share trading signals every day. All the signals have been accurate for a whole month in a row. If you also need them, please click on the link below the article to obtain them.


