BTC- Can it reach 97Kish?As thing suggests the move can only be done when heavy fall is there, but as suggests lets small scalp things to our best!
BTCUSDTPERP


Bitcoin - Inverse Head & Shoulders on 4h (Neckline broken)Looking forward to a new ATH shortly IF the neckline holds.
BITSTAMP:BTCUSD
BINANCE:BTCUSD
COINBASE:BTCUSD
CRYPTOCAP:TOTAL
CRYPTOCAP:OTHERS
BINANCE:ETHUSD
COINBASE:ETHUSD
BINANCE:SOLUSD
OANDA:XAUUSD
FX_IDC:XAUUSD

Middle East Tensions Drive Capital Shift: BTC May Test 100K SupCurrently, we can clearly see that BTC is in a downward trend 🔻. Due to the tense situation in the Middle East 😰, a large amount of capital has flowed into gold and crude oil markets. BTCUSD is likely to continue its downward movement on Monday ⬇️. Let's focus on the support level at 100,000. If it breaks below 100,000, it may continue to decline ⚠️.
⚡️⚡️⚡️ BTCUSD ⚡️⚡️⚡️
🚀 Sell@ 106500 - 105500
🚀 TP 102000 - 101000
Accurate signals are updated every day 📈 If you encounter any problems during trading, these signals can serve as your reliable guide 🧭 Feel free to refer to them! I sincerely hope they'll be of great help to you 🌟 👇

BTC/USDT Bullish Reversal Zone AnalysisSupport Zone:
The horizontal purple box (~104,000 USDT area) has acted as a strong support/resistance flip zone multiple times.
Falling Wedge Breakout:
The price action broke out of a falling wedge pattern earlier, confirming bullish momentum.
Flag Formation (Current):
A smaller bullish flag/pennant appears to be forming, and a breakout above could trigger a strong upward move.
Projected Move:
The black arrow indicates a potential bounce from this support zone, with the price targeting the 111,000–112,000 USDT zone (highlighted in the top purple box).
Volume Spike:
Notable volume spike near the bottom supports the idea of accumulation and possible reversal.
📈 Conclusion:
If the support zone holds and price breaks above the minor flag, a bullish continuation is likely toward the 111,000–112,000 resistance area. Traders should watch for confirmation of a breakout and volume increase for validation.

#BTC is approaching the S/R conversion zone📊#BTC is approaching the S/R conversion zone⚠️
🧠Yesterday's long orders were swept after moving up the SL, because the support zone near 106500-107500 was broken, and the support zone turned into a resistance zone.
➡️If the price rebounds here again, it may be resisted. Therefore, we can look for some short signals to participate.
➡️If we still want to continue to rise, we can only remain optimistic after breaking through the support-resistance conversion zone and stabilizing.
🤜If you like my analysis, please like 💖 and share 💬
BITGET:BTCUSDT.P
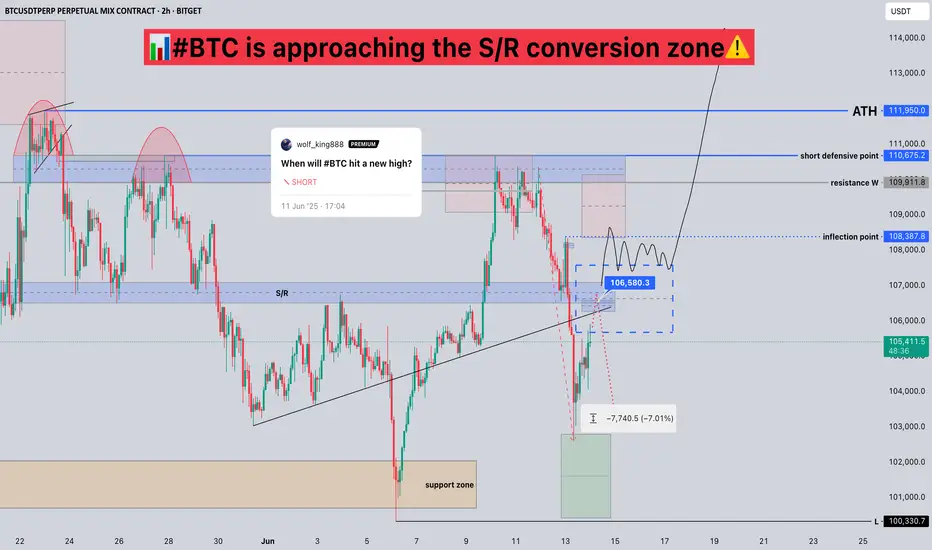

When will #BTC hit a new high?📊When will #BTC hit a new high?
🧠From a structural point of view, we have come to the weekly resistance zone, so it is very reasonable to consolidate sideways here. Only if we successfully break through the resistance here and stabilize above the resistance zone, can we remain optimistic.
➡️The short-term support is around 108800. If we can hold here, then we have the opportunity to build an ascending triangle, which means that we will continue to hit new highs soon, otherwise we need to be alert to the occurrence of a pullback.
➡️106500-107000 is the conversion area of resistance and support, and it is also the psychological defense line of long transactions. If we can't hold here, then we need to be alert to the occurrence of in-depth adjustments.
⚠️Currently in a complex consolidation stage, we need more patience!☕️
🤜If you like my analysis, please like💖 and share💬 BITGET:BTCUSDT.P


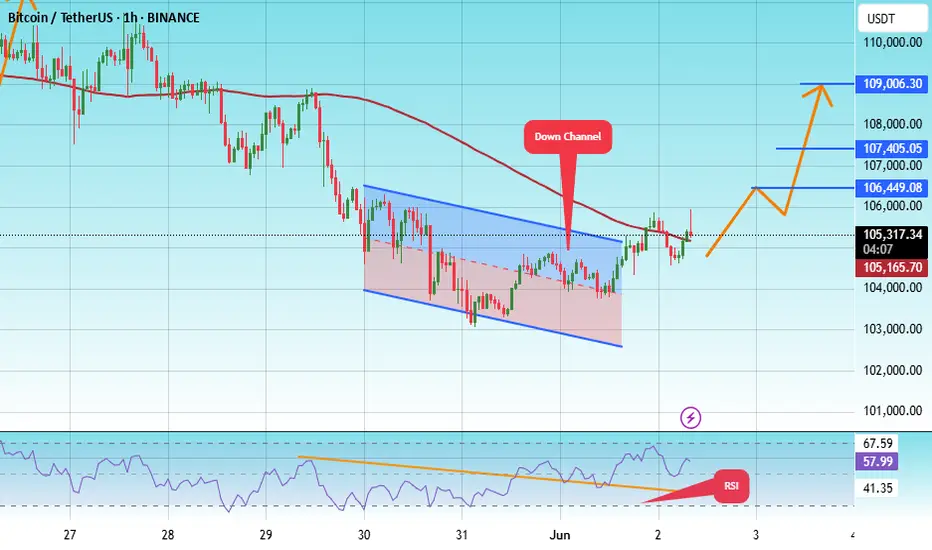
#BTC/USDT#BTC
The price is moving within a descending channel on the 1-hour frame, adhering well to it, and is heading for a strong breakout and retest.
We are experiencing a rebound from the lower boundary of the descending channel, which is support at 103141.
We are experiencing a downtrend on the RSI indicator, which is about to break and retest, supporting the upward trend.
We are looking for stability above the 100 moving average.
Entry price: 105268
First target: 106500
Second target: 107405
Third target: 109006
Shorting Opportunity EmergesBTC has seen significant volatility recently. 📊 After failing to break below 100,000 yesterday, it rebounded sharply to 108,500 immediately. ⚡ Now is precisely the opportunity to go short. 📉
⚡️⚡️⚡️ BTCUSD ⚡️⚡️⚡️
🚀 Sell@ 109000 - 108500
🚀 TP 105000 - 103000
Accurate signals are updated every day 📈 If you encounter any problems during trading, these signals can serve as your reliable guide 🧭 Feel free to refer to them! I sincerely hope they'll be of great help to you 🌟 👇

BTCUSDT: Your Next Move? The Blue Box OpportunityAlright, focusing on BTCUSDT. This blue box is a critical buying zone.
The market's recent moves demand clarity. You need to know where genuine opportunity lies, avoiding the traps that catch most traders.
I've identified this blue box as a prime area where demand could ignite. But don't just jump in. Here's the plan:
Watch the Volume Footprint: Is there real accumulation, or just noise?
Spot CDV Divergences: Hidden strength often appears here, even if price looks weak.
Confirm on LTF: A clear breakout above minor resistance, followed by a retest as support, is your green light.
Be vigilant for liquidity hunts – those quick dips that shake out weak hands before a real move. If this blue box holds, and we get these confirmations, my bias is firmly upwards.
I only focus on assets with sudden, significant volume increases. BTCUSDT's current setup, combined with this potential volume, makes it a high-interest play.
Keep a very close eye on this blue box. Understanding these subtle signals means you can navigate these intricate dynamics, securing your position for potential gains. Miss this, and you might regret it.
📌I keep my charts clean and simple because I believe clarity leads to better decisions.
📌My approach is built on years of experience and a solid track record. I don’t claim to know it all but I’m confident in my ability to spot high-probability setups.
📌If you would like to learn how to use the heatmap, cumulative volume delta and volume footprint techniques that I use to determine very accurate demand regions, you can send me a private message. I help anyone who wants it completely free of charge.
🔑 On my profile, you can find an extensive track record spanning hundreds of analyses and many examples of my strategies in action. To keep things concise here, I'm sharing just a few of my most recent successful calls as a small snapshot of my ongoing work:
📊 FLOKIUSDT - +%100 From Blue Box!
📊 TRXUSDT - I Do My Thing Again
📊 OGNUSDT | One of Today’s Highest Volume Gainers – +32.44%
📊 TIAUSDT | Still No Buyers—Maintaining a Bearish Outlook
📊 Simple Red Box, Extraordinary Results
Feel free to check out my TradingView profile for all of them; listing everything here would genuinely take too long! 😉

BTC Bears Eye 100000 Break; Short at 107000 -108000 ResistanceBTC's downward movement failed to break through 100,000📉, but there is a clear downward trend, and breaking below 100,000 is only a matter of time⏳. In the short term, shorting at high levels can be considered📉. The upward resistance currently has difficulty breaking through 110,000🚧, and shorting can now be considered in the resistance range of 107,000-108,000📉
⚡️⚡️⚡️ BTCUSD ⚡️⚡️⚡️
🚀 Sell@ 107000 - 106000
🚀 TP 102000 - 98000
Accurate signals are updated every day 📈 If you encounter any problems during trading, these signals can serve as your reliable guide 🧭 Feel free to refer to them! I sincerely hope they'll be of great help to you 🌟 👇

Is the #BTC rally over?📊 Is the #BTC rally over?
🧠From a structural perspective, we have reached the ideal target zone of the double top bearish structure, so a strong rebound is very reasonable. The realization of the ideal target zone means that the previous decline has ended. We need to change our thinking and stop being too bearish. Stay cautious!
➡️At the same time, the goals of the long structure we built in the support area have also been fully achieved, and this period of rise has reached the lower edge of the extended wedge + the downward trend line + the blue resistance area very quickly, so there is a possibility of a pullback, so don’t chase the rise here. If you want to participate in long transactions, we should pay attention to the opportunities after the pullback.
Let’s see👀
🤜If you like my analysis, please like💖 and share💬
BITGET:BTCUSDT.P

#BTC/USD Close Fight but bulls win! $117K Still in sight!CRYPTOCAP:BTC Weekly Update:
BTC closed the week up by just 0.08%, leaving behind a long wick and a tiny body, forming a Dragonfly Doji, one of the strongest candlestick patterns, signalling a fierce battle between bulls and bears.
✅ This time, the bulls won by a small margin, but a win is a win.
✅ BTC successfully held its key support.
✅ The CC is green, which is a positive sign.
The price action remains choppy, but the trend is still pushing upward from here.
Invalidation:- Weekly Close below $100k
What do you think?
Do let me know in the comments section. And please hit the like button.
Thank you
#PEACE

Bitcoin’s Reversal from Supports — Is the Correction Over? Bitcoin ( BINANCE:BTCUSDT ) moved as I expected in the previous idea , and it also reversed the decline I intended and started to rise from the Support zone($102,000-$107,120) , Support lines , and 50_SMA(Daily) .
Bitcoin is trading near the Resistance zone($104,380-$103,670) , Cumulative Short Liquidation Leverage($105,500-$105,265) , and Resistance lines .
In terms of Elliott Wave theory , it seems that Bitcoin has managed to complete the main wave Y . The main corrective structure was the Double Three Correction(WXY) . If the Resistance lines are broken , we can confirm the end of the main wave Y .
I expect Bitcoin to start rising after a re-correction from Cumulative Long Liquidations Leverage and reach the targets I have specified on the chart.
Cumulative Long Liquidation Leverage: $102,883-$102,181
Cumulative Long Liquidation Leverage: $101,318-$100,748
Note: If Bitcoin falls below $100,200(Worst Stop Loss(SL)), we should expect further declines.
Note: $105,500 is an important price for Bitcoin, and if Bitcoin can close the 4-hour candle above it, we can expect a break of the Heavy Resistance zone($104,380-$103,670)
Please respect each other's ideas and express them politely if you agree or disagree.
Bitcoin Analyze (BTCUSDT), 1-hour time frame.
Be sure to follow the updated ideas.
Do not forget to put a Stop loss for your positions (For every position you want to open).
Please follow your strategy and updates; this is just my Idea, and I will gladly see your ideas in this post.
Please do not forget the ✅' like '✅ button 🙏😊 & Share it with your friends; thanks, and Trade safe.

Bitcoin Analysis – Possible Scenarios🟠 Price is consolidating around 104,500, sitting right on the short-term ascending trendline. No clear breakout yet.
🔴 Supply Zones:
1️⃣ OB 1H:📍 107,800 – 108,600📌 Strong rejection zone that led to the current decline.
2️⃣ OB 4H:📍 106,100 – 107,500📌 Key resistance zone – a valid break above may trigger bullish continuation.
3️⃣ Upper OB 1H:📍 110,700 – 111,400📌 Higher resistance to watch in case of strong breakout.
🟢 Demand Zones:
1️⃣ FVG 1H:📍 103,900 – 104,300📌 Price is nearing this imbalance zone – bullish reaction expected if support holds.
2️⃣ Lower FVG 1H:📍 99,900 – 100,700📌 If current support fails, this is the next strong liquidity zone.
📊 Possible Scenarios:
1️⃣ Bounce from current trendline & FVG → move toward OB 4H (buy setup with confirmation)
2️⃣ Break below trendline → deeper pullback into 100K zone
3️⃣ Breakout above OB 4H → target next resistance at 108,600 and above
‼️ Wait for confirmation before jumping in – price action is at a decision point.
🔍 Insight by ProfitaminFX
If this outlook aligns with your bias, or if you see it differently, feel free to share your perspective in the comments. Let’s grow together 📈

#BTC Beware of further declines📊#BTC Beware of further declines📉
🧠From a structural perspective, we have not been able to break through and stabilize at the resistance area near 106500. And the structure of the reversal of the bullish trend has been established, so the downside risk remains.
➡️From a graphical perspective, we have formed an extended wedge between the support line and the resistance area, and the price has now fallen below the lower edge of the wedge, so we will likely see further pullbacks.
➡️If the market really develops as expected, then the support area worth paying attention to is around 100700.
⚠️Note that if we rise again and successfully break through and stabilize at the resistance near 106750, then we will see more gains.
Let's see👀
🤜If you like my analysis, please like💖 and share💬 BITGET:BTCUSDT.P

#BTC Double Top Bearish Structure, Beware of Pullback📊#BTC Double Top Bearish Structure, Beware of Pullback📉
🧠From a structural perspective, we broke below the neckline of 106510, which means that the bearish double top pattern is established, so we need to be wary of the coming of a plunge.
➡️As I said in my last analysis, we stabilized and rebounded after testing the support near H1, but I was not satisfied because my order was swept after I moved up the SL, so we cancelled the risk and also meant that we might cancel the possible future profits.
➡️However, I still succeeded because I stuck to my trading plan and tried some short trades after the price rebounded near the blue resistance line. 50% of the profit has been locked in because I am worried that the market will jump back and forth between support and resistance, and there is a gap to be filled near 109200.
⚠️If we fail to hold the support near 106500 tomorrow, then we will see a plunge.
Let's see👀
🤜If you like my analysis, please like💖 and share💬 BITGET:BTCUSDT.P

"Caught the Dip – Next Stop: Resistance Zone 1. Current Price Action:
The asset has bounced off the demand zone around 101,500 – 102,000 USDT.
It is now trading at 102,204.56 USDT, indicating early signs of the expected bullish move.
A white curved arrow suggests a rounded bottom pattern, often signaling a bullish reversal.
2. Demand Zone (Support):
Remains the same as the previous chart: 101,500 – 102,500 USDT.
Price reacted exactly at this zone and is starting to move upward.
3. Supply Zone (Target Area):
Clearly marked at 104,800 – 105,500 USDT.
This is where the expected bullish move could face resistance or where traders might look to take profit (TP).
4. Visual Reinforcement:
The large blue arrow indicates strong bullish momentum is anticipated.
The meme (Leonardo DiCaprio pointing) emphasizes that the reversal is happening as previously predicted — likely for motivational or engagement purposes in a VIP group.
---
🧠 Technical Sentiment:
Bullish Bias confirmed: Price bounced exactly from the demand zone.
Momentum Shift is underway, as indicated by the reversal pattern.
A potential "Buy Confirmation" is in play with room to ride up to the 105K resistance zone.
---
🎯 VIP Trade Setup Recap:
Parameter Value
Entry Zone 101,500 – 102,000 USDT
Current Price 102,204.56 USDT
Target (TP) 105,000 – 105,500 USDT
Stop Loss (SL) Below 101,000 USDT
Bias Bullish / Reversal
---
📌 Suggested Title:
"Reversal In Motion – Ride to 105K 🎯🚀"

#BTC Downside risk has not been lifted📊#BTC Downside risk has not been lifted⚠️
🧠Unfortunately, it is $34 away from the second target of our short strategy of 103,000.
But don't worry, the ideal target area of the short structure has not been achieved, and the downside risk has not been lifted, so we still need to look for short opportunities after the rebound.
➡️From the current structure, the aggressive pressure level is around 106,000, and the overlapping resistance area is around 106,500-107,800.
⚠️The weekend's rise is deceptive and belongs to the repair stage after the big drop. We may see a bigger drop next week!
Let's see👀
🤜If you like my analysis, please like💖 and share💬 BITGET:BTCUSDT.P

BTC - Mega Scalps to Victory! - Buy from 103.4KMega scalps means mega money hahhaha but i feel this is the ideal scenario to short first buy second or buy on the point stated!!! Although if it breaks the green box its invalidated!
