BTCUSDT/IBIT: No Recovery in Sight Yet. Don't Be Fooled.Hello everyone. As I closely examine BTCUSDT and IBIT, I have a significant observation: there are no clear signals yet that selling is slowing down. This means it's too early to speak of a recovery in the market.
As intelligent investors, we look not only at price movements but also at the market's underlying dynamics. Currently, I see no clear indication in either BTCUSDT or IBIT that selling pressure is diminishing.
In such situations, a meticulous examination of the volume footprint is essential. We analyze every detail in the volume to understand if buyers are truly stepping in, and if selling orders are being absorbed. At the same time, I am closely monitoring CDV (Cumulative Delta Volume) divergences. If selling pressure were truly decreasing, we would expect to see clues in the CDV, but as of now, such confirmation is absent.
To confidently state that the market has entered a recovery phase, we need strong and confirmed breakouts on a low timeframe (LTF). Following these breakouts, a successful retest of the broken levels as support would be a reliable signal that the market has shifted direction. However, at present, such a structure has not formed.
As you know, I only trade coins that show a sudden and significant increase in volume. This approach allows me to focus my capital where the market is truly revealing its intentions. My current observation in BTCUSDT and IBIT is that this type of volume increase is not yet signaling a recovery.
Therefore, for those anticipating a market recovery, it is crucial not to act hastily and to await concrete confirmation signals. The market rewards the patient.
📌I keep my charts clean and simple because I believe clarity leads to better decisions.
📌My approach is built on years of experience and a solid track record. I don’t claim to know it all but I’m confident in my ability to spot high-probability setups.
📌If you would like to learn how to use the heatmap, cumulative volume delta and volume footprint techniques that I use below to determine very accurate demand regions, you can send me a private message. I help anyone who wants it completely free of charge.
🔑I have a long list of my proven technique below:
🎯 ZENUSDT.P: Patience & Profitability | %230 Reaction from the Sniper Entry
🐶 DOGEUSDT.P: Next Move
🎨 RENDERUSDT.P: Opportunity of the Month
💎 ETHUSDT.P: Where to Retrace
🟢 BNBUSDT.P: Potential Surge
📊 BTC Dominance: Reaction Zone
🌊 WAVESUSDT.P: Demand Zone Potential
🟣 UNIUSDT.P: Long-Term Trade
🔵 XRPUSDT.P: Entry Zones
🔗 LINKUSDT.P: Follow The River
📈 BTCUSDT.P: Two Key Demand Zones
🟩 POLUSDT: Bullish Momentum
🌟 PENDLEUSDT.P: Where Opportunity Meets Precision
🔥 BTCUSDT.P: Liquidation of Highly Leveraged Longs
🌊 SOLUSDT.P: SOL's Dip - Your Opportunity
🐸 1000PEPEUSDT.P: Prime Bounce Zone Unlocked
🚀 ETHUSDT.P: Set to Explode - Don't Miss This Game Changer
🤖 IQUSDT: Smart Plan
⚡️ PONDUSDT: A Trade Not Taken Is Better Than a Losing One
💼 STMXUSDT: 2 Buying Areas
🐢 TURBOUSDT: Buy Zones and Buyer Presence
🌍 ICPUSDT.P: Massive Upside Potential | Check the Trade Update For Seeing Results
🟠 IDEXUSDT: Spot Buy Area | %26 Profit if You Trade with MSB
📌 USUALUSDT: Buyers Are Active + %70 Profit in Total
🌟 FORTHUSDT: Sniper Entry +%26 Reaction
🐳 QKCUSDT: Sniper Entry +%57 Reaction
📊 BTC.D: Retest of Key Area Highly Likely
📊 XNOUSDT %80 Reaction with a Simple Blue Box!
📊 BELUSDT Amazing %120 Reaction!
📊 Simple Red Box, Extraordinary Results
📊 TIAUSDT | Still No Buyers—Maintaining a Bearish Outlook
📊 OGNUSDT | One of Today’s Highest Volume Gainers – +32.44%
I stopped adding to the list because it's kinda tiring to add 5-10 charts in every move but you can check my profile and see that it goes on..
BTCUSDTPERP

BTCUSDT 4H AnalysisBTC ~ 4H Analysis
#BTC On the 4H Time frame Bitcoin is retesting this multi support level. Let's see how far this support can hold.

BTC, will it wreck down to 100k?I dont think so as of now! Expect this momentum at the earliest! where if it falls below the black line and closes in 1H it gets denied!

$BUSDT Trade Setup 1HMEXC:BUSDT Trade Setup (1H)
Entry: CMP
SL: $0.37796
TP: $0.47400 / $0.53300
Setup: Breakout above trendline with strong support at $0.37313.
Needs 1H close above $0.41 for confirmation.
DYRO, NFA

#BTC reaches the support line, be cautious about rebounding📊#BTC reaches the support line, be cautious about rebounding⚠️
🧠From a structural perspective, we tested the resistance area near 110,000 again yesterday, but failed to break through. The price has stabilized after pulling back to the uptrend support line, so we need to be alert to the risk of rebound⚠️
➡️If we still cannot break through the resistance area near 110,000 this time, we should be alert to the arrival of a plunge. After breaking the downtrend support line, I expect a deep correction phase to begin.
Let's see👀
🤜If you like my analysis, please like💖 and share💬
BITGET:BTCUSDT.P

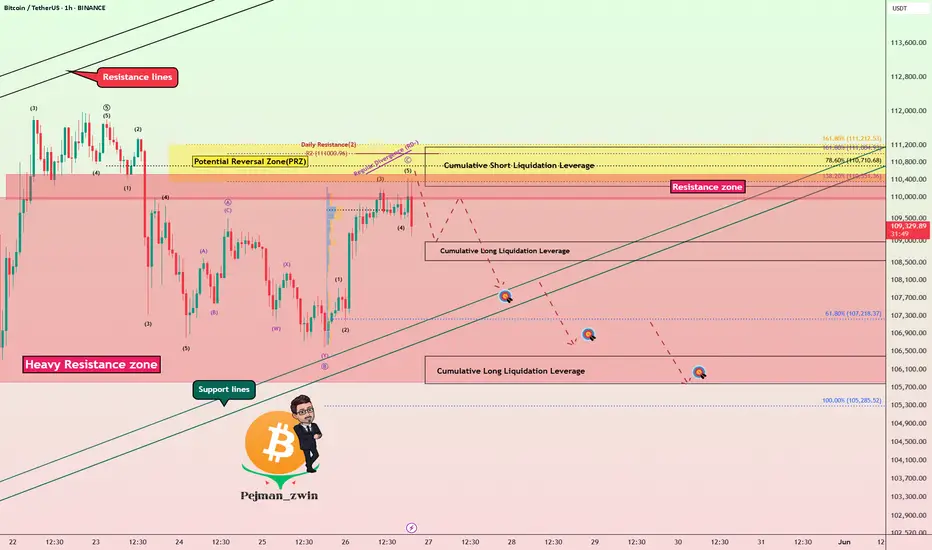
Bitcoin Bounce on Trump Tariff Delay – Short Setup Still Valid!Bitcoin ( BINANCE:BTCUSDT ) started to fall as I expected in the previous idea , and declined near the Support lines .
Bitcoin started pumping after the news that " US President Trump agreed to postpone 50% EU tariffs until July 9th ." Do you think this pumping of Bitcoin will continue?
Bitcoin is trading in a Heavy Resistance zone($110,000-$105,800) near the Potential Reversal Zone(PRZ) .
From the Elliott Wave theory perspective , Bitcoin appears to be in corrective waves , which is why I am labeling this idea as a ''Short''. The corrective waves structure is of the Expanding Flat(ABC/3-3-5) type.
I expect Bitcoin to attack the Support lines once again, and if these lines are broken, it will decline to the Targets I have indicated on the chart.
Notes :
MicroStrategy bought another 4,020 Bitcoins, but it didn't have much of an impact on the market.
If the Bitcoin price falls back below $109,000, about $185 million in long Bitcoin positions will be liquidated . = Attractive for exchanges
Bitcoin 2025 Conference to be Held in Las Vegas, Tuesday-Thursday = Could Cause Market Excitement .
Note: If Bitcoin touches $112,080, we should expect more pumping.
Please respect each other's ideas and express them politely if you agree or disagree.
Bitcoin Analyze (BTCUSDT), 1-hour time frame.
Be sure to follow the updated ideas.
Do not forget to put a Stop loss for your positions (For every position you want to open).
Please follow your strategy and updates; this is just my Idea, and I will gladly see your ideas in this post.
Please do not forget the ✅' like '✅ button 🙏😊 & Share it with your friends; thanks, and Trade safe.
Bitcoin (BTC/USDT) – Flag Breakout Points to $114KHello guys!
Bitcoin continues to respect the bullish structure within its ascending channel, and we just got a clean breakout from a textbook bull flag.
After a solid move higher earlier this month, BTC cooled off inside a tight flag pattern, consolidating above $106K. That pullback helped reset momentum, and now we’ve broken out with conviction.
You can read about it here:
We’re currently hovering around $ 109.8 K. A short-term retest of the breakout zone near $108K–$108.5K wouldn’t be surprising. it could even offer a great entry opportunity before the next leg up.
If momentum holds, the projected target from this flag pattern lands in the $113.5K–$114K zone.
watch these:
Support: $107.5K–$108.5K
Target: $114K
Invalidation: Break below $107K
Bias remains bullish unless we lose the channel structure.

#BTC failed to break through, beware of pullbacks📊#BTC failed to break through, beware of pullbacks⚠️
🧠Yesterday, I found signs of stabilization near 109500 and closed my short position and went long because I was worried that we would break through the resistance area near 110000. As a result, the market developed as expected and we successfully broke through, but unfortunately we did not stabilize above the resistance area of 110000.
➡️From a graphical point of view, we formed an extended wedge near the resistance area, and we have now fallen through this pattern, which is about $400 away from the support near 107000 that I want to focus on, so I missed this rebound space.
➡️Currently we are blocked by the downward trend line. Only if we break through here and stabilize, can we see a big surge.
⚠️Note that we have tested the support near 107000 many times. If we fall below here, we will see further pullbacks.
Let's see👀
🤜If you like my analysis, please like💖 and share💬
BITGET:BTCUSDT.P

Bullish Momentum Building, $112K Breakout on the Horizon?Hey Realistic Traders!
Can BINANCE:BTCUSDT Break Past $112K and Set a New All-Time High? Let’s Break It Down...
Trend Analysis
On the H4 timeframe, BTCUSDT has consistently traded above the EMA-90 line, confirming the continuation of a bullish trend. Within this trend, a falling wedge pattern formed, which is typically considered a bullish reversal signal. This pattern was followed by a breakout marked by a bullish Marubozu candle, further strengthening the bullish outlook.
In addition, a bullish crossover appeared on the oscillator, providing additional confirmation of upward momentum. Based on these technical signals, the price is expected to continue its upward move toward the first target at 113,613, with a potential extension to the second target at 117,968.
The outlook remains valid as long as the price stays above the key stop-loss level at 105,681.
Support the channel by engaging with the content, using the rocket button, and sharing your opinions in the comments below.
Disclaimer: "Please note that this analysis is solely for educational purposes and should not be considered a recommendation to take a long or short position on Bitcoin.

#BTC reaches the target area, beware of pullbacks📊#BTC reaches the target area, beware of pullbacks⚠️
🧠From a structural point of view, we have support near H1, and built a bullish head and shoulders structure, and broke through the downward trend line, so it is very reasonable to have such a rise.
➡️Unfortunately, the price did not reach the 105,000 support that I wanted to pay attention to, and this rise happened when I was sleeping, so I missed it.
➡️But now the price has reached the 110,000 pressure area that I am concerned about, and has reached the target area of the bullish head and shoulders structure. So I will not chase the rise in the resistance area, but I will look for some shorting opportunities.
⚠️Note that the main trend is long, so shorting is a counter-trend transaction, and we need to be cautious. Try to pay attention to the opportunity to go long on the pullback. The more aggressive support is near 108,000, and the more conservative support is near H1. It has been tested twice here. Will it be tested for the third time?
Let's see👀
🤜If you like my analysis, please like💖 and share💬
BITGET:BTCUSDT.P

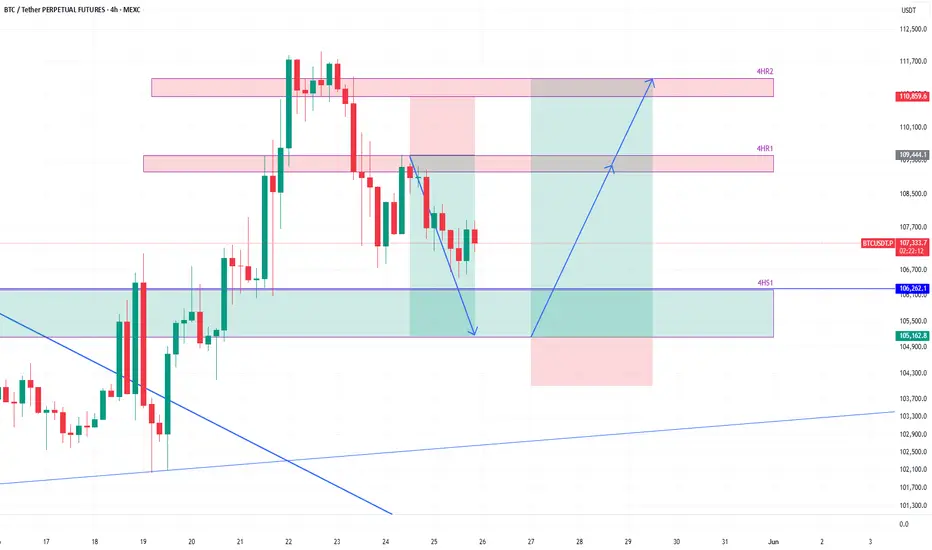
BTCUSDT to bounce from 4h supportHere is an idea for trade on BTCUSDT. The price is coming close to the 4h support zone 4HS1.
It is likely that it will find support there and bounce from there towards 4h resistance 4HR1 and possibly towards 4HR2.
We will take some profit at 4HR1 level if the price reaches there and look to refill the position on any pullback.
We will also reevaluate if the price is really heading towards 4HR2 or likely to go around 96k-97k before fueling up for upward move.
BTC/USD) Make some trand analysis Read The ChaptianSMC trading point update
Technical analysis of Bitcoin (BTC) against USDT on a 4-hour timeframe using key price action concepts. Here's a breakdown of the idea conveyed:
Key Elements in the Chart:
1. Support and Resistance Zones:
Support Level (Yellow Boxes): Indicate areas where buying interest is strong enough to prevent the price from falling further.
Resistance Level: Zones where selling interest is strong enough to halt upward price movement.
These zones have been respected multiple times and serve as potential trade entry or exit points.
2. Breakout Strategy:
The chart highlights breakout points (black circles) above resistance zones, signaling strong bullish momentum.
After breaking resistance, price typically retests the zone as new support before moving higher—this is a classic breakout and retest structure.
3. Target Projection:
The vertical lines represent measured move projections, likely using the height of the prior consolidation range to estimate the next move.
The target point is marked around $112,559.59, indicating a bullish target following the breakout.
4. 200 EMA (Exponential Moving Average):
The 200 EMA at $96,827.38 acts as dynamic support, showing the overall bullish trend is intact.
5. RSI (Relative Strength Index):
RSI values (54.97 and 52.87) suggest neither overbought nor oversold conditions, implying room for further upside.
Mr SMC Trading point
---
Conclusion:
The analysis suggests a bullish continuation setup:
BTC has broken out from a consolidation range.
Retesting previous resistance as support.
The bullish target is $112,559.59 based on the breakout projection.
The trend remains bullish as long as price stays above the support zone and 200 EMA.
Pales support boost 🚀 analysis follow)

BTCUSDT 4H Analysis BTC ~ 4H Analysis
#BTC Let's start Long/Buy back at this support block with long term target of $120K - $130K - $140K - $150K above this is just bonus for you.

Trump Tariffs Risk Triggering BTC Crash as Capital Flows to GoldOn May 23rd's U.S. session, Trump's EU/Apple tariff plans sparked market chaos:
Gold surged 💥 as a safe haven.
The euro plunged on EU tariff fears.
If tariffs persist, capital may flood into gold/forex, likely triggering a BTC crash.
⚡⚡⚡ BTCUSD ⚡⚡⚡
🚀 Sell@110000 - 109000
🚀 TP 106500 - 104500
👇Accurate signals are updated every day 📈 If you encounter any problems during trading, these signals can serve as your reliable guide 🧭 Feel free to refer to them! I sincerely hope they'll be of great help to you 👇

BTC - back to 110k?Oh yeah the movement is precedented by the OB and this is a pretty dope move one can play to outplay the others, Funding fee overheated hence the news gave them a gasm to remove the buy load!!

#BTC Rising Wedge📊#BTC Rising Wedge📉
🧠From a structural perspective, we have reached the target area of the bullish cup-with-handle structure, so we need to be vigilant about the occurrence of a pullback.
➡️From a graphical perspective, we have formed a rising wedge near the red resistance area, which is generally regarded as a bearish model.
➡️If the rising trend support line does not hold and falls directly, then we can also expect further declines to occur
⚠️Note that counter-trend trading in an uptrend must be risk-managed.
Let's see👀
🤜If you like my analysis, please like💖 and share💬
BITGET:BTCUSDT.P

#BITCOIN HISTORY IS ABOUT TO REPEAT !!#Bitcoin HISTORY IS ABOUT TO REPEAT! 🔥
The next move is obvious…
🔹 November 2023: Major breakout led to a 140% rally
🔹 October 2024: Another breakout fueled a 50% move
🔹 Now — May 2025: We are currently observing the Semmeler structure; will it break out again? 👀
New ATH loading... 🚀
CRYPTOCAP:BTC BITSTAMP:BTCUSD BINANCE:BTCUSDT

Shorting Analysis on Bitcoin - Fxdollars- {15/04/2025}Educational Analysis says that BTCUSD may give countertrend opportunities from this range, according to my technical analysis.
Broker - BITSTAMP
So, my analysis is based on a top-down approach from weekly to trend range to internal trend range.
So my analysis comprises of two structures: 1) Break of structure on weekly range and 2) External pushback to fill the remaining fair value gap
Let's see what this pair brings to the table for us in the future.
Please check the comment section to see how this turned out.
DISCLAIMER:-
This is not an entry signal. THIS IS ONLY EDUCATIONAL PURPOSE ANALYSIS.
I have no concerns with your profit and loss from this analysis.
I HAVE NO CONCERNS WITH YOUR PROFIT OR LOSS,
Happy Trading, Fx Dollars.

BTC Volatility Range Shifts Upward: Focus on Shorting The volatility range is moving upward, rising from 101,500–105,000 to 104,000–107,000 📈. It’s advisable to focus on shorting at higher levels ⏬. Currently, BTC is still in a range-bound fluctuation—just control your trade position sizes properly, and there won’t be any major issues essentially 😊!
⚡⚡⚡ BTCUSD ⚡⚡⚡
🚀 Sell@107000 - 106000
🚀 TP 104500 - 103500
👇Accurate signals are updated every day 📈 If you encounter any problems during trading, these signals can serve as your reliable guide 🧭 Feel free to refer to them! I sincerely hope they'll be of great help to you 👇

#BTC bullish structure is broken, beware of pullback!📊#BTC bullish structure is broken, beware of pullback!
🧠The target of the ascending triangle is achieved and it falls below the turning point of the bullish structure at 102561, which means that the upward trend is likely to end. The bullish structure is broken, which means that the probability of continued rise has become lower. Therefore, we can wait for a rebound before looking for short opportunities.
➡️The support near 100700 has never been tested, which is worth our attention.
Let's take a look 👀
🤜If you like my analysis, please like 💖 and share 💬
BITGET:BTCUSDT.P

#BTC/USDT#BTC
The price is moving within a descending channel on the 1-hour frame, adhering well to it, and is on its way to breaking it strongly upwards and retesting it.
We are seeing a rebound from the lower boundary of the descending channel, which is support at 104090.
We have a downtrend on the RSI indicator that is about to break and retest, supporting the upward trend.
We are looking for stability above the 100 moving average.
Entry price: 104619
First target: 105128
Second target: 106128
Third target: 107091

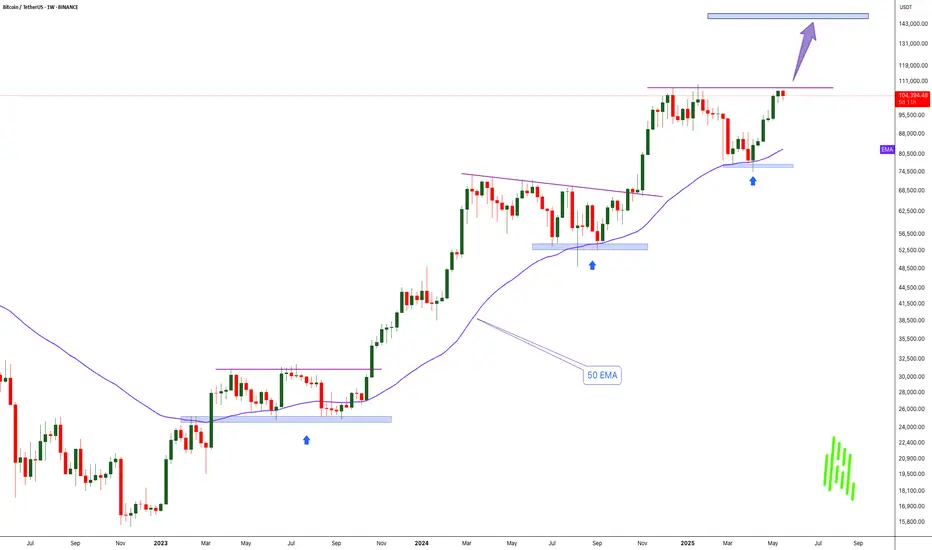
History Repeats: Bitcoin Bounces from Weekly 50 EMA-$150K Next!!MARKETSCOM:BITCOIN continues to show exceptional strength and bullish momentum. If we look back at the charts from 2023 and 2024, a clear pattern emerges — every time BINANCE:BTCUSDT touched the 50 EMA on the weekly chart, it led to a significant rally and eventually new all-time highs. That same setup seems to be unfolding again right now.
Recently, COINBASE:BTCUSD tested the 50 EMA around the $75,000 level and has since bounced strongly. The price has reclaimed the $100,000 mark and is now challenging previous all-time high resistance. Historically, after a successful bounce from this key moving average, Bitcoin hasn’t just recovered — it’s exploded to new highs.
Based on this repeating pattern, our current cycle target is set at $150,000. A clean breakout above the current resistance zone could be the catalyst that propels BYBIT:BTCUSDT Bitcoin into uncharted territory once again. The structure remains bullish, momentum is building, and the trend clearly favors the upside.
This is a classic “Buy and HODL” moment. The technicals are aligning, the market psychology is shifting, and all signs point toward a continued bull run. Buckle up — it looks like we’re in for another legendary Bitcoin rally.
Bitcoin vs Resistance Zones | Fake Breakdown Below the Channel!Bitcoin ( BINANCE:BTCUSDT ) has been moving up and down with high momentum over the past 24 hours and finally fell below the lower line of the ascending channel . Is this break of the lower line of the ascending channel valid?
Bitcoin is trading near the Resistance zone($105,100-$104,140) , Cumulative Short Liquidation Leverage($104,478-$103,941) . Since the volume of breaking of the lower line of the ascending channel is NOT high, the probability of a fake break is very high (in my opinion).
In terms of Elliott Wave theory , the structure of the main wave 4 seems to be an Expanding Flat(ABC/3-3-5) . The main wave 5 could lead to the formation of a new All-Time High(ATH ).
One of the reasons why I think we saw a Fake Break below the lower line of the ascending channel is that I think the S&P500 Index ( SP:SPX ) will trend upward , and given the high correlation between Bitcoin and S&P500 Index these days, we can expect Bitcoin to increase .
I expect Bitcoin to start rising again AFTER breaking the Resistance zone($105,100-$104,140) and touch the targets I have indicated on the chart.
Note: If Bitcoin touches $101,800, we can expect more dumps.
Please respect each other's ideas and express them politely if you agree or disagree.
Bitcoin Analyze (BTCUSDT), 1-hour time frame.
Be sure to follow the updated ideas.
Do not forget to put a Stop loss for your positions (For every position you want to open).
Please follow your strategy and updates; this is just my Idea, and I will gladly see your ideas in this post.
Please do not forget the ✅' like '✅ button 🙏😊 & Share it with your friends; thanks, and Trade safe.
