#BTC/USDT#BTC
The price is moving within a descending channel on the 1-hour frame, adhering well to it, and is heading for a strong breakout and retest.
We are experiencing a rebound from the lower boundary of the descending channel, which is support at 103200.
We are experiencing a downtrend on the RSI indicator, which is about to break and retest, supporting the upward trend.
We are looking for stability above the 100 moving average.
Entry price: 103708
First target: 104152
Second target: 104900
Third target: 105900
BTCUSDTPERP

BTC/USD 1-Hour Range Analysis: Key Levels & StrategieBTC/USD 1-Hour Chart Analysis 📊
Currently, BTC/USD is oscillating within the 101,500–105,000 range on the 1-hour chart 📈.
Key Levels
Support: 101,500 acts as short-term support 🛡️. Below that, the strong support lies at 100,600 — a breach of this key level could trigger a sharp price decline.
Resistance: 105,000 is a tough resistance level 🚧, with multiple failed upward attempts. The area above 106,000 forms a resistance zone, which bulls must overcome to initiate a significant uptrend.
Trend
The price is in a downward consolidation phase, with recent highs and lows gradually decreasing. However, chart patterns suggest a potential rebound after testing support, hinting at a possible short-term trend shift 🤔.
⚡⚡⚡ BTCUSD ⚡⚡⚡
🚀 Sell@105000 - 106000
🚀 TP 102500 - 101500
🚀 Buy@101500 - 102500
🚀 TP 105000 - 106000
Accurate signals are updated every day 📈 If you encounter any problems during trading, these signals can serve as your reliable guide 🧭 Feel free to refer to them! I sincerely hope they'll be of great help to you 🌟

BTCUSDT, We are in Up TrendHello everyone
According to the chart that you can see the price movement was moved exactly to the route the we analysed and shown weeks ago and according to this time , that analysed is valid
If you need some help you can send us messages
Good Luck
AA
(BTC/USD) Short Trade Setup: Key Resistance Rejection with Targe1. Entry Point: 104,855
This is where the trader plans to enter a short position (sell).
Price is slightly below this level at the moment (103,775).
2. Stop-Loss Zone: ~104,807
Highlighted in purple above the entry.
Indicates where the trader will exit if the market moves against them to limit losses.
3. Resistance Point: 103,086
This level has been tested multiple times and may act as a ceiling for prices.
If broken and held, it might invalidate the short setup.
4. Target Point: 93,159
This is the take-profit level for the short trade.
Represents a drop of approximately -10.76% from the entry point.
5. Trend Analysis:
The chart shows an uptrend leading into a potential distribution or topping pattern near the resistance zone.
A potential bearish move is anticipated, hence the short strategy.
6. Support Zones:
Highlighted in purple near the target area (around 93,159).
Historically strong buying areas.
Interpretation:
The trader expects the current resistance level to hold, prompting a downward correction toward the target zone at 93,159. If price moves above 104,807, the setup is invalidated, hence the stop-loss placement.

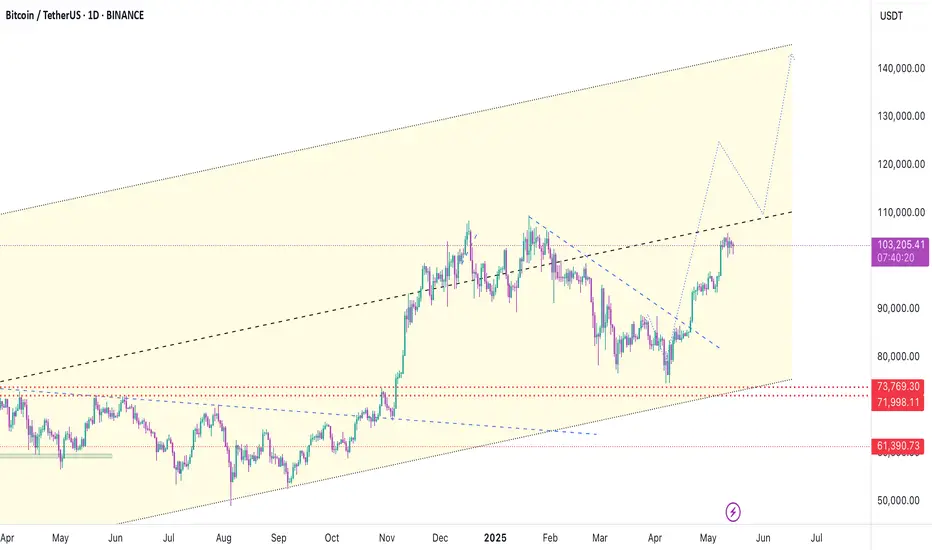
Bitcoin’s Path to ATH: Final Wave or Just a Pause? Bitcoin ( BINANCE:BTCUSDT ) pumped about +2% after the " The United States has dropped its tariffs on Chinese goods to 30%, down from a brutal 145%, while China is slashing its own duties on US imports to just 10%, temporarily, for the next 90 days. " news, but then started to decline again. Do you think Bitcoin can see the new All-Time High(ATH)?
Bitcoin is moving near the Support zone($102,200-$101,680) and Support line .
In terms of Elliott wave theory , Bitcoin appears to have completed microwave 3 of the main wave 5 and is currently completing microwave 4 of the main wave 5 .
Given the momentum of the decline a few hours ago , I expect Bitcoin to either touch the previous low or create a new low in the 1-hour timeframe .
I expect Bitcoin to attack the Support zone($102,200-$101,680) once again and possibly touch the Support line and then attack towards the Resistance zone($109,588-$105,865) with the two scenarios I outlined on the chart .
Cumulative Short Liquidation Leverage: $106,943-$105,913
Cumulative Short Liquidation Leverage: $105,313-$104,787
Cumulative Long Liquidation Leverage: $102,198-$101,697
Note: If Bitcoin can move above $104,500 without correction, we can expect more pumping.
Note: If Bitcoin falls below $101,500, we can expect more declines.
Please respect each other's ideas and express them politely if you agree or disagree.
Bitcoin Analyze (BTCUSDT), 1-hour time frame.
Be sure to follow the updated ideas.
Do not forget to put a Stop loss for your positions (For every position you want to open).
Please follow your strategy and updates; this is just my Idea, and I will gladly see your ideas in this post.
Please do not forget the ✅' like '✅ button 🙏😊 & Share it with your friends; thanks, and Trade safe.

#BTC/USDT Bullish Crossover in Play!CRYPTOCAP:BTC Update: Bitcoin is currently holding support and showing signs of strength with a bullish EMA crossover — the 50 EMA crossing above the 100 EMA, which historically signals upward momentum based on past fractals.
The lower support zone is marked in blue, in case the price dips further.
Immediate resistance remains at the GETTEX:98K level — a confirmed close above this could trigger a move toward $103K.
Stay tuned for more real-time updates.
Do hit the like button if you like it, and share your views in the comments section.
Thank you
SHARE THE IDEA ABOUT BTCUSD BEARISH PATTERNCurrent Market Overview:
Price Action: Bitcoin has rallied approximately 40% from its April lows, reaching a high near $105,525 today.
Support Levels: Key support is identified around $100,000, with additional support near $92,000.
Resistance Levels: Immediate resistance is observed around $107,000, with a potential upside target near $120,000 if bullish momentum continues.
Bearish Pattern Analysis:
While the broader trend remains bullish, certain patterns indicate possible short-term bearish movements:
Head and Shoulders Formation: Some analysts have noted a potential head and shoulders pattern forming, which could signal a reversal if confirmed.
Momentum Indicators: The Relative Strength Index (RSI) is above 70, suggesting overbought conditions that might precede a pullback.

Bitcoin at key zone - Breakout or rejection?MARKETSCOM:BITCOIN is once again at a critical resistance level. A breakout above $109K would confirm a new ATH and likely spark another leg up, but a strong rejection here might signal that the rally was a trap, echoing patterns we’ve seen in past cycles.
My Take: We’re at a make-or-break moment. Confirmation from this level will decide the next big move.
What’s your take—breakout or rejection?
Please support this idea with a LIKE👍 if you find it useful🥳
Happy Trading💰🥳🤗

#BTC reaches the red target zone📊#BTC reaches the red target zone✔️
🧠From a structural perspective, the goals of the long structure we built in the blue resistance zone have been fully achieved, so we need to be vigilant against the occurrence of a pullback, and do not chase the rise in the sell zone! We should look for short opportunities in the sell zone.
➡️The concerns in the previous post still exist, because this week is not over yet, we need to observe whether the closing price of the weekly candlestick chart can stabilize above the blue resistance zone. Only when it stabilizes above the resistance zone, the blue resistance zone will turn into a support zone. Then look for long trading opportunities in the support zone.
⚠️Note that if we set a new record high, we also need to wait patiently for a pullback to appear before participating in a new long trade.
🤜If you like my analysis, please like 💖 and share 💬 BITGET:BTCUSDT.P

BTC/USD) Resistance level pullback Read The ChaptianSMC Trading point update
Technical analysis of Bitcoin (BTCUSDT), highlighting key levels and potential price movements based on trend channels, support/resistance, and RSI. Here's the breakdown:
---
Key Elements in the Analysis:
1. Trend Channel:
BTC is trading within an ascending channel, indicating an ongoing bullish trend.
The recent price action hit the upper boundary (resistance) of the channel, suggesting potential for a pullback.
2. Resistance Zone:
105,586.06 is marked as a resistance level, where price faced rejection.
Strong reaction here suggests sellers are defending this area.
3. Support Zone:
A new support level is established around 98,000.
This zone aligns with the lower boundary of the ascending channel and previous breakout structure.
4. Target Point (Bearish Projection):
The chart projects a potential drop to the 97,367.51 level, representing a ~7.4% correction.
This move mirrors the prior leg up, applying a measured move concept.
5. RSI Indicator:
RSI is around 66–71, indicating overbought conditions.
A bearish divergence or trendline break on RSI suggests weakening momentum.
Mr SMC Trading point
---
Summary of Trading Idea:
Bias: Short-term Bearish (correction within an overall bullish trend)
Expected Move: Potential dip toward 97,367.51 support
Confirmation: Rejection at resistance, RSI divergence, and trendline break
Invalidation: A strong breakout above 105,586.06 would nullify the correction setup and favor continued bullish movement
pelas support boost 🚀 analysis follow)

Will Bitcoin Break This Resistance – Or Is It a Bull Trap?MARKETSCOM:BITCOIN is once again at a critical resistance level, and the crypto world is split.
Some believe we’re gearing up for a new all-time high (ATH), while others argue the top is already in—and this could be a classic bull trap in disguise.
The key lies in how price reacts to this zone.
• A breakout above $109K would confirm a new ATH and likely spark another leg up.
• But a strong rejection here might signal that the rally was a trap, echoing patterns we’ve seen in past cycles.
My Take: We’re at a make-or-break moment. Confirmation from this level will decide the next big move.
What’s your take—breakout or bull trap?
Please support this idea with a LIKE👍 if you find it useful🥳
Happy Trading💰🥳🤗

BTC - Upcoming bearish trendI think we are topping. Why?
The wave structure terminating the low is a 3 wave structure... or as it appears to me atleast.
For a trend to truly be a convincing reversal, we should be seeing a 5 wave structure indicating the end of the wave structure.
This is complex and the overall bullish sentiment makes me believe that we will top sooner or later.

#BITCOIN: Another drop and then Swing Bounce $125,000The current market sentiment is bearish, indicating a potential further decline towards the 65k price point. However, we anticipate a rebound towards the 125k region. As we approach the 65k threshold, we expect a substantial price increase.
To make informed investment decisions, it is crucial to observe a strong bullish trend before considering any bullish entries.
For more insights and market analysis, please like and comment.🚀❤️
Team Setupsfx_

Scenario #BTCUSDT long📉 LONG BYBIT:BTCUSDT.P from $104,353.0
🛡 Stop loss: $103,572.0
🕒 Timeframe: 1H
✅ Market overview:
➡️ The price confidently broke above $103,729 and held, confirming the uptrend.
➡️ The next target zone is $104,720–$105,090 — nearest movement objectives.
➡️ Volume increased during the impulse, indicating strong buyer presence.
➡️ A local support level formed around $103,729 — on a pullback, this zone may hold the price.
➡️ POC at $94,479 remains far below — the market has left the balance zone and is trading in an impulsive phase.
🎯 TP Targets BYBIT:BTCUSDT.P :
💎 TP1: $104,720.0
💎 TP2: $105,090.0
💎 TP3: $105,275.0
⚠️ Important: current structure BYBIT:BTCUSDT.P suggests possible correction (wedge breakdown), requiring caution or exit on key level loss.
⚠️ Despite the initial long from $104,353, a breakdown below $103,572 (stop loss) invalidates the long setup.
📢 If H1 closes below $103,572 — better to exit, scenario invalid.
🚀 Scenario BYBIT:BTCUSDT.P valid while holding above $103,729 — below that, correction likely toward lower targets!

Gold's Slide Powers BTC Past 100K: Time to Short at Highs🚀 BTC Explodes Past the 100,000 Milestone!
Today, BTC shattered the highly anticipated 100,000 mark, sending shockwaves through the crypto market. But this remarkable rally came at a steep cost—💥 many traders faced liquidations, wiping out their accounts as the price volatility reached a fever pitch.
💎 The Gold - Crypto Connection
Interestingly, as gold continues its noticeable downward slide 📉, virtual currencies are stepping in as an alternative haven. The influx of capital seeking new opportunities has fueled the upward trajectory of cryptos, firmly establishing their bullish momentum.
📈 What’s Next?
With the 100,000 resistance now decisively breached, BTC is poised to climb even higher, riding the wave of its recent triumph 🌊. But savvy traders are eyeing a strategic play: once the price hits a peak, it could be prime time to short at the highs ⏳—a move that balances the allure of profit with the inherent risks of a volatile market.
⚡⚡⚡ BTCUSD ⚡⚡⚡
🚀 Sell@101000
🚀 TP 98000 - 97000
Accurate signals are updated every day 📈 If you encounter any problems during trading, these signals can serve as your reliable guide 🧭 Feel free to refer to them! I sincerely hope they'll be of great help to you 🌟

#BTC how will it develop next?📊#BTC how will it develop next❓
🧠From a structural point of view, we are currently moving near the weekly resistance zone. We can only judge that we have successfully broken through the resistance zone when the closing price of the weekly candlestick chart is higher than the blue resistance zone, so we still need to remain vigilant before this condition is met.
➡️If we continue to break through the previous high, it means that the bullish power is still continuing, but the breakthrough is near the gray resistance zone, so wait patiently for the opportunity of a pullback before considering participating in long trades.
➡️I am not considering participating in short trades at present, because short trades are still counter-trend trades. I will only look for short trade opportunities after breaking the inflection point 93340 to establish a short structure or the price rises to the red target zone.
⚠️The Federal Reserve interest rate decision will be announced today, and we will wait patiently for the signal of market structure to appear.
Let's see👀
🤜If you like my analysis, please like💖 and share💬
BITGET:BTCUSDT.P

btcusd sell signal. Don't forget about stop-loss.
Write in the comments all your questions and instruments analysis of which you want to see.
Friends, push the like button, write a comment, and share with your mates - that would be the best THANK YOU.
P.S. I personally will open entry if the price will show it according to my strategy.
Always make your analysis before a trade

BTCUSD BULLISH SUSTAINANCE.BTCUSD Trading Signal
Market Sentiment: The market is currently experiencing a price surge following a strong rally throughout April. Bitcoin has shown positive momentum and remains in a clear ascending market structure.
Key Levels:
Resistance: $92,000 (broken)
First Target: $95,750
Final Target: $97,800
Technical Overview:
Bitcoin continues its upward movement, supported by strong volume and higher highs. Moving averages point to a strengthening market, with momentum indicators confirming an ongoing bull run. Traders may consider entering on pullbacks or confirmed breakouts above $95,750.

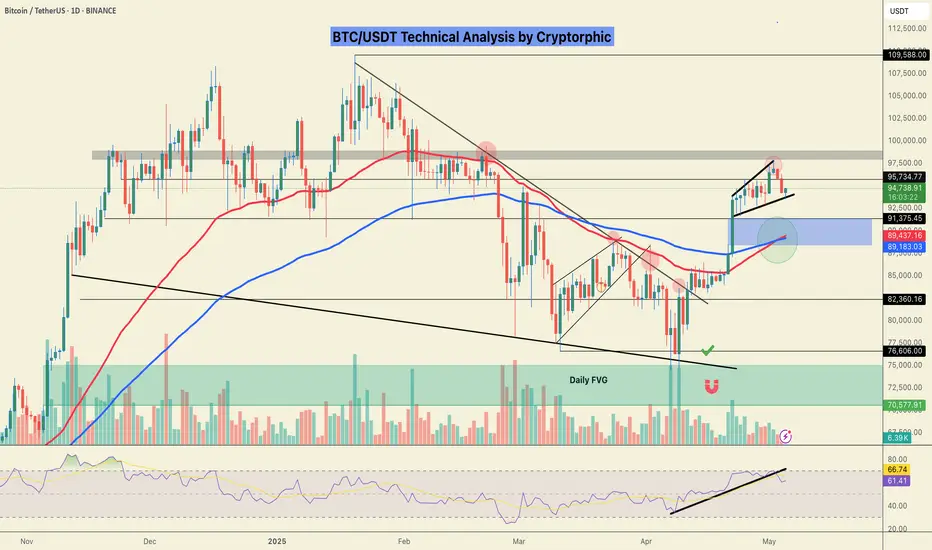
BTC/USDT Update – GigaAlgo SMC | May 6, 2025
Price action continues to respect the previous analysis — BTC remains in the premium zone, now showing clear rejection with back-to-back bearish candles. Although overall sentiment remains labeled as BULLISH, the multi-timeframe JASMINN AI and Regression tools reflect short-term downside momentum, especially below the 94K zone.
Key updates:
94K has turned into immediate resistance — failure to reclaim could signal a deeper pullback.
Support at 93K remains critical. If that fails, BTC may retrace to the equilibrium zone around 85K, consistent with earlier charts.
Watch for volume shifts — bearish volume is now increasing (25%), reflecting stronger sell-side interest.
Structure Breakdown:
BOS (Break of Structure) has been followed by a lower high, hinting at a potential shift if a lower low forms next.
Still within the overall bullish market structure, but correction looks imminent unless bulls step in above 94.5K.

BTCUSD short-term view.It is a good opportunity to sell BTCUSD in real time. Short-term is based on the right side of the swing trading, with a target of 93000-92500. In addition, the uncertainty of the news on BTCUSD. It is a good time to sell now.

BITCOIN BULLISH BTC/USDT Analysis – GigaAlgo SMC | May 5, 2025
Price has recently tapped into a premium OB zone with strong volume rejection. Although JASMINN ML flags bearish sentiment, the structure still supports bullish momentum up to 96K unless the 93K support fails. If that breakdown occurs, the next significant support lies around 83K, aligning with previous volume zones and the STATION marker.
The GigaAlgo Oscillator shows a deep red bar print, hinting at increasing bearish pressure short-term, while multi-timeframe sentiment shows a mix of red and green — signaling indecision and potential range-bound action.

Trading suggestions for BTCTwo days ago, I accurately predicted that the price of BTC would break through 97,500! 🚀
Currently, BTC is finding it difficult to break through the resistance level of 98,000 ⚠️. Given the current situation, it is recommended to decisively adopt a short-selling strategy at a high price level 📉.
⚡⚡⚡ BTCUSD ⚡⚡⚡
🚀 Sell@97500
🚀 TP 96000 - 95000 - 94000
Accurate signals are updated every day 📈 If you encounter any problems during trading, these signals can serve as your reliable guide 🧭 Feel free to refer to them! I sincerely hope they'll be of great help to you 🌟

Sell@97500, TP 96000 - 95000 - 94000🎉 Yesterday, I accurately predicted that the price of BTC would break through 97,000! 🚀 Now, a pullback is on the horizon ⬇️. Keep an eye on the support level at 93,000! 👀
⚡⚡⚡ BTCUSD ⚡⚡⚡
🚀 Sell@97500
🚀 TP 96000 - 95000 - 94000
Accurate signals are updated every day 📈 If you encounter any problems during trading, these signals can serve as your reliable guide 🧭 Feel free to refer to them! I sincerely hope they'll be of great help to you 🌟
