BTC can move slingshot? - When 87k?BTC as mentioned, have a slingshot move as mentioned above and shall come to the SVP 95,010, where can move up again
BTCUSDTPERP

Bitcoin Range-Bound in Heavy Resistance – CME Gap Still Open!Bitcoin ( BINANCE:BTCUSDT ), like Gold , has been moving in a Range for the past 5-6 days and is currently in a Heavy Resistance zone($95,950-$88,500) , as it has been in the past few days .
In terms of Elliott Wave theory , Bitcoin appears to be completing a main wave 4 . The main wave 4 structure can take two forms: Double Three Correction(WXY)_Expanding Flat(3-3-5) .
I label this analysis " Short " for the following reasons:
Due to Bitcoin's higher correlation with the S&P 500 Index ( SP:SPX ) these days, I am short on the S&P 500 Index.
China’s president Xi Jinping says Trump lied about them having a phone call ; it is NOT good news for the S&P 500 Index and Bitcoin .
CME Gap($92,525-$91,415) has NOT filled yet, and I think Bitcoin will NOT start the next bullish rally before filling the CME Gap.
I expect Bitcoin to drop to at least $92,830 and then decline to the Support zone($92,000-$91,400) if the Support lines are broken.
Cumulative Short Liquidation Leverage: $96,741-$95,520
Note: If Bitcoin can touch $97,000, we should expect more pumping.
Note: If Bitcoin goes below the 100_SMA(Daily), we should expect a fall.
Please respect each other's ideas and express them politely if you agree or disagree.
Bitcoin Analyze (BTCUSDT), 1-hour time frame.
Be sure to follow the updated ideas.
Do not forget to put a Stop loss for your positions (For every position you want to open).
Please follow your strategy and updates; this is just my Idea, and I will gladly see your ideas in this post.
Please do not forget the ✅' like '✅ button 🙏😊 & Share it with your friends; thanks, and Trade safe.

The decisive day of major data (BTCUSD)Yesterday, it was mentioned that the expectation of continuing to buy after a retracement of 96k was completely correct. Followers also made good profits.
BTCUSD bulls are still strong. The retracement is mainly long trading, which needs to be paid attention to at present. 96k/95k are both good buying opportunities.
TP98K-100K

#BTC/USDT Update. Bitcoin is currently trading around a key resistance zone.
The immediate support lies near $95,554, while a confirmed breakout above $97,300 could trigger an uptrend toward $104,000.
Until then, trade with caution.
DYOR. NFA.

Can BTCUSD continue to be purchased? The answer is definitely.Can BTCUSD continue to be purchased? The answer is definitely.
The current trend is a rebound trend after a volatile decline. The space for a short-term increase of 1,500 points is very simple. The target position is 94,700-95,200. Friends who like to do short-term swing trading can follow.

#BTC Ascending Triangle📊#BTC Ascending Triangle📈
🧠From a structural perspective, we are currently in an overlapping resistance zone. We failed to fall further yesterday to build a short structure, but continued to digest the selling pressure here in a sideways consolidation manner. Today, we attacked the heavy resistance area near 95,000 again. Only by breaking through this area can we start the surge mode.
➡️From the perspective of wave theory, there is another opportunity to form a bullish wolf wave here, which also represents a signal that the trend is about to end.
➡️From a morphological perspective, an ascending triangle has formed here, and it has now broken upward. We can expect more gains to appear.
Let's see👀
🤜If you like my analysis, please like💖 and share💬
BITGET:BTCUSDT.P

Bitcoin Repeating 2022 Structure? Same Setup, Same Outcome?Bitcoin’s current market structure is starting to mirror its 2022 setup—right before the big drop.
This chart shows a familiar pattern: a rally, a peak, first drop from the ATH, a bull trap… then the major second leg down.
If history repeats, CRYPTOCAP:BTC could be on the verge of another significant move.
Will it break the cycle this time—or follow the same path again?
📉 What do you think?
Share your take in the comments below.
Please support this idea with a LIKE👍 if you find it useful🥳
Happy Trading💰🥳🤗

BTCUSDT 1W UpdateYes, history is likely to repeat itself, making it possible for Bitcoin to reach a new all-time high in the range of $130K to $150K this year.
Are you ready?

Bitcoin's 215-Day Pattern: Another Breakout Loading?The Bitcoin chart shows a repeating pattern of consolidation lasting 215 days before each major upward breakout. This cycle has occurred multiple times over the past two years, with each accumulation zone followed by a strong bullish rally.
Currently, Bitcoin is once again emerging from a similar 215-day consolidation phase, suggesting the potential for another significant move to the upside if the pattern holds. If history repeats, we could see a target around $150K.
BINANCE:BTCUSDT CRYPTOCAP:BTC

BTC Correction Likely Before ATHBTCUSDT technical analysis update
BTC price could drop to the GETTEX:89K –$91K range before moving higher. There's a CME futures gap at $90.7K, which may act like a magnet. BTC has strong support around $90K and may see a small pullback before reaching a new all-time high.

Can #BTC break through the heavy resistance zone?📊Can #BTC break through the heavy resistance zone?
🧠From a structural perspective, we are currently in an overlapping resistance zone. We are currently testing the upper edge of the heavy resistance zone again. If we cannot successfully break through, we should be wary of further pullbacks. If we fall below the low near 92,800 and establish a short structure, then we will look for short opportunities after the rebound.
➡️If we continue to break through the previous high, it means that the bullish power is still continuing. Be patient and wait for the pullback opportunity after breaking through the high to appear before looking for entry opportunities.
➡️My short position was reduced by 80% after reaching TP2, and the stop loss was moved down, so the long position hit the breakeven point and was closed. If you don’t move the SL down, you can try to use a small position to expect a scenario where you can’t break through.
Let’s see 👀
🤜If you like my analysis, please like 💖 and share 💬 BITGET:BTCUSDT.P

#BTC Complex consolidation phase📊#BTC Complex consolidation phase📊
🧠Currently in the resistance zone, but the trend direction is bullish. We are doing narrow fluctuations in the range of 91800-95000. There are some contradictions between the long and short positions here. If we want to participate in new transactions, we must wait until the absolute support and resistance levels.
➡️If it falls below the first support zone near 91800, then we need to pay attention to the second support zone of 88000-89000
➡️We need to wait for the structure to become clearer before looking for new trading opportunities.
🤜If you like my analysis, please like💖 and share💬 BITGET:BTCUSDT.P

#BTC #BTCUSD #BTCUSDT #BITCOIN #Wyckoff #Analysis #Eddy#BTC #BTCUSD #BTCUSDT #BITCOIN #Wyckoff #Analysis #Eddy
This analysis is based on the analytical style of the Wyckoff Distribution Structure of Schematics 1 and 2.
I have outlined for you the important parts of the Wyckoff style on the one-hour timeframe.
Currently, we are in Phase C of the Wyckoff Distribution Structure.
We have to wait for the completion of this phase and the start of Phase D of the Wyckoff Distribution Structure.
When will this structure be fully confirmed? When the Bitcoin price falls to the 91800 support and gathers the final spring when this support is broken for the fall, we will enter a short position by getting the necessary confirmations based on our style and strategy.
💬 Note: It is not exactly clear whether the market maker will act based on Schematic 1 or 2, so the best entry point for short positions will be the 91800 support break. If, based on the schematic 1, the Bitcoin price UTAD and test formed, high-risk traders who are willing to trade in the opposite direction can enter a short position by getting confirmation in the time frames below 15 minutes.
Where will the targets be? The first target is 62000 and the second target can be 46000 dollars.
When can you safely close the position and enter a reverse trade, that is, long or buy? When a Wyckoff accumulation structure is formed at one of the targets.
The responsibility for the trade is yours and I have no responsibility for your failure to comply with the risk and capital management.
Good luck and be profitable.
I also invite you to review and view my latest analysis on Bitcoin via the link below:
For altcoins, follow my analysis on the Total 3 chart.
My analysis of the Total 3 chart:

#BTC #BTCUSD #BTCUSDT #BITCOIN #Update #Analysis #Eddy#BTC #BTCUSD #BTCUSDT #BITCOIN #Update #Analysis #Eddy
I have identified the important support and resistance areas of the weekly timeframe for you.
I have identified the important resistance prices for the start of the decline with the red line and the important support prices for the start of the growth with the green line.
This analysis is based on a combination of different styles, including the volume style with the ict style.
Based on your strategy and style, get the necessary confirmations for this analysis to enter the trade.
Don't forget about risk and capital management.
The responsibility for the transaction is yours and I have no responsibility for your failure to comply with your risk and capital management.
💬 Note: An important analysis will be presented on the lower timeframe on Bitcoin soon, which, based on the chart and explanations sent in that analysis, you can hunt for Bitcoin's decline by getting confirmation, pay attention to the current chart and consider important liquidity, including the Decision and Extreme areas.
Be successful and profitable.
For altcoins, proceed according to my analysis on the Total 3 chart.
My analysis of the Total 3 chart:
You can also view and review my previous analyses on my TradingView page.
Please don't forget to like and follow, your support encourages me to continue on my path and provide more analysis and updates.

Accumulation Underway: Bitcoin’s Next Move Could Be ViolentBitcoin has shown a strong recovery after reclaiming the 50 EMA, which had been a major dynamic resistance across multiple levels. After accumulating between $83,000–$87,000, BTC broke out sharply and is now consolidating again just below a major resistance zone at $95,000–$97,000.
The current price action shows another accumulation phase just under resistance — similar to the previous pattern before the breakout.
A clean breakout above this resistance zone could explode Bitcoin toward $100,000+.
On the downside, if rejection occurs, the 50 EMA around $87,000 could act as strong support once again.

#Bitcoin update , 100K or 88k?#Bitcoin has moved exactly as we anticipated over the past 36 hours.
The real test comes: BTC must break above $95,700 to target the $100K milestone.
This level also marks a major distribution zone on the lower timeframes, making it a tough but not impossible barrier to overcome.
⚡ If BTC gets rejected here, expect a potential revisit to sub-$90K levels.
I’ll keep updating this chart as the price action unfolds.
If you found this helpful, bookmark this post and smash the like button to stay in the loop!
Thank you
#PEACE

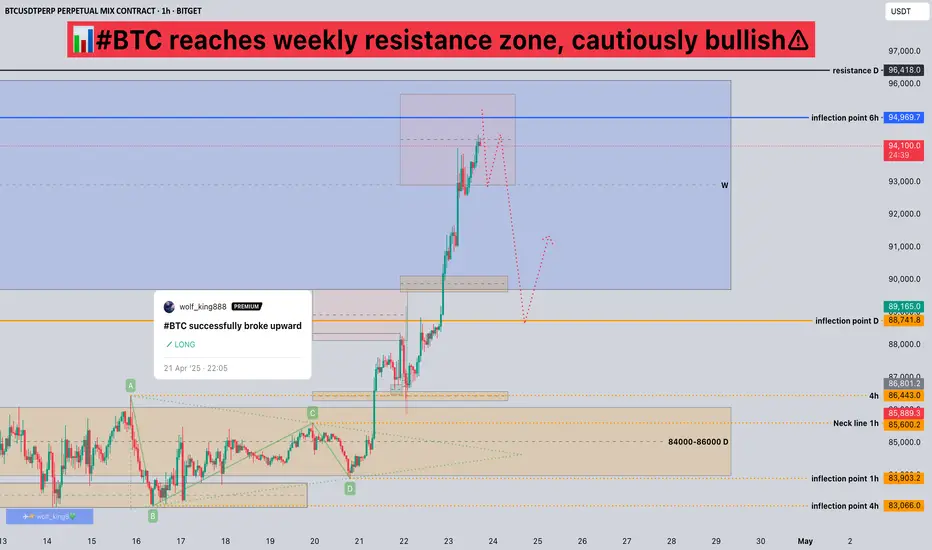
#BTC reaches weekly resistance zone, cautiously bullish📊#BTC reaches weekly resistance zone, cautiously bullish⚠️
🧠From a structural point of view, after we broke through the resistance zone at the daily level, the resistance zone turned into a support zone, so after the price fell back to this support zone, I participated in some long trades. The interim target is around 90,000, so I chose to close all positions after reaching here.
➡️In general, my mind is still in the shock trading, so I don’t look forward to the goal too far. Because we haven’t built a long structure at the daily level, we still need to be vigilant.
➡️Currently we have reached the resistance zone at the weekly level, don’t chase the rise here. We can look for some short signals in this area to participate.
⚠️Note that the large level belongs to the long trend, the correction at the daily level is over, and it is possible to start the upward trend at the daily level. Try to focus on long trades.
Let’s take a look👀
🤜If you like my analysis, please like💖 and share💬
BITGET:BTCUSDT.P
BTCUSDT 1W AnalysisBTC ~ 1W Analysis
#BTC It is necessary to wait until this pattern is successfully broken to confirm a sustained bullish trend.

Market Analysis: #BTCUSDT💰 On the BYBIT:BTCUSDT.P chart, a clear symmetrical triangle pattern has formed and already broken down, leading to a confirmed bearish impulse. Price has now returned below the POC level at $93,370.4 (Point of Control by volume), indicating weakness from buyers.
📊 Key Levels
🔴 POC BYBIT:BTCUSDT.P $93,370.4
— This is the highest volume area, now acting as strong resistance. As long as price remains below, short bias is favored.
🔵 Support BYBIT:BTCUSDT.P $91,905.5
— A short-term target if the bearish momentum continues.
🎯 Lower Target Zone
— Indicates the full depth of the breakdown move, aiming at the $90,800–$91,000 range.
📈 Volume
➡️ Volume increased during the breakdown, then dropped as price revisited the $93,000 zone — this signals a weak retest and seller control.
📍 Important Notes
➡️ Currently, BYBIT:BTCUSDT.P is trading between two key zones — the POC above and the $91,900 support below.
➡️ Failure to break and hold above $93,370 keeps the bearish scenario in play.
➡️ A move below $92,600 will confirm continuation of the downtrend.
📢 Strategy Recommendations:
🚨 SHORT Scenario BYBIT:BTCUSDT.P
Entry: on a retest of $93,000–$93,200 and rejection
Stop Loss: above POC ($93,450)
Targets: $92,100 → $91,900 → $90,800
🚨 Alternative LONG Scenario BYBIT:BTCUSDT.P (only if POC is broken):
Entry: after a solid breakout and hold above $93,400 with volume
Target: $94,200–$94,800
Stop Loss: below $93,000
🚨 Conclusion :
BYBIT:BTCUSDT.P has completed the triangle pattern and is now in a retest phase. So far, signs still point to bearish continuation, with final confirmation coming from a break below $92,600.

#BTC is stuck but Here's the simplified Plan!Bitcoin is currently trading between key levels:
Upper resistance: 93700
Lower support: 91670
We are stuck in this range, and a breakout above or below these levels will confirm the next move in the trend.
Right now, Bitcoin is holding the 50 EMA on the 30-minute chart. As long as this support holds, we could see a move towards 95k, after which we will reassess the chart.
Here are two possible scenarios if we hit 95,700 again:
We break above and target 100k
We face rejection and correct back to 88k. While this wouldn’t be a large correction, it could offer a very opportunistic entry point.
I’ll be sharing more insights and updates as the chart unfolds.
Follow me on all my socials (link in bio).
Drop your thoughts in the comment section and hit the like button if this is useful.
Thank you
#PEACE

MY POV ON BTCMy point of view on BTC is simple, as we are in important supply zone, if we cross it then its a manipulation and dump will also be big, if we stay in then its mean stability in the market and alts will pump, if rejects from that supply zone then its mean when it comes time for alts to pump and BTC starts going down so alts will suffer.

Bitcoin bull run ends in 6 months?The above chart presents a macro view of Bitcoin’s monthly price action, showcasing the historical pattern of bull and bear market cycles. Each green box highlights a bull run lasting approximately 35 months (or 1,066 days), a consistent duration seen in the previous two cycles from 2015–2018 and 2019–2022. The current cycle, which began in late 2022 or early 2023, is now entering its final phase, suggesting that if the pattern holds, the BTC bull run may have around 5–6 months remaining before a potential peak.
The price action continues to mirror previous cycles, indicating that history may once again be repeating itself. If this cyclical behavior continues, traders and investors should consider the possibility of a cycle top approaching and plan accordingly,.

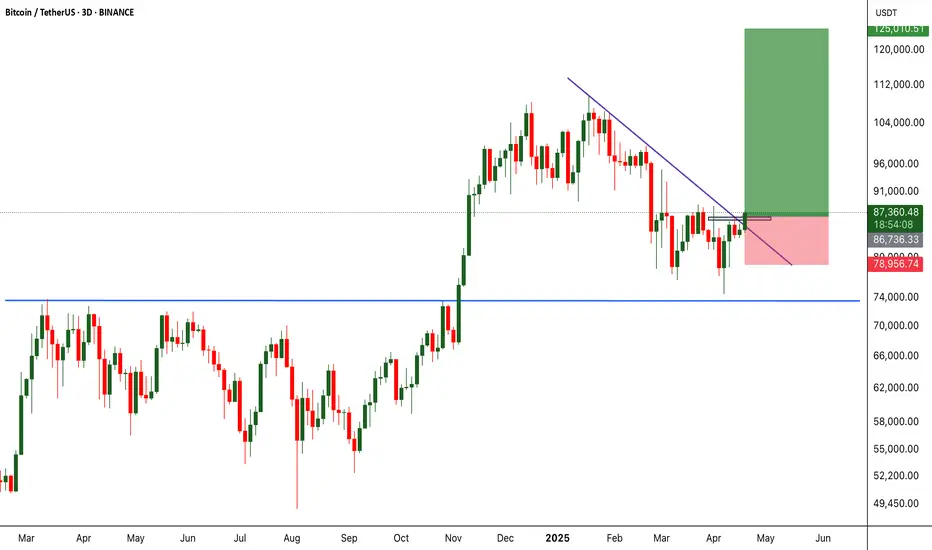
Bitcoin Will Soon Follow GOLD!!!Bitcoin has just hit the $87,000 mark, breaking out of a classical bullish continuation pattern. This breakout is significant and indicates strong bullish momentum that could lead to further upside. If this momentum continues, Bitcoin has the potential to not only reclaim its previous all-time high but also push beyond into price discovery mode.
Interestingly, this move comes right after Gold printed a new all-time high. Historically, Gold has often led major macro cycles, with Bitcoin following closely behind. This pattern seems to be playing out once again. As investors rotate capital and seek safe havens or inflation hedges, Bitcoin stands to benefit as the digital equivalent of Gold. If history repeats, Bitcoin could be on the verge of its next major rally.
From a technical standpoint, the breakout is supported by increasing volume and bullish momentum indicators such as RSI and MACD. The key support now lies around the $85K– GETTEX:87K zone, which previously acted as resistance. If price holds above this level, the next targets to watch are $90K and the psychological $100K mark.
That said, proper risk management is crucial. The market is moving fast, and while the setup is bullish, it’s important to have a well-defined stop-loss strategy in place. Avoid chasing price—wait for clean retests or consolidations if you missed the initial breakout. Momentum may be in the bulls’ favor, but discipline keeps you in the game.
Bitcoin has made its move. Gold has shown the way. If the historical correlation holds true, Bitcoin may be just getting started. Stay focused and manage your risk wisely.