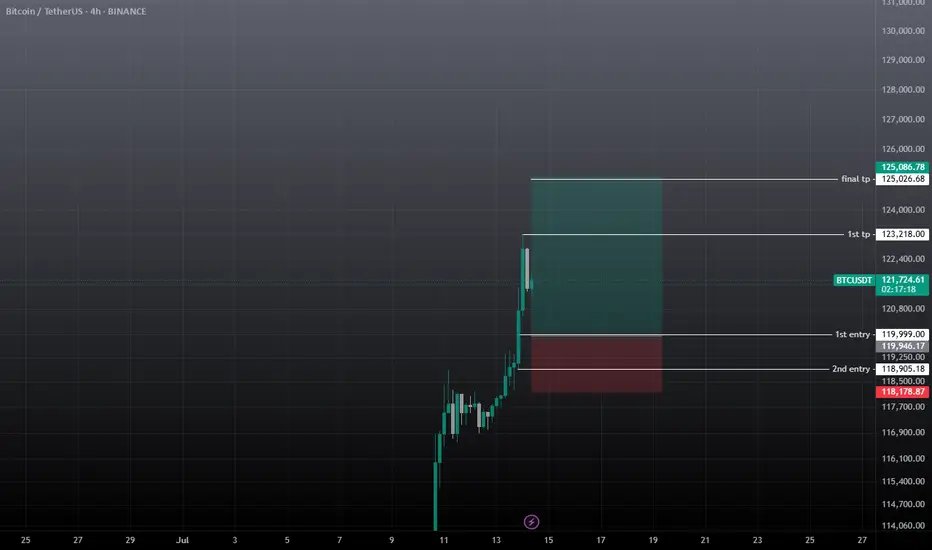
btcusdt buy / long scalp setupWait for the entry and must use sl on all trades, if tp achieves first then ignore it.
Btcusdtperpetual
btcusdt - short i thinq time to short?
Push like if you think this is a useful idea!
Before to trade my ideas make your own analysis.
Write your comments and questions here!
Thanks for your support!

Bitcoin at key zone - Breakout or rejection?MARKETSCOM:BITCOIN is once again at a critical resistance level. A breakout above $109K would confirm a new ATH and likely spark another leg up, but a strong rejection here might signal that the rally was a trap, echoing patterns we’ve seen in past cycles.
My Take: We’re at a make-or-break moment. Confirmation from this level will decide the next big move.
What’s your take—breakout or rejection?
Please support this idea with a LIKE👍 if you find it useful🥳
Happy Trading💰🥳🤗

BTCUSDT to head towards 106kBTCUSDT is currently trading inside weekly resistance zone WR1 and currently holding inside this zone. However, since it has not been rejected outrightly from there showing the strength and a high probability of it breaking this resistance and moving to the upside towards 106k area. Later we can see pullback from there towards WR1+DS1 zone testing as support and then bounce again from there towards clear sky as depicted on the chart. This structure will also create a giant inverse head and shoulder fueling the upward move later on. However, those we will assess later after more price action is there. But for now, lets focus on this long trade from weekly resistance zone WR1 to 106k.

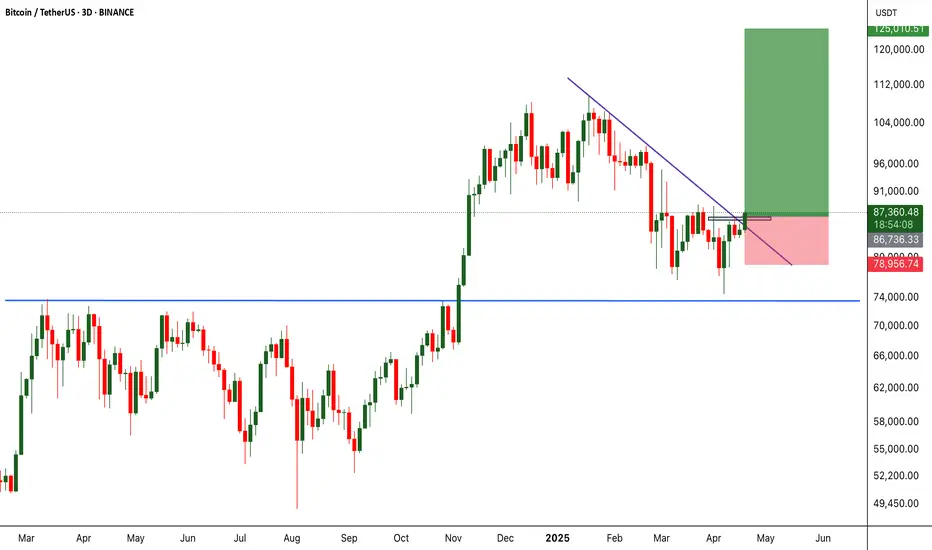
#BTCUSDT: From $74,000 to $88,000 Moving Well! More Growth CominIt’s been on a steady climb from $74,000 to $88,000. We’re expecting even more growth in the coming weeks. The price has finally broken free from its consolidation phase and is now on the rise. We think it’ll reach $94,000, then $100,000, and maybe even go up to $120,000 by the end of the year.
What do you think? Let me know in the comments below!
Thanks!
Team Setupsfx_

Bitcoin Will Soon Follow GOLD!!!Bitcoin has just hit the $87,000 mark, breaking out of a classical bullish continuation pattern. This breakout is significant and indicates strong bullish momentum that could lead to further upside. If this momentum continues, Bitcoin has the potential to not only reclaim its previous all-time high but also push beyond into price discovery mode.
Interestingly, this move comes right after Gold printed a new all-time high. Historically, Gold has often led major macro cycles, with Bitcoin following closely behind. This pattern seems to be playing out once again. As investors rotate capital and seek safe havens or inflation hedges, Bitcoin stands to benefit as the digital equivalent of Gold. If history repeats, Bitcoin could be on the verge of its next major rally.
From a technical standpoint, the breakout is supported by increasing volume and bullish momentum indicators such as RSI and MACD. The key support now lies around the $85K– GETTEX:87K zone, which previously acted as resistance. If price holds above this level, the next targets to watch are $90K and the psychological $100K mark.
That said, proper risk management is crucial. The market is moving fast, and while the setup is bullish, it’s important to have a well-defined stop-loss strategy in place. Avoid chasing price—wait for clean retests or consolidations if you missed the initial breakout. Momentum may be in the bulls’ favor, but discipline keeps you in the game.
Bitcoin has made its move. Gold has shown the way. If the historical correlation holds true, Bitcoin may be just getting started. Stay focused and manage your risk wisely.
BTCUSD hourly trend analysis for April 09, 2025BTCUSD made a double bottom formation. Any upward move will test the resistance at 80,047 and there is a strong support at 73,481. The Timing indicator is bullish from April 10th onwards. Trade with stop loss.

BTCUSD Trading StrategyBTCUSD has experienced a significant decline. While the indicators have yet to show signs of stabilization or a trend reversal, the price action on the candlestick chart indicates that there is support in the range of 82,000-80,000. Therefore, I believe it is an opportune moment to position for a long trade within this range, exercising patience as we await a price rebound to achieve the TP1/TP2 targets.

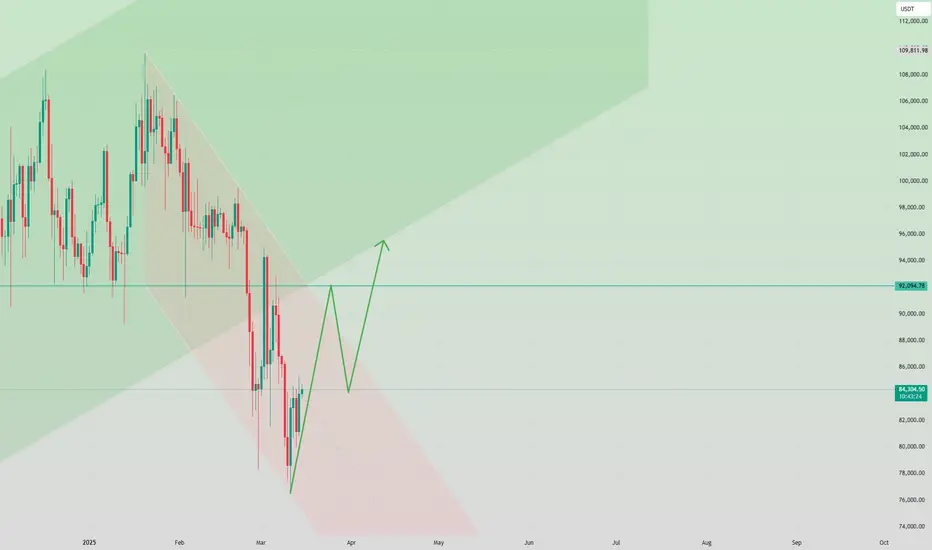
Bullish medium termBINANCE:BTCUSDT.P may go 95K range again after a correction to 78K
DISCLAIMER: This is not a trading advice. Do your own research.

BTC/USD hourly trend using Market Timing AnalysisAccording to the analysis, the BTC/USD looks bearish. Trade with the stop loss.

BTC: Daily AnalysisThe chart shows a bullish reversal pattern, likely an inverse head and shoulders or a bullish triangle breakout.
The price has broken out of the triangle formation, indicating a potential continuation of the uptrend.
The setup suggests a bullish outlook with a well-defined entry, stop loss, and take-profit levels.
If the price holds above the entry level and breaks resistance, the next targets could be achieved.
If BTC drops below the stop loss, the trade would be invalidated, signaling a potential downtrend or retest of lower support.
Trading Plan:
BUY@83,710 USDT
SL: Placed around 83,256 USDT to manage risk.
Targets:
1st Target: ~84,500 USDT
2nd Target: ~85,500 USDT
I always firmly believe that profit is the sole criterion for measuring strength. I will share accurate trading signals every day. Follow my lead and wealth will surely come rolling in. Click on my profile for your guide.

Analysis of the Recent Price Trend of BitcoinRecently, the price of Bitcoin has been fluctuating wildly, and the market is in a fierce battle between bulls and bears. Currently, the price of Bitcoin is fluctuating around $85,000, showing a convergent triangle pattern, which indicates that significant fluctuations may occur in the short term.
In terms of capital flow, the main funds are quite active. Although there are large market - price sell orders suppressing the price, the buying signals are also very obvious, and the bullish power is gradually increasing. If Bitcoin can break through the $86,000 mark, it may trigger a more substantial increase. Moreover, since the rebound from the low point, Bitcoin has been stable above $84,000, providing certain support for the upward trend.
From a macro perspective, global liquidity is closely related to the price of Bitcoin. It is expected that major central banks will continue to cut interest rates in the next two years, and the M2 money supply is likely to expand, which is good news for Bitcoin. Since February 2024, the global M2 has been rising continuously, laying a solid foundation for risky assets such as Bitcoin. In addition, if the U.S. fiscal policy, the change of the U.S. dollar, and the adjustment of the money supply develop in a favorable direction, it will also boost the demand for Bitcoin.
However, the market is not without risks. Retail investors need to be vigilant against the backlash of selling. At the same time, there is still selling pressure in the range above $96,500. Overall, in the next half - month, if the bulls can continue to exert force with the help of capital and macro - level positive factors, Bitcoin is expected to hit higher prices.
BTC Trading Strategy:
BTCUSDT sell@87K-89K
tp:83K-81K
I firmly believe realized profit and a high win - rate are the best measures of trading skill. Daily, I share highly precise trading signals. These include clear entry points, stop - loss levels for risk control, and profit - taking targets from in - depth analysis. Follow me for big financial market returns. Click my profile for a trading guide on trends, strategies, and risk management.
BTC 1h updateWe've entered a balance phase with a short position on the 1-hour chart. Earlier, at 13:05 UTC+7, there was an upthrust on the 1-hour chart, followed by an upthrust and test on the 5-minute chart. Stay tuned for more updates!

BTC 1h updateWe've broken out of balance and are now leaning more towards short positions. A HAMMER signal appeared on the 1D chart, which could suggest a potential reversal. In my view, a strong sell zone would be around 104,730 for now, but it's important to wait for supporting signals. Stay tuned for updates! 🚨📉

BTC 1h updateAt 9 AM on December 13, the market established a balance. I'm anticipating the price to approach the resistance level at 100,480. At this point, we might experience either a false breakout or a genuine breakout. If a reliable upthrust occurs, it could present a favorable entry opportunity on the 5-minute chart. It's important to note that a spring pattern formed at the support level at 9 AM. Additionally, selling volume has been slightly lower than buying volume, and the approach to resistance has shown moderate strength. Let's remain patient and observe how the situation unfolds.

BTC 1h updateSince 9 PM on December 11, the 1-hour chart shows an uptrend, with support levels forming at 99,587 and 100,309. A double-bar spring appears to be developing at the 100,309 support, with the first bar showing a notable volume spike and the second bar still forming. If this spring completes and confirms, the price could rise toward the next resistance level. After the spring, the 5-minute chart may offer a good entry point for a long position.

$BTCUSDT Bouncing from Demand Zone – Eyes on $75KBINANCE:BTCUSDT Bouncing from Demand Zone – Eyes on $75K with Strong ETF Inflows!!
After a significant uptrend, CRYPTOCAP:BTC experienced a healthy correction, finding support at a key demand zone. The current bounce from this level, marked by a bullish candle, signals a potential shift towards upward momentum. Volume is steadily increasing, which further strengthens the case for a continued move higher.
Additionally, there’s a notable rise in MARKETSCOM:BITCOIN ETF inflows, adding more fuel to the current rally. This confluence of bullish factors sets the stage for BTC to reach new highs, with $75,000 being the next major target on the horizon. Traders should watch for sustained volume and momentum as key indicators of this breakout.

$BTC Daily UpdateSo BTC Price Action has been played out as expected so far. You could check my previous analysis for more information.
Very strong bearish momentum after mitigating premium and unmitigated daily supply range that we have been waiting for. Price have collected a lot of internal liquidity in Dailly Fractal Structure and I assume the next level price might go is down to $44.000
There is daily flip demand zone at the level of 62.000 - 63.300, and we might get a bullish reaction from that level, but I personally think that level will be used as liquidity and price to mitigate 59.000 - 61.300 demand range. And that is where we could get a bullish reaction If we get any.
Do not try to catch any longs before getting any bullish reaction from the demand zones.
Shorts from 65.200 - 68.000 more probable imo

BTCUSDT - corrections start if you like the idea, please "Like" it. This is the best "Thanks!" for the author 😊 P.S. Always do your own analysis before a trade. Put a stop loss. Fix profits in installments. Withdraw profits in fiat and please yourself and your friends.

BTCUSDT - SHORT [Daily Signal] [UPDATE]BTC is continuing to show weakness after last upswings - short only.
The circles look like areas of interest for profit taking, but it's not for me to judge.
Rektober is coming, stay tuned.

Next MoveI think this might be the next move of price.
I will look for confirmation after we reach the area.

BTC time to 62000 usdtif you like the idea, please "Like" it. This is the best "Thanks!" for the author 😊 P.S. Always do your own analysis before a trade. Put a stop loss. Fix profits in installments. Withdraw profits in fiat and please yourself and your friends.

BTCUSDT - LONG [Daily Signal] [UPDATE]After several days, the position not only did not weaken, but also strengthened at a better price - worth to enter.
Stay tuned.
