BTCUSDT SHORT - [Daily Signal] [UPDATE]Hidden Bullish Divergence wasn't confirmed, we are still falling to the same target.
Stay tuned.
Btcusdtperpetual

BTCUSDT.P - Trading ConsensusThree trades since the beginning of summer. Three accurate hits. More than 50% profit with minimal risk (250% to be honest).
This is what trading from opportunity looks like, not from need.

#BTCUSDT: $40,000 Possible Next Target! Major Correction! BINANCE:BTCUSDT
Price has changed, we can now see price dropping towards $40,000 which area can be ideal for swing buyers. Now we are eyeing price to reach and reject at $62,000 where we can swing bearish reversal.
Good Luck and trade safe!

I'll share a short-sighted RBI of Bitcoin#BTC
Hi, Friends!
Good to see you all.
I hope you have a joyful weekend.
Let me explain the short-term perspective of Bitcoin
■ The BLUE resistance line has not been able to break through upward.
■Bearish Divergence as RED appears.
■Red short-term uptrend line is broken down.
■ Expected to fall after retesting.


#BTC #Bitcoin #Update #Setup 13 #Eddy#BTC #Bitcoin #Update #Setup 13 #Eddy
Everything is going according to plan, are you enjoying the setups?
((I felt it necessary to give an update so that friends who want to know the right place to buy and know about the next movements of Bitcoin and not panic.))
Related Analysis & Setups of Bitcoin : (( BTC/USD )) : Check Link :

#BTC/USDT Update#Bitcoin Liquidity below the $60k has been taken. The price bounced right from the second EMA.
The third EMA is around $58.3k, The level I've been talking about in my previous updates.
The weekly close will provide more clarity.
Stay tuned, I'll keep this chart updated.
Thank you

Forward to 22500Based on the previous analysis method that was done on May 22, 2022 and referred to in this analysis.
Bitcoin has already gone through two 26-week uptrends and a half-16-week uptrend.
In the analysis based on my method, the bullish period of Bitcoin will end in the next 4 days and the bearish period of 10 to 26 weeks is ahead.
The end point of this downward movement will be 22500.
For more information about this method, please contact me.

BTC short target 34.5k2h time frame
-
BTC is creating a small triangle structure, the liquidation zone of this structure is 44500~45300.
Look at the bigger picture, 45000~45430 is the PRZ, which is made from 0.382 Fibonacci tool and project target at 35700~34500. Also, this PRZ(45k~45.4k) is the potential right top of a big double top structure, so this zone would be good to try short with great expected value.
-
TP: 35700~34500 (~+22%)
SL: 46750 (~-4%)

BTCUSD H1 / POSSIBLE RISE AFTER THE RETRACEMENT 💲Hello Traders!
This is my idea related to BTCUSD H1. I expect a retracement until the resistance level, after that, I will look for a long entry. At this stage, I see Bitcoin as more bullish than bearish.
Traders, if you liked my idea or if you have a different vision related to this trade, write in the comments. I will be glad to see your perspective.
____________________________________
Follow, like, and comment to see my content:
www.tradingview.com

🚨Bitcoin is Ready to Fall Again🚨👋Hi, I hope you had a great weekend.
✅ As I expected , Bitcoin started to rally from 🟢Heavy Support zone($39,000-$37,000)🟢 .
🏃♂️Bitcoin is moving in the 🔴 Resistance Zone($44,700-$41,780) 🔴.
📈Regarding Classic Technical Analysis , it seems Bitcoin has successfully formed a Ascending Broadening Wedge Pattern .
🌊According to the theory of Elliott waves , Bitcoin seems to be completing the wave 5.
🌊The end of wave 5 can continue to a maximum of around $44,800 .
🔔I expect that Bitcoin will FALL at least to the 🟢 Support zone($40,600-$40,280) 🟢 after the completion of wave 5, after breaking the Support line , and in the next step, it can also fill the 🔵 CME Gap($39,700-$39,850) 🔵.
❗️⚠️Note⚠️❗️: An important point you should always remember is capital management and lack of greed.
Bitcoin Analyze ( BTCUSDT ), 1-hour time frame ⏰.
Do not forget to put Stop loss for your positions (For every position you want to open).
Please follow your strategy; this is just my Idea, and I will gladly see your ideas in this post.
Please do not forget the ✅' like '✅ button 🙏😊 & Share it with your friends; thanks, and Trade safe.

BTC/USDTTRADE ALERT!BTC
Ticker: BTC/USDT
Entry: 42,000-42,600
Take Profit: 44,500-46,000
Stop Loss: 38,678
Risk to reward: 1:2
Technical Thesis:
Bitcoin / USDT
In 4 hour time Frame showing inverse head and shoulder pattern which is a (bullish) pattern.
Price broke neckline and is moving up.

#BTC Long Possible#BTC Buy Setup
Even though experts and traders don't want it, the cryptocurrency market is more focused on real-world factors instead of technical analysis. Everyone is waiting for the SEC's decision, and it's likely they'll approve spot BTC-ETF applications. The initial market reaction can be predicted, but we'll have to see how things unfold in the long run.
It's surprising that the cryptocurrency market is paying more attention to real-world factors. This could be because of institutional investors getting involved, decentralized finance (DeFi) becoming more popular, and new cryptocurrency projects emerging.
The SEC's decision on spot BTC-ETFs is highly anticipated. A positive decision could lead to a surge in Bitcoin and other cryptocurrency prices, but a negative decision could cause a market crash.
Ultimately, the future of the cryptocurrency market will depend on factors like the SEC's decision, the overall economy, and new technologies. One thing's for sure: the cryptocurrency market is here to stay and will become even more complex and exciting in the future.
i Will Remove my Stop Loss because i Believe BTC will pump more before the BIG DROP comes.
Keep Save and don't over Leverage! 👍🏼

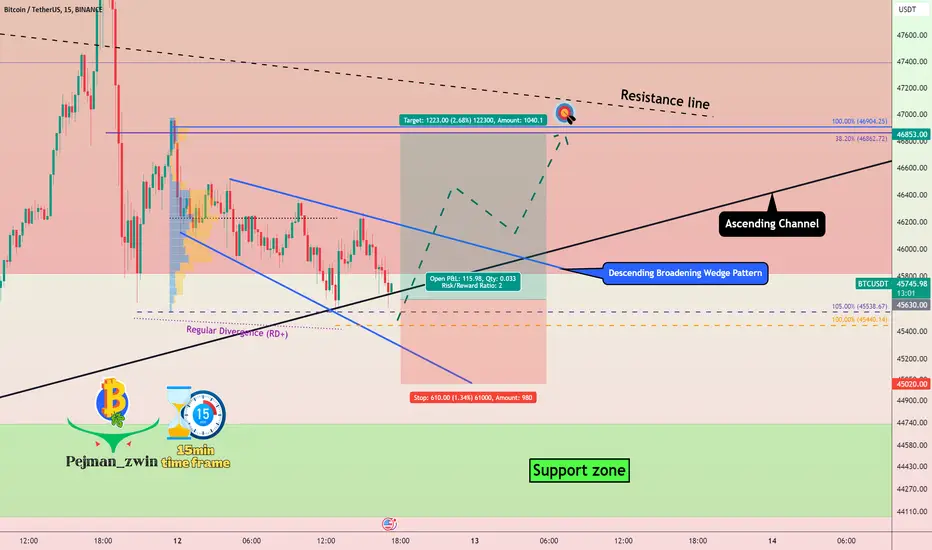
Bitcoin can go UP by Descending Broadening Wedge Pattern🚀✅Bitcoin started to pump after the approval of ETFs by the SEC , but the technical analysis zones are still working, and I showed you all the movements of Bitcoin in the previous post .
🏃♂️Currently, Bitcoin is still moving in the 🔴Heavy Resistance Zone($52,100-$45,800)🔴 and the bottom of the ascending channel , but I expect Bitcoin to make another temporary rally .
🚀It seems that the formation of a Descending Broadening Wedge Pattern can be a sign of the increase of Bitcoin.
🔔I expect Bitcoin to go UP to at least the 🎯 zone 🎯 it indicated on the chart after breaking the upper line of the wedge pattern .
❗️⚠️Note⚠️❗️: An important point you should always remember is capital management and lack of greed.
Bitcoin Analyze ( BTCUSDT ), 15-minute time frame ⏰.
Do not forget to put Stop loss for your positions (For every position you want to open).
Please follow your strategy; this is just my Idea, and I will gladly see your ideas in this post.
Please do not forget the ✅' like '✅ button 🙏😊 & Share it with your friends; thanks, and Trade safe.
BTC/USDT Looking BullishTRADE ALERT! BTC
Ticker: BTC/USDT
Entry:43800-43999
Take Profit: 45500-48000
Stop Loss: 40215
Risk to reward: 1:2
Technical Thesis:
Bitcoin is making an inverse head and shoulder pattern ( bullish)
For this bitcoin need to hold 42000$ level.
We have neckline around 44000$
Once price breaks neckline with good volume then target can be 45500$ to 48000$

RDRB and FVGhere is the 15m time frame chart, there is 15m fvg and price reacted well on the fvg.
when you switch to 4h time frame the 15m fvg level is the RDRB level Redilevered Rebalanced.
that is the support ideas for this plan

Bitcoin Target is 25.1K After Losing Bear Flag.More Sell To ComeBitcoin Exited The Bear Flag and consolidating below its support line. If we lose it there could be a price dump to the range of $23,800 to $25,100.
It could also have a small pull back up to 27.4 before losing the bear flag (jebaiting more long position)
Moved some trendlines and levels.
Thank you all for the support Comments,Follows,Boosts and sharing it with others

BTC Outlook - swing tradeDear all, since my projection indicated that BTC would bounce back at the 26100 area, the reality is that BTC has already bounced back in the range of 26300. In this range, we have observed a swap reaction to the previous demand, but the seller pressure was not as strong as expected, and buyers were unable to create a significant long wick. From this, we can deduce that sellers are entering gradually, potentially aiming for a further downward target in the range of 25500 - 25300.
Currently, we can see that BTC has the potential to undergo a correction by forming a 5-wave downtrend and establishing a channel.
Therefore, the best action plan is to consider placing a long order in the range of 25500 - 25300 and a short order in the range of 28000 - 28300.
We simply need to respond to the signals provided by the market.
The BTC swing trading range is as follows:
28250 (High)
25300 (Low)

BTCUSDT +142.4% roe Short position (Perfect trading idea)More of my trade reviews are in my profile
For everyone who has studied all my trade reviews and updates. We reach our next goal in the SHORT position.
Congratulations friends. Below, you can study the complete trading history.

MarketUpdates Bitcoin support is 23500#MarketUpdates #Bitcoin support is 23500 while resistance is 25200. #Bitcoin has performed well since yesterday while more alts have also strengthened their support. 25200 has become a tough resistance for Bitcoin (but may cross). When the resistance of 25200 is crossed successfully. So we may see a #bullish spike in the overall market.

Bitcoin update#Bitcoin update
#Bitcoin once again rejected at 25200 resistance.
Due to which Bitcoin is on a normal correction.
Bitcoin minor support is 23800 while good support is 230000

BITCOIN BACK TO $20KI have a habit of deleting my drawings and re-drawing them every other day to get a fresh perspective on the charts. Personally, it helps me stay disciplined and less biased as re-charting can help show new perspectives I otherwise may miss due to the clutter from the previously drawn lines and indicators.
Today, as I redrew, I wanted to make some predictions for possible Price Action (PA). As I was doing this, I stumbled upon an interesting and feasible scenario that ends up with $BTC above $20k.
I started out with the usual marking of support (demand) and resistance (supply) zones starting from Monthly, to Weekly, to Daily. As there have been much heavier consolidations and lesser volume or volatility as of late, I don't rely on the H4 timeframe as much anymore since the PA tends to just extend consolidations.
I noticed the beautiful chart of $BTC USDT PERP on the Daily. Imbalances have been getting filled, inequalities are being matched, and fib was being respected. With fib playing nicely, I decided to draw an Elliott Wave.
After reviewing the Elliott Wave rules, and matching with personal experience, I was able to draw highly likely scenario, where Wave 5 ends at -61.8% or about $20.2k
Feel free to reach out to discuss this idea.

Bitcoin can become 22 thousand dollarsBitcoin will probably drop from the ceiling of the channel to the bottom of the channel, i.e. around 22 thousand dollars, here is a very important resistance, and on the other hand, the ceiling of the dynamic channel
