BTCUSD Live Chart H1Here is myv iew for BTCUSD on H1. The price could go bearish, you can put a pending order on the Order block or find an entry on LTF within OB Zone. Trade Safe!
Btcusdtrade

BTCUSD Live Chart H1Here is my view for BTCUSD on H1. The price could go bullish, you can put a pending order on the Order block or find an entry on LTF within OB Zone. Trade Safe!

BTC short TradeRSI divergence confirm the trade
Wait for retest
Manage your risk reward ratio
this would be swing trade, 10x - 20x leverage would be good.

To the moon ! but from the otherside4:1 ratio just like the ETH trade i posted. don't forget risk management guys and good luck !

BITCOIN gain after correction to the downside ❌🧨Hello 🐋
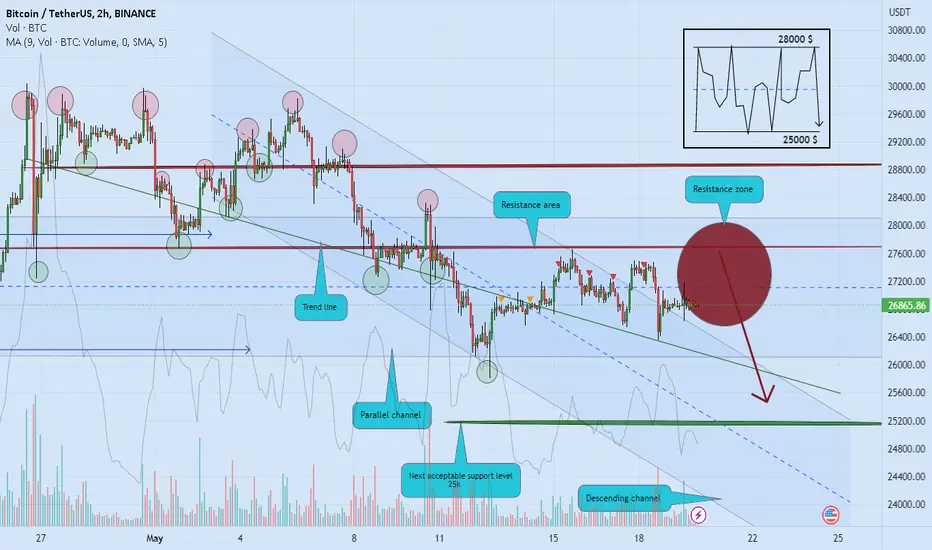
based on the chart, the price is close to the descending channel resistance, resistance area and breakout of support to the downside completed 📖💡
for
any other huge pump, we need more correction to the downside 💡📖
if
the breakout of the first support area (25K) to the downside won't happen, we can see more gain from 25k 💡📖
but
if
breakout of the lower support zone(25k) be completed, we can see more correction to the downside at least close to 23k area and see more gain from 23k level 📖💡
and
range candlesticks to the upside and downside before any other sharp movement is logical 📖💡
👌 Notice: pay attention to the price on shortcut chart (located under the main chart with black colour) 📖💡
Please, feel free to share your point of view, write it in the comments below, thanks 🐋

BTCUSD Live Chart H4Here is my view for BTCUSD on H4. The price could go bearish, you can put a pending order on the Order block or find an entry on LTF within OB Zone. Trade Safe!

BITCOIN range market and with potential of correction ❌🧨Hello 🐋
based on the chart, the price stick in the range market cycle and it is temporary 💡📖
beside
it is close to the descending channel resistance and resistance area and breakout of support to the downside happened 📖💡
for
any other huge pump, we need more correction to the downside 💡📖
👌 Notice: pay attention to the price on shortcut chart (located under the main chart with black colour) 📖💡
Please, feel free to share your point of view, write it in the comments below, thanks 🐋

BITCOIN range candlesticks and more correction ❌🧨Hello 🐋
based on the chart, the price stick in the range market cycle and it is temporary 💡📖
beside
it is close to the descending channel resistance and resistance area and breakout of support to the downside happened 📖💡
for
any other huge pump, we need more correction to the downside ❌🧨
👌 Notice: pay attention to the price on shortcut chart (located above the main chart with black colour) 📖💡
Please, feel free to share your point of view, write it in the comments below, thanks 🐋
BTC/USDT: Formed a falling wedge.BINANCE:BTCUSDT.P BINANCE:BTCUSDT.P
Hello everyone 😃
Before we start to discuss, I'll be so glad if you share your opinion on this post's comment section and hit the like button if you enjoyed it!
Alright folks, Let's take a quick look on CRYPTOCAP:BTC , There's a formed falling wedge on daily TF and I believe that this formation could lead the price to the lower levels.
You might ask yourself why?
Well, The reason is that the last formed DARVAS box at $29000 - $32000 and the historical weekly S/R zone formed around at $28800 are rejecting the price here and filled the potential with bearish momentum, So on High TF, There's a high chance for CRYPTOCAP:BTC to gets the ladder to the lower support at $24700.
But the problem is that we can't locate a good entry for Our SHORT after the pattern breaks down (Breaking below the falling wedge).
So, We'll head to lower Time-Frame charts for better understanding of the chart!
Before that, Let's review our Factors on the current chart:
- CRYPTOCAP:BTC has formed a falling wedge and it can lead the price to the lower levels.
- If Price break below the pattern it won't be a tradeable movement, Cause it's going to be a neutral movement towards $24700.
On other hand, For those who are looking for opportunities:
- If CRYPTOCAP:BTC breaks above $28300, We'll have the chance to enter LONG towards $32000 if with a hold above the marked S/R line!
- If the price rejects below $24700 on daily TF, Then it's more likely for CRYPTOCAP:BTC to dive to the lower supports at $22850, $21650 and $20450.
Let's take a quick look on the 4H's chart too 😉
As you can see, There're two potential Price voids which are solidly made by liquidity candles (Explained it as on TV account).
So, As CRYPTOCAP:BTC gets the rejection from the higher order-block, I would like to set my eyes on the lower support at $26500, If CRYPTOCAP:BTC lose the support there, The it'll be likely for Price void to complete the pattern (Dive to $25300 with liquidity candles).
Also, There'll be more rejection if CRYPTOCAP:BTC break below the support zone at $24250, In that case;
Aside of Price void formation, There'll be high chance for CRYPTOCAP:BTC to reach $18K and $15K again! (Even lower if I want to be clear).
But, On other hand, If CRYPTOCAP:BTC breaks above the S/R zone located at $28300, As I said on High TF chart, Then there'll be a chance for bulls to show the growth towards $30200 one more time and test the resistances till $32000.
Hope you enjoyed the content I created, You can support us with your likes and comments!
Attention: this isn't financial advice we are just trying to help people with their vision.
Have a good day!
@Helical_Trades

BTCUSDT - manipulation to come if you like the idea, please "Like" it. This is the best "Thanks!" for the author 😊 P.S. Always do your own analysis before a trade. Put a stop loss. Fix profits in installments. Withdraw profits in fiat and please yourself and your friends.

BTCUSD Daily AnalaysisAs we analyzed it before, BTCUSD is falling down, after sharp bullish weekly leg.

BTCUSD LongHello guys.
This pair has now completed the falling flag pattern. I now anticipate that the price will retest the zone, before building a bullish momentum! With that, the entry price and stop loss will change, but the target is still 30100.

BITCOIN close to channel resistance and resistance area ❌🧨Hello 🐋
based on the chart, the price is close to the descending channel resistance and resistance area and breakout of support to the downside happened 📖💡
for
any other huge pump, we need more correction to the downside 💡📖
if
the breakout of the first support area (25K) to the downside won't happen, we can see more gain from 25k 💡📖
but
if
breakout of the lower support zone(25k) be completed, we can see more correction to the downside at least close to 23k area and see more gain from 23k level 📖💡
range candlesticks to the upside and downside before any other sharp movement is logical 📖💡
👌 Notice: pay attention to the price on shortcut chart (located under the main chart with black colour) 📖💡
Please, feel free to share your point of view, write it in the comments below, thanks 🐋

Bitcoin StrugglingHello traders, here is my view for btc at the moment :
Bitcoin was in bearish move since May 5th with increasing volume + open interest and convergence with RSI momentum in daily timeframe, this is a confirmation for strong bearish move.
What I expect :
BTC weekly closed below 26900 next stop is 25k area
BTC weekly closed above 27250 next resistance is 28k area
But BTC would not go above 29k IMO since there is a strong channel resistance.
I personally bearish for BTC since the abc correction target is on 25k area which is psychological number + fibonacci retrace confluences.

Btc Still bearish Btcusdt
Hourly time-frame btc need to break 27500 level for bullish move expecting more drop from here

BITCOIN range and correction before more gain 📖💡Hello 🐋
based on the chart, the price is close to the descending channel resistance and resistance area and breakout of support to the downside happened 📖💡
for
any other huge pump, we need more correction to the downside 💡📖
if
the breakout of the first support area (25K) to the downside won't happen, we can see more gain from 25k 💡📖
but
if
breakout of the lower support zone(25k) be completed, we can see more correction to the downside at least close to 23k area and see more gain from 23k level 📖💡
range candlesticks to the upside and downside before any other sharp movement is logical 📖💡
👌 Notice: pay attention to the price on shortcut chart (located under the main chart with black colour) 📖💡
Please, feel free to share your point of view, write it in the comments below, thanks 🐋

Btc | Correction Time Btcusdt
Daily timeframe
Btc breaks the triangle pattern support on daily time frame testing local horizontal support incase of losing this support I am expecting 20-30% drop
Personal opinion not financial advice always do your own research

BTCUUSD H4 ANALYSIS BTCUSD break previous support and now good demand zone is FWB:27K and strong zone is $26.5k and we are looking for a target $30 then plus above all area and technical mentioned in chart
just need your support so that we can work more efficiently thanks for supporting me


Opportunity to do long BTC/USDTToday, Bitcoin continues to maintain a narrow volatile market. Judging from the structural trend, Bitcoin maintains a volatile upward trend. Recently, the K-line has appeared many times, announcing that the short-term decline is basically over. , Then the next step may be to go long at a low level.So in short-term trading, we can execute according to the following trading rhythm.
1.At present, the short-term support focuses on the position of 28600-28800, and the support area can consider going long BTC/USDT in small batches.
2.Further support is at the position of 28000-28200, and the support area is long BTC/USDT.
3.The pressure carried above is on the 29000-29200 line. If the resistance area can be broken through strongly, the increase is expected to continue, that is, the 29800-30000 position.
The above are the key areas of BTC that need to be paid attention to in the short term and the general trading rhythm, and I will announce the more detailed trading rhythm and entry position in my channel.If you want to grasp the detailed trading rhythm and master accurate trading signals, you can enter my channel.

* BTCUSD MULTIPLE SETUPS SOON!! *
* Here we can see clearly BTCUSD is forming The Bearish Flag ( Continuation Pattern ) soon.
* I can see we can pull Multiple Trade Positions from the next moves of BTCUSD.
* I've put EP for SELL position & EP for BUY position.
* I recommend to take the SELL position as we can see clearly it's forming The Bearish Flag.
* Keep your eye close on your trading positions.
* Happy pip hunting traders.
* FX KILLA *

Mainly shorting BitcoinThe BTC/USDT trading signal given today made some profits in the trading.
So how should BTC/USDT be traded next?Overall, before the upward breakthrough of 30,000 points, the resistance above Bitcoin was relatively large. On the whole, Bitcoin's rebound after the decline was relatively small, and the overall trend of volatility was still maintained.Then in the next trend, mainly focus on the following points.
1.Pay attention to the short-term support area 28200-28000 area. If the support area is not broken, you can try to go long BTC/USDT in small batches.
2.Pay attention to the short-term resistance area 29200-29400 area. If you cannot effectively break through this area during the rebound process, you can try to go long BTC/USDT in small batches.
3.Pay attention to the resistance area 29800-30000 area above, and when the market rebounds to this area, you can boldly short BTC/USDT.
The above are the key areas of BTC that need to be paid attention to in the short term and the general trading rhythm, and I will announce the more detailed trading rhythm and entry position in my channel.If you want to grasp the detailed trading rhythm and master accurate trading signals, you can enter my channel.

Btc Update | Higher Time-frame Btcusdt
Btc chart still looks bullish on higher time-frame but the problem is volume which is low on weekends
I don't think there is anything bearish on the chart.As long as the price of btc is above 27k everything is normal.
Dyor
