Take advantage of Bitcoin's current transactional opportunitiesBecause it was too late to write a specific analysis just now, I reminded everyone in my channel to short the current price of Bitcoin. Then friends who keep up with the pace of trading, Bitcoin is basically shorting at the position above 28600.
Let me give you a detailed analysis of why Bitcoin is shorted in the short term at this position.Judging from the recent trend, the daily line has had an upper shadow line on the closing line for 6 consecutive trading days, proving that the upper pressure is strong enough.It is difficult to make an effective breakthrough upward in a short period of time, and yesterday's negative K-line proved that even if the currency price wants to continue to break upward, it will take a certain amount of time to make a pullback correction so that the currency price can accumulate upward momentum.
On the other hand, the price is overbought, which may also lead to short selling in the short term, thereby suppressing the price of Bitcoin.But there is strong buying support below. So here I think that Bitcoin will have a certain pullback and correction trend at least in the short term.In this regard, we can fully seize short-term trading opportunities to obtain benefits.
In the short-term processing, the pressure of 28700-28900 is concerned above, and the support of 27800-27300 is concerned below.
In order to facilitate everyone to continue to follow up on my analysis and sharing, you can like and follow me; in addition, I will share the daily real-time strategy in the channel. If you can't follow up in real time, you may make operational errors.You can use the following methods to enter my channel for free to follow the latest news and follow up on market trends in real time.
Btcusdtrade

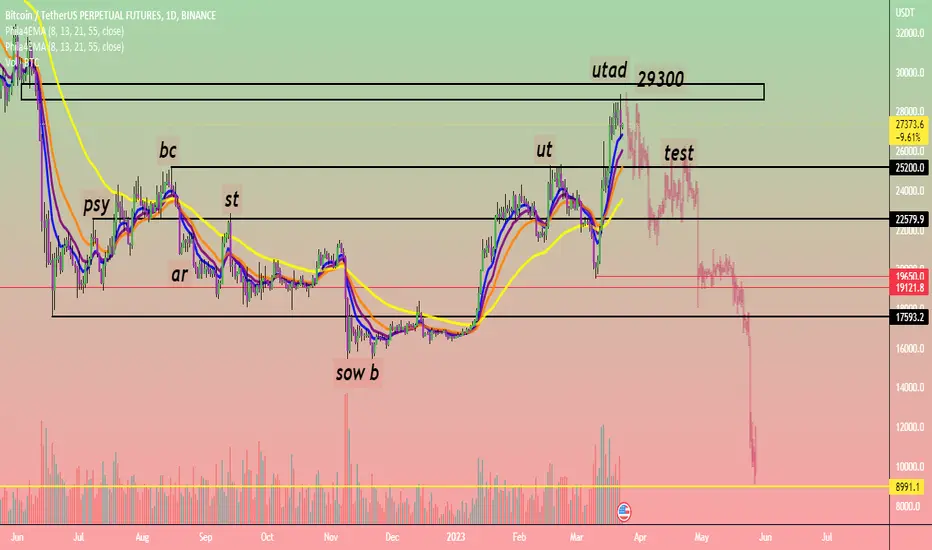
Btcust distribution on daily time framebtcusdt formed distribution on daily timeframe now the price is on utad area .. if price respect bellow 29400 then
btcusdt ll no more bullish ,, the structure ll be change..
if it happened then price ll go down for lower low 12k 9.7k round about ...
not a financial advice just it is for the learning purpose
The price of Bitcoin is brewing the next upward trendJudging from the recent trend of Bitcoin, it has been dealing with narrow fluctuations. It seems that the pressure on the top is relatively strong, making it difficult for Bitcoin to break through effectively in the short term, and the long-term ability seems to have been consumed.
In fact, from a cyclical point of view, since Bitcoin rose from the 19550 position, many times on the way up, it will make certain retracements or pauses to consolidate the bottom foundation to support Bitcoin to continue to maintain its upward trend.Although Bitcoin has paused recently, the short-term low is constantly rising, and in the process of testing the low, it has not destroyed the upward trend, so the current trend of Bitcoin is still healthy.
So overall, for Bitcoin's recent narrow volatility treatment, it is very likely that the next upward trend is brewing, and it is expected to hit the 30,000 position.In the short-term treatment, the lower support is near 27900-28000, and the initial pressure above is at the 29000 integer mark.
In order to facilitate everyone to continue to follow up on my analysis and sharing, you can like and follow me; in addition, I will share the daily real-time strategy in the channel. If you can't follow up in real time, you may make operational errors.You can use the following methods to enter my channel for free to follow the latest news and follow up on market trends in real time.

Bitcoin: Can the bulls hold on?Judging from the current trend of Bitcoin and the overall market sentiment, the pressure level of 28,500 above is too strong to break through in the short term. There is a need for Bitcoin to withdraw, but the 27,000 below is still the key support for Bitcoin.Yesterday, Bitcoin broke through the recent high and stood near 28472, and then retreated to near 27300. It seems that Bitcoin will be trading sideways at least in the short term.
At present, the Bitcoin price is oscillating back and forth at a high level, and the pressure above is strong, making it difficult to break through in a short period of time. Even if the Bitcoin price can continue to rise, it will at least need to be confirmed by stepping back to accumulate upward momentum during the rise, so there is a demand for retracement in the short term.
On the other hand, the supply of Bitcoin on exchanges has increased significantly in the past week or so, which may also mean that BTC may face selling pressure.
In the short-term treatment, the lower support is near 27500, and the initial pressure above is near 28500.
In order to facilitate everyone to continue to follow up on my analysis and sharing, you can like and follow me; in addition, I will share the daily real-time strategy in the channel. If you can't follow up in real time, you may make operational errors.You can use the following methods to enter my channel for free to follow the latest news and follow up on market trends in real time.

BTCUSD - eyeing the support levelScenario 1:
I'm waiting and seeing if the price will correct till the support level.
From the support level, I will see if the price rebounds positively or drops further to USD20k.
Scenario 2:
Alternatively, price retraces to the support level then rebounds to USD30k.
If price surpasses the resistance level, potentially can continue it's bullish momentum till USD40k.
Comment
At current level, price seems to be overbought based on the Stoch indicator. So a correction is likely.
Watching the resistance level closely as this will help me to determine if I can enter for a long position.

#BTC ready to go long, pay attention!Hi guys, This is CryptoMojo, One of the most active trading view authors and fastest-growing communities.
Consider following me for the latest updates and Long /Short calls on almost every exchange.
I post short mid and long-term trade setups too.
Let’s get to the chart!
I have tried my best to bring the best possible outcome to this chart, Do not consider financial advice.
#BTC WEEKLY UPDATE
This big falling wedge pattern is still in the pay.
(basics info)
what is a falling wedge pattern?
The falling wedge is a bullish pattern. Together with the rising wedge formation, these two create a powerful pattern that signals a change in the trend direction. In general, a falling wedge pattern is considered to be a reversal pattern, although there are examples when it facilitates a continuation of the same trend.
> Important support level is 25k
> BTC Needs to close this weekly candle above $25400
> The volume is increasing, which is a characteristic of a third wave. We could expect a strong bull run in the market as many indicators are showing.
> $25K will now act as strong support as it is broken after large accumulation and will likewise offer great opportunities in case of retracement.
Stay tuned I will keep updating
This chart is likely to help you make better trade decisions if it does consider upvoting it.
I would also love to know your charts and views in the comment section.
Thank you

BTCUSDT to head for weekly resistanceBTCUSDT is moving upward with strong momentum. A weekly resistance is sitting above the price and it is 8%-9% above the current price. Looking at the price action and the resistances on its upward path, it seems likely that the price would target this weekly resistance around 29500-30000 before any pullback and then probably its upward journey to monthly resistance. On 4h time frame it seems, price wants to cool off a bit and if that happens, the price would land on the 4h support zone marked on the chart and very probable a good bounce from there.

Btc | Smaller Time Frame | Expecting CorrectionBtcusdt
Formed ABCD Bearish Pattern , Expecting 25500 / 23600 Before Next Bullish Move
#Dyor

BTCUSD two top pattern in 15m chartalthough the BTCUSD is in an uptrend movement, the chart made a two top pattern near the almost 30000 area. which means it possibly going to react to this resistance. area.

Btcusdt Looking Extremely Bullish Btcusdt
Chart Is Looking Ultra Bullish Specially On Higher Time-frame
Expecting Massive Bullish Move In Coming Months
( 46-99k )
#Dyor

Sell Stop for BTCUSDPrice has made a bearish divergence. if the price breaks the neckline it would go for trend reversal. Double top has formed as a clear indicator of trend reversal.

Ethereum Ready for $3500 in Coming Months..?Hi guys, This is CryptoMojo, One of the most active trading view authors and fastest-growing communities.
Consider following me for the latest updates and Long /Short calls on almost every exchange.
I post short mid and long-term trade setups too.
Let’s get to the chart!
I have tried my best to bring the best possible outcome to this chart, Do not consider financial advice.
#ETH UPDATE
ETH breakout this symmetrical triangle pattern.
(Basic info)
A symmetrical triangle is a chart pattern characterized by two converging trend lines connecting a series of sequential peaks and troughs. These trend lines should be converging at a roughly equal slope.
According to the pattern we can expect almost 100% bounce from here but we may see a restest of this pattern which is not done yet.
This is the last time to accumulate ETH in this range at CMP to $1660
(DYOR)
Stay tuned I will keep updating
This chart is likely to help you make better trade decisions if it does consider upvoting it.
I would also love to know your charts and views in the comment section.
Thank you

Btc | What A Weekly Close | Send It Towards 46kBtcusdt
Falling Wedge Brrakout & Retest
Descending Channel Breakout & Retest
Weekly Closing Above 200 Ema
Btc Is Going To Touch 50k In coming Months
Highest Weekly Candle Close since May 2022
Best Weekly Percentage Return since April 2019.
First Weekly Close Above EMA200 since March 2020

Btc | 32k After Correction | Btcusdt
As we expected btc brekas Inverse Head & Shoulder Neckline, now expecting restest, incase of succesful retest btc will fly again
Note : Do Your Own Research

Bitcoin - SHOCKING Similarities to 2018Hi Traders, Investors and Speculators of the Charts 📈📉
In today's analysis as a Bitcoin chart, I take a look at a fractal that played out on Bitcoin during 2017 - 2018. Why this fractal is so relevant despite the obvious similarities, is because it played out after BTC's previous ATH formed. Afterward the bearish cycle was the beginning of the bull cycle that led to BTC's current all time high. We are currently also correcting from BTC's latest ATH and a very similar pattern points to BTCUSDT potentially setting up to make new highs.
I believe there is an important balance between trend line analysis / chart analysis, and technical indicator analysis. I find that fractals and trend analysis ( trend lines , support zone and resistance zone , Fibonacci ) is really helpful for longer term, whilst technical indicators such as RSI can be very useful for the shorter term. Important to note that today's analysis is focused on longer term, in other words potentially more than 3 months as the previous fractal also played out over a few months.
Since you're here 👀 Check out this idea on XRPUSDT :
Have a great weekend 🥂
_______________________
📢Follow us here on TradingView for daily updates and trade ideas on crypto , stocks and commodities 💎Hit like & Follow 👍
We thank you for your support !
CryptoCheck

#BTC is getting ready for the Big move!!Hi guys, This is CryptoMojo, One of the most active trading view authors and fastest-growing communities.
Consider following me for the latest updates and Long /Short calls on almost every exchange.
I post short mid and long-term trade setups too.
Let’s get to the chart!
I have tried my best to bring the best possible outcome to this chart, Do not consider financial advice.
#BTC UPDATE
BTC has completed an inverse head and shoulder pattern, which is technically a strong bullish pattern.
As of now, bulls are showing momentum as the bullish volume is expanding, and a solid breakout above the strong horizontal resistance of $25K.
we need a daily candle close above it, then it will be the confirmation of the bull run in the market.
I would also love to know your charts and views in the comment section.
Thank you

BTC: the fall is just a prelude to a better rise
After Bitcoin fell below 22K, it was not surprising that it fell below 20K. This is something we cannot change, we can only say that the bearish market has temporarily won. However, in my years of trading experience, market trends are formed through continuous fluctuations, and we need to face them rationally.
When we started to establish a long-term position to buy Bitcoin, we emphasized that there was strong resistance at 25K, and it is normal to see a retracement during the upward trend. However, the extent of this retracement has exceeded my expectations. But I can only say that the larger the magnitude of the fall, the better the buy point it will provide. Personally, I will buy Bitcoin at a lower price below 20K and plan to hold it for the long term. For those who are optimistic about Bitcoin's future and think it may reach 10K or even lower, please don't rush to refute me, time will be the best answer.
I will continue to update my personal operations in the future, but of course, it is only for reference. Friends with small funds or poor trading mentality should not participate.

BTCUSDT Trade Set-Up for LONGHolding support and retesting the zone of 19500, a significant strong bull movement results in a bull market, as $ index shows divergence and higher chances of BTCUSDT going up in next coming weeks

Trade range BTCUSDthe trade plan is described in the chart. you can either play in a range of S1 and R1 OR you can place sell Stop or Buy stop if it breaksout.

BTCUSDT -BTCUSDPERP - SELL - BEARISHbtcusdt is expected to fall from the exact area but could also spike up to the 25000 area and then fall heavily towards 11000$ so stay alert
always use confirmation and always use stop loss.
dont rely on me as i am not your paid investment consultant!
bitcoin analysis - crypto analysis!

Has the BTC's decline finally ended?
Following the release of the US NFP and unemployment rate data on Friday, BTC saw a small rebound and is currently trading steadily above 20K. In the short term, it tested support near 19500, and institutional orders continue to suppress BTC prices. Market sentiment remains bearish, and overall trend is sluggish. Some predict that the future trend will fall below 10K, but we will not comment much on these predictions.
As I mentioned in a previous article, I have been buying BTC continuously below 20K, and I am currently making a small profit. However, many traders who are bearish on BTC have questioned my strategy. Unfortunately, currently, 80% of the market does not expect BTC to rise in the future due to the large decline that has caused many to lose confidence and shift their outlook from bullish to bearish. However, what I want to say is that the market can only show you what it wants you to see.
The significant decline is obviously a large-scale sell-off and washout by the main players, hoping to clear out all long positions and wait until the market believes that there will be no more increase before starting to rebound. My strategy is to continue to build up my position at low levels. However, it is clear that the current decline has not ended yet, and there may be another wave of decline to make more people believe in the strength of the bears before ultimately forming a reversal and catching most people off guard. I will continue to update my long-term strategy, which requires a significant amount of capital and a good mindset to follow the main players. You may have a different opinion, but we let time witness the outcome. Please stay tuned, and I will update my strategy in a timely manner.

📉BTC ready to retest the 18K level📈BINANCE:BTCUSDT
COINBASE:BTCUSD
Bitcoin analytical series S01E07
Hello traders, don't forget to risk-free your positions.
Targets ----> green lines
Please share ideas and leave a comment,
Let me know what's your idea.
CrazyS✌

BTCUSDT - the two most likely scenariosHello! The downward movement I predicted one month ago () has taken place. Then I expect one of two scenarios: Fast scenario (A): long-term positions will be formed over the next weeks - two months in the range of 17,200 - 19,700 and a new upward movement will begin in April-May of this year. Scenario (B) is longer and deeper. Long-term positions will form in the range of 15,000 - 18,300 and a new uptrend will begin in the second half of summer - early autumn of this year. There are other scenarios, the probability of which I consider lower than these two. What are your thoughts?
