Btcusdtrading

BTCUSDT - Bullish Opportunities !Welcome to our Trade Setups - June 24th ( BTCUSDT ) !
BUY BTCUSDT
ENTRY LEVEL @ 34852.75
SL @ 27642.95
TP @ 63806.16
Max Risk: 1% - 3%!
Risk/Reward Ratio: 4
Leave us a comment or like to keep our content for free and alive.
Have a great week everyone!


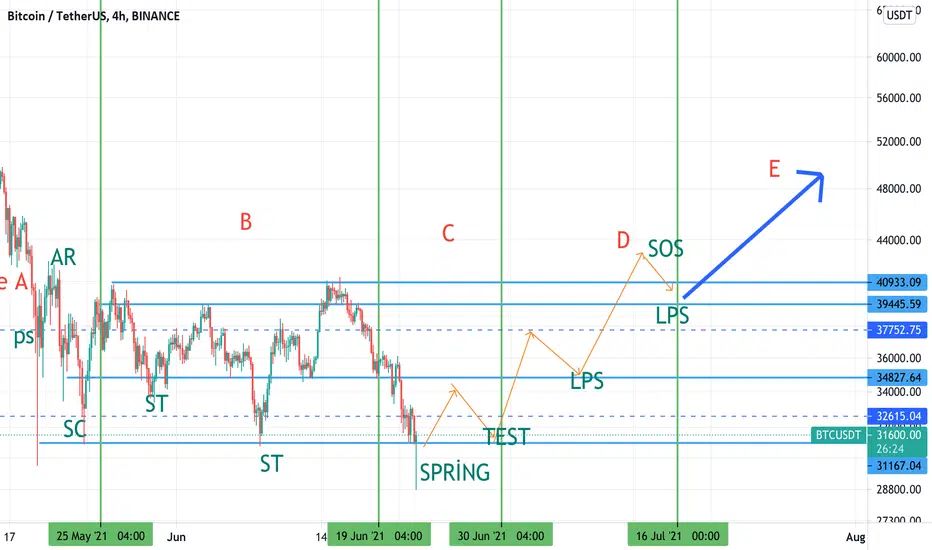
Next few days BTC predictionDear traders, as you see the colored line in picture, and as the price action analysis, it is the third time that the price is thouching the resistant line. That is shown with purple and red line. The red line specifically is the Longer term than purple one. Therefore it is more reliable to touch and pullback the price, but the purple line is acceptable too.
I guess the price is thouching these two lines and the rise to higher price rapidly.


BTCUSDT - Bullish Opportunities !Welcome to our Trade Setups - June 10th ( BTCUSDT ) !
BUY BTCUSDT
ENTRY LEVEL @ 37160.69
SL @ 30189.89
TP @ 51068.41
Max Risk: 1% - 3%!
Risk/Reward Ratio: 2
Leave us a comment or like to keep our content for free and alive.
Have a great week everyone!

BTC very interesting patterns!Hello, I am back with an idea on BTCUSDT pair 2h time frame. Recently, I have been keeping a strong eye on BTC, as alts are mostly hurt and some of them are finding it hard to recover. Last time I shared the idea, we hit our target on BTC. I got two scenarios to mention, both connected with each other:
FIRST SCENARIO:
As you can see, it has formed a bearish flag at broke out of it. It tells us that we will continue the bear scenario for a while possibly. Even the RSI tells us we keep forming LH as RSI gets higher but it does not have a bullish momentum and power.
SECOND SCENARIO- We broke out and we see there a bullish pattern forming after the breakout. When I drew the RSI lines, i saw this pattern form with the movement of BTC. We may see another drop very soon but it seems as everything won't last long and we probably become bullish very soon, in the wedge pattern formed there. As long as we don't break under 26-28k, BTC will soon become very bullish.
If we get to stay above 35k, we may see it again try for 40-42k, however it does not help us a lot in the mid term. But it can be profitable if we manage to consolidate in the 35k. But keep an eye on the two scenarios, as things will get very nice in a week or two from now. Trade with patience and time your entries. Good profits can be made even in bear momentums. Hope you enjoy my idea. If you have any comment, you are welcome to share it. :)

BTCUSDT - Bullish Opportunities !Welcome to our Trade Setups - June 09th ( BTCUSDT ) !
BUY BTCUSDT
ENTRY LEVEL @ 34035.46
SL @ 29520.07
TP @ 47578.03
Max Risk: 1% - 3%!
Risk/Reward Ratio: 3
Leave us a comment or like to keep our content for free and alive.
Have a great week everyone!

BTCUSDT - Bullish Opportunities !Welcome to our Trade Setups - June 06th ( BTCUSDT ) !
BUY BTCUSDT
ENTRY LEVEL @ 35760.76
SL @ 28789.96
TP @ 63743.89
Max Risk: 1% - 3%!
Risk/Reward Ratio: 4.01
Leave us a comment or like to keep our content for free and alive.
Have a great week everyone!

BTCUSDT - Bullish Opportunities !Welcome to our Trade Setups - June 03th ( BTCUSDT ) !
BUY BTCUSDT
ENTRY LEVEL @ 38767.58
SL @ 35607.72
TP @ 48259.16
Max Risk: 1% - 3%!
Risk/Reward Ratio: 3
Leave us a comment or like to keep our content for free and alive.
Have a great week everyone!


Continue the correction process #BitcoinOne of the best levels of demand and price returns can be $26920. Reaching a safe shopping point is a condition of the red box box ($25600), which can be quickly happy at the bottom two points, and then we will see the price return, and the probability that it will remain in the side range for several days (currently it is unlikely).
Within the same daily time and four hours in the chart, we still have two directions of pullback and continued to fall (do not rush and think about buying at low points)
Be careful not to buy after each pullback, we have already said that these pullbacks are only for collecting Sell orders.
Don't forget to like

BTCUSDT - Bullish Opportunities !Welcome to our Trade Setups - May 20th ( BTCUSDT ) !
BUY BTCUSDT
ENTRY LEVEL @ 41601.51
SL @ 29766.62
TP @ 58181.55
Max Risk: 1% - 3%!
Risk/Reward Ratio: 1.4
Leave us a comment or like to keep our content for free and alive.
Have a great week everyone!


BTCUSDT - Bearish Opportunities !Welcome to our Trade Setups - May 16th ( BTCUSDT ) !
SELL BTCUSDT
ENTRY LEVEL @ 45823.98
SL @ 53024.78
TP @ 31451.54
Max Risk: 1% - 3%!
Risk/Reward Ratio: 2
Leave us a comment or like to keep our content for free and alive.
Have a great week everyone!

Investigate the possible trend of #BTCThe H formed in the pullback requires HL, which can be the green box of the entry point for the new HH, which I specified approximately two targets in the chart.


BTCUSDT - Bearish Opportunities !Welcome to our Trade Setups - April 21th ( BTCUSDT ) !
SELL BTCUSDT
ENTRY LEVEL @ 55149.09
SL @ 64882.29
TP @ 35705.26
Max Risk: 1% - 3%!
Risk/Reward Ratio: 2
Leave us a comment or like to keep our content for free and alive.
Have a great week everyone!
