BTCUSDT: Elliot waves 4hrFollowing the previous analysis, I imagine such a path for Bitcoin in the 4-hour period. It seems that the fifth wave moves similar to the first wave. And this view that you see next to the chart is taken from wave 1-1 of the first wave and the maximum value that Bitcoin can rise is the range of 21000.
Btcusdtshort

BTCUSDT: Elliot Waves DailyHello to all friends. In Bitcoin, we see the wave trend in the form of a five-wave pattern (C). So far, 4 waves have been formed. And we are moving towards the fifth wave. Considering that the third wave is 1.272% of the first wave, I expect the fifth wave to be the same as the first wave and touch the ratio of 200%, which is equal to $10,900.

WIL BTC BE ABLE TO HOLD THIS SUPPORT!!Hi guys, This is CryptoMojo, One of the most active trading view authors and fastest-growing communities.
Consider following me for the latest updates and Long /Short calls on almost every exchange.
I post short mid and long-term trade setups too.
Let’s get to the chart!
I have tried my best to bring the best possible outcome to this chart, Do not consider financial advice.
#BTC(Update)
Hi guys, This is CryptoMojo, One of the most active trading view authors and fastest-growing communities.
Consider following me for the latest updates and Long /Short calls on almost every exchange.
I post short mid and long-term trade setups too.
Let’s get to the chart!
I have tried my best to bring the best possible outcome to this chart, Do not consider financial advice.
#BTC(Update)
BTC breakdown this bearish flag pattern in the daily time frame.
if it retests this pattern successfully then according to the pattern it can drop up to 42%.
In case a daily candle closes inside the flag pattern then the pattern will be invaded.
This chart is likely to help you make better trade decisions if it does consider upvoting it.
I would also love to know your charts and views in the comment section.
Thank you
This chart is likely to help you make better trade decisions if it does consider upvoting it.
I would also love to know your charts and views in the comment section.
Thank you

BTCUSD Breakout Short!BTC-USD was trading in a local uptrend
Along the rising support line
But then the pair broke the support line
Which became a resistance
And so after the retest horizontal resistance at 22572.7
The most likely direction of the next move
Is down towards the target below

btcusdt is going to break down bearish Flag on daily time framebtcusdt is going to break down bearish Flag on daily time frame
bicoin is now bearish wait for big dump in Crypto Market
it is not a Financial advice

#BTC UPDATE Hi guys, This is CryptoMojo, One of the most active trading view authors and fastest-growing communities.
Consider following me for the latest updates and Long /Short calls on almost every exchange.
I post short mid and long-term trade setups too.
Let’s get to the chart!
I have tried my best to bring the best possible outcome to this chart, Do not consider financial advice.
#BTC(Update)
BTC is consolidating in an ascending triangle. As we are seeing strength from both bulls and bears and currently BTC is also trading above the point of control level.
This is a very crucial level and we've to wait for a breakout with a retest to confirm a bullish move, while a sustained breakdown of the POC level would target the horizontal support.
This chart is likely to help you make better trade decisions if it does consider upvoting it.
I would also love to know your charts and views in the comment section.
Thank you

BTCUSD 🏹see and watch :)
The price fluctuates in a 15-minute time frame in an ascending channel, and we are waiting for the channel to break and the price to fall at any moment...

#BTC breakout this Descending Broadening Wedge!!Hi guys, This is CryptoMojo, One of the most active trading view authors and fastest-growing communities.
Consider following me for the latest updates and Long /Short calls on almost every exchange.
I post short mid and long-term trade setups too.
Let’s get to the chart!
I have tried my best to bring the best possible outcome to this chart, Do not consider financial advice.
#BTC(Update)
Bitcoin breakout this Descending Broadening Wedge in 2hr timeframe.
We can expect a good rally from here but IMO never trust BTC in case of a breakout it’s always surprised us.
The majority of Traders/Influencers were Talking about 10k-12k-14k in case BTC did fake out this breakout.
This chart is likely to help you make better trade decisions if it does consider upvoting it.
I would also love to know your charts and views in the comment section.
Thank you

BTCUSDT Down Trend.!#BTCUSDT Looking for Sell trade setup as I mentioned in the Chart.!
Keep Supporting LIKE, COMMENT And FOLLOW.!
Thank You.!

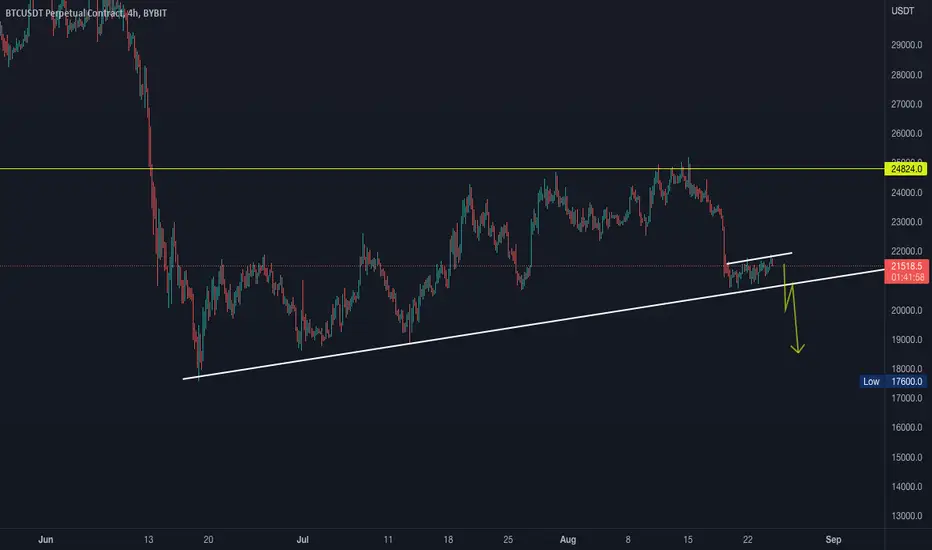
BTC Short from Trend Line BreakBYBIT:BTCUSDT
BTC has been ranging in a huge bear flag. Possible buildup for downside break of major Trend Line. Should the Trend Line break and retest bearish, downside target possibly $17600.
For an aggressive entry, look for entry via lower time frame in buildup.
If you liked this idea or if you have your own opinion about it, write in the comments.
The information and publications are not meant to be, and do not constitute, financial, investment, trading, or other types of advice or recommendations.
The best scenario for Bitcoin analysis in the MID termThe best scenario for Bitcoin analysis in the MID term is that the downward trend will continue
But now, if the price support above the $22,000 area and observe pressure from buyers ,
The price has the potential to rise to $25,000 resistance and then fall to new lows
Or if observe seller pressure and the $20,800 support breaks to the down and then we experience a fall to lower levels.

Keep an eye on 3D chart.It is a sideways movement at the end of which is already very soon a death cross of EMA100 and EMA200.
As many have already noticed here, there is also a bear flag on the smaller timeframes.

BTCUSDT Down Trend.!#BTCUSDT Looking for Sell trade setup as I mentioned in the Chart.!
Keep Supporting LIKE, COMMENT And FOLLOW.!
Thank You.!

WIL BTC BE ABLE TO HOLD THIS SUPPORT!!Hi guys, This is CryptoMojo, One of the most active trading view authors and fastest-growing communities.
Consider following me for the latest updates and Long /Short calls on almost every exchange.
I post short mid and long-term trade setups too.
Let’s get to the chart!
I have tried my best to bring the best possible outcome to this chart, Do not consider financial advice.
#BTC(Update)
One more daily candle closes below the lower trendline.
The Bulls seem to be losing momentum but still, BTC is holding above the trendline as support.
A liquidity grab might be a possible scenario, while a solid breakdown would be a bearish sign for BTC to move towards $19K support.
Stay tuned
This chart is likely to help you make better trade decisions if it does consider upvoting it.
I would also love to know your charts and views in the comment section.
Thank you

BTCUSDT ShortTime Frame: 4H
Symbol: BTCUSDT
Entry: 21254.30
TP: 20055.03
SL: 22106.41
Bias: Short
The current price pattern of this instrument is bearish and the bear is heading downward and therefore we are to look for a selling opportunity.

BTC: ANOTHER BEARISH SCENARIO!!Hi guys, This is CryptoMojo, One of the most active trading view authors and fastest-growing communities.
Consider following me for the latest updates and Long /Short calls on almost every exchange.
I post short mid and long-term trade setups too.
Let’s get to the chart!
I have tried my best to bring the best possible outcome to this chart, Do not consider financial advice.
#BTC(Update)
The process has started for #bitcoin. Recovery is now very difficult.
The flag down a break that I shared yesterday has also arrived. I think we are now in a new and hopefully recent downtrend.
what's your opinion? Will the sharp decline continues for #btc or will there be a recovery?
This chart is likely to help you make better trade decisions if it does consider upvoting it.
I would also love to know your charts and views in the comment section.
Thank you

One day. Yeah, we have a wonderful situation.
The candles have fallen below all indicator lines and below the cloud.
The red dot on the volume flow indicator has been there for days.
Now we have a gray cross on the SQZMOM with the indicator being
in its bearish half. At the very least it is a test of the lower boundary of the old downward channel.
And then lower still.

BTCUSD top-down analysisHello traders, this is the full breakdown of this pair. We will take this trade if all the conditions are satisfied as discussed in the analysis. Smash the like button if you find value in this analysis and drop a comment if you have any questions or let me know which pair to cover in my next analysis.

BTC BEAKDOWN THIS BEARISH FLAG PATTERN!! WHAT's NEXT?Hi guys, This is CryptoMojo, One of the most active trading view authors and fastest-growing communities.
Consider following me for the latest updates and Long /Short calls on almost every exchange.
I post short mid and long-term trade setups too.
Let’s get to the chart!
I have tried my best to bring the best possible outcome to this chart, Do not consider financial advice.
#BTC(Update)
BTC breakdown this bearish flag pattern in the daily time frame and currently retesting it.
if it retests this pattern successfully then according to the pattern it can drop up to 42%.
In case a daily candle closes inside the flag pattern then the pattern will be invaded.
This chart is likely to help you make better trade decisions if it does consider upvoting it.
I would also love to know your charts and views in the comment section.
Thank you

btcusdt short 15min & 5min downtrend on bitcoin short term and break down the trend. showed you guys by marks

BTCUSDT Down Trend.!#BTCUSDT Looking for Sell trade setup as I mentioned in the Chart.!
Keep Supporting LIKE, COMMENT And FOLLOW.!
Thank You.!

BTC Breaking The Big Ascending ChannelBitcoin/USDT has broken the ascending channel the past day and has broken also the critical support at 22572 USDT (RED LINE), leading the pair to come down and retest some lower prices.
In the main time BTC is standing between the previos broken support level at 22572 USDT that was flipped as a resistance for the pair now, and the next support level to watch at 20800 USDT (GREEN LINE).
If the price keeps going lower, the second level to watch after a breakout and close blow the first support level would be at 18876 USDT, and with that the pair would flip the first support marked by the green line to resistance and move to the next support (BLUE LINE) at 18876 USDT.
A breakout and a close above the current resistance (RED LINE) will invalidate everything.

BTC broke down rising wedge on 1D BTC classic breakdown out of the rising wedge. 9.45% dumped. Target 21.7k crucial support hits in the immediate short term. 20.7k next support likely to be broken.
