Bitcoin: Breaking Below $80K Soon,10% Correction on the Horizon?Hey Realistic Traders, Bitcoin is consistently hitting new lower lows. Could this signal that the bear market is here to stay? Let’s dive in.......
On the H4 chart, Bitcoin is clearly in a bearish phase. It consistently trades below both the trendline and the EMA 200, reinforcing the downtrend. Additionally, a rising wedge pattern has formed and broken out, and the MACD has shown a bearish crossover. This crossover is a key indicator, signaling that momentum is shifting from buyers to sellers.
Together, these signals suggest that Bitcoin may drop toward our first target at 79,081. After reaching this level, a short pullback is expected as traders take profits before the price continues its descent toward a new low at 73,633.
This outlook remains valid as long as the price moves below the stop-loss level at 89,557
Support the channel by engaging with the content, using the rocket button, and sharing your opinions in the comments below.
Disclaimer: "Please note that this analysis is solely for educational purposes and should not be considered a recommendation to take a long or short position on Bitcoin.
Btcusdtshort

btcusd sell scalpingbtcusd sell scaliping
reason is 1hr support touch
so sell side passiblity high change

Upward movement to 86,822 at H4Considering the completion of the "caps based on RTM" pattern, an upward movement to 86,822 can be anticipated.
However, on the daily timeframe, an upward movement up to 95 is possible.
Goodluck!

BTCUSDT Falling Wedge ( Possible Scenario )BTC is testing the key level at 81600 right now and if this level fails to hold BTC will falls to 69-72k which is the bottom of falling wedge

U.S. Econ Shocks: Bitcoin & Profit SignalsThe latest U.S. economic data has brought significant impacts. The core PCE inflation witnessed a 0.4% month - on - month increase, hitting the highest growth in a year, with a year - on - year rise of 2.8%, exceeding market anticipations. Meanwhile, the long - term inflation expectation from the University of Michigan has soared to a 32 - year high, intensifying market concerns about inflation's resurgence. Currently, the market remains enveloped in macro - risks, pending a softening of market sentiment.
Turning to the Bitcoin market, as depicted in today's price trend (the current BTCUSDT price is $82,338.01, dropping by $2,086.37, a 2.47% decline), the K - line chart analysis indicates a downward trend. The Williams indicator signals an oversold condition. Additionally, trading volume has contracted recently, with both price and volume decreasing, suggesting a sluggish and inactive market.
Nevertheless, if Bitcoin can stabilize above $82,000 and there are signs of capital reflux, gradual position - building may be considered, with a target price set above $90,000. Investors must recognize that the Bitcoin market brims with uncertainties. Variables such as forthcoming U.S. economic data, regulatory policies, and geopolitical scenarios will all sway Bitcoin prices. In this volatile financial landscape, meticulous analysis and judicious decision - making are of utmost importance for investors navigating the Bitcoin market.
BTCUSDT
buy@82000-83000
tp:84500-86500
I will share trading signals every day. All the signals have been accurate for a whole month in a row. If you also need them, please click on the link below the article to obtain them.

"Bitcoin (BTC/USD) 3H Analysis: Key Support & Potential 12% UpsiSupport and Entry Zone (Purple Area at ~$80,253.41)
A significant support zone is marked in purple, indicating a potential area for entry.
This is an area where buying interest is expected.
Stop Loss (~$77,784.92)
A stop loss level is defined below the support zone, which is a risk management strategy.
Target Price (~$90,275.48)
The chart suggests a bullish move if the price bounces from the support.
The expected price increase is around 12.25% from the entry level.
Exponential Moving Averages (EMA)
30 EMA (Red Line, $85,290.12): Short-term trend indicator.
200 EMA (Blue Line, $86,061.21): Long-term trend indicator.
The price is currently below both EMAs, suggesting a bearish trend in the short term.
Market Outlook
The price has recently rejected resistance (purple zone above).
If it holds support at ~$80,253.41, a reversal to the upside is expected.
If the support breaks, further downside could follow.

Bitcoin Nears Breakout: Can Bulls Push Past $89K?Currently, the key support level for the price of Bitcoin is around $86,000. This level has played a supporting role several times in the recent price fluctuations. If the price can hold this position, it will provide strong support for subsequent upward movements. The key resistance level above is at $89,000. If the price of Bitcoin can break through and firmly stand above this resistance level, it is highly likely to initiate a new round of upward market; if it fails to break through, the price may continue to experience small - scale oscillatory rebounds within the current range.
From a technical indicator perspective, the moving average indicates that Bitcoin has a short - term upward trend. The price has broken through the area where the signal line is located, indicating that the pressure from "digital gold" buyers is relatively high, and the asset value is likely to continue the upward momentum from the current level. However, the MACD indicator experienced a bearish crossover at the beginning of this week. Although the signal line is currently downward, the MACD line has started to move upward. Nevertheless, a trend reversal is unlikely to occur in the short term. In terms of the Relative Strength Index (RSI), this indicator has moved out of the oversold area and is currently in the neutral zone, indicating that the seller's market may have ended. The price of Bitcoin is expected to maintain its current position and may further rise within the next 5 - 7 days.
BTCUSDT
buy@86000-86500
tp:87500-88500
I will share trading signals every day. All the signals have been accurate for a whole month in a row. If you also need them, please click on the link below the article to obtain them.

BTCUSD strategy discussionWe suggest that you observe more and trade less. Keep doing so until it shows a definite breakout direction.

BTC's Bull Run: Profit Realized, Resistance AheadCurrently, BTC is hovering around $88,000. We had already achieved our profit target yesterday. Ever since BTC broke through the $85,000 mark, it has been rising continuously. The market is in a bullish - dominated trend, with strong buying power driving the price up steadily. Although it's in an uptrend, there's uncertainty about its future movement as it hasn't broken through the $89,000 - $90,000 resistance range. If it fails to break through this resistance zone effectively, the price may decline again eventually.
I will share trading signals every day. All the signals have been accurate for a whole month in a row. If you also need them, please click on the link below the article to obtain them.

BTC:Today's trading strategyBitcoin is currently in a continuous fluctuating situation. Yesterday's temporary rally also indicates that it is still unable to break through the resistance level of 89,000 for the time being, and there is a downward extension trend.
The strategy of shorting at the high level yesterday has already yielded profits. Today, on the rebound at a high level, continue to take short positions.
BTC Trading strategy:
Sell@88000-88500
TP1:85500
TP2:84000
Get daily trading signals that ensure continuous profits! With an astonishing 90% accuracy rate, I'm the record - holder of an 800% monthly return. Click the link below the article to obtain accurate signals now!

BTCUSD:BTCUSD: SHORT, TP86600-85600BTCUSD now has an obvious double-head pattern, and the short opportunity is worth a try. There is support near 86600, followed by 85800. These can be used as two targets. If the support is strong during the fluctuation process, the order can be closed in advance.

BTC/USDT:Pay attention to the resistance zone.BTC fluctuated within the forecast and reached the profit point. However, the 88K-89K resistance area needs to be watched, and if it cannot be effectively broken this week, then it will fall
This week, the BTC trading strategy was completely correct and the account made more than 200% profit in two weeks
We share various trading signals every day with over 90% accuracy
Fans who follow us can get high rewards every day
If you want stable income,You can follow the link below this article

BTC Rejected at $89K, Uptrend Holds. Bullish Bets?BTC faced rejection at the $89,000 resistance level yesterday, triggering a pullback. However, the overall uptrend remains intact. Investors may consider long positions on signs of stabilization after this corrective move.
BTCUSDT
buy@84500-85500
tp:87000-88000
I will share trading signals every day. All the signals have been accurate for a whole month in a row. If you also need them, please click on the link below the article to obtain them.

BTC Today's strategyYesterday's chart already shows an upward channel for BTC, let's continue to hit the resistance area of 88K-89K
btcusdt buy@85.5K-86K
tp:88K-89K
We share various trading signals every day with over 90% accuracy
Fans who follow us can get high rewards every day
If you want stable income, you can contact me

BTCUSDT Rally: From $85K to $88K+, What's NextToday, the price of BTCUSDT has shown a robust upward trend. Bullish forces are extremely active, steadily propelling the price to continuously climb, demonstrating a sharp offensive momentum.
From a technical perspective, upon in - depth analysis, the current price is gradually approaching the crucial resistance range of 89,000 - 90,000.
This range has played a significant role in past price movements. Its breakthrough situation will be a pivotal turning point determining the subsequent price trend.
Once a successful breakthrough occurs, it is highly likely to attract more capital inflows, driving the price to initiate a new round of upward price action.
I will share trading signals every day. All the signals have been accurate for a whole month in a row. If you also need them, please click on the link below the article to obtain them.

BTCUSD LOOKING MORE BULLISH market take sell side liquidity now going for kill buy side liquidity .we have fvg in daily tf we will use confirmation in daily fvg

Whether BTC can reach 90KWhether BTC can reach 90K
Our strategy has made a profit and now BTC is testing the 88K resistance, let's see if we can break it today

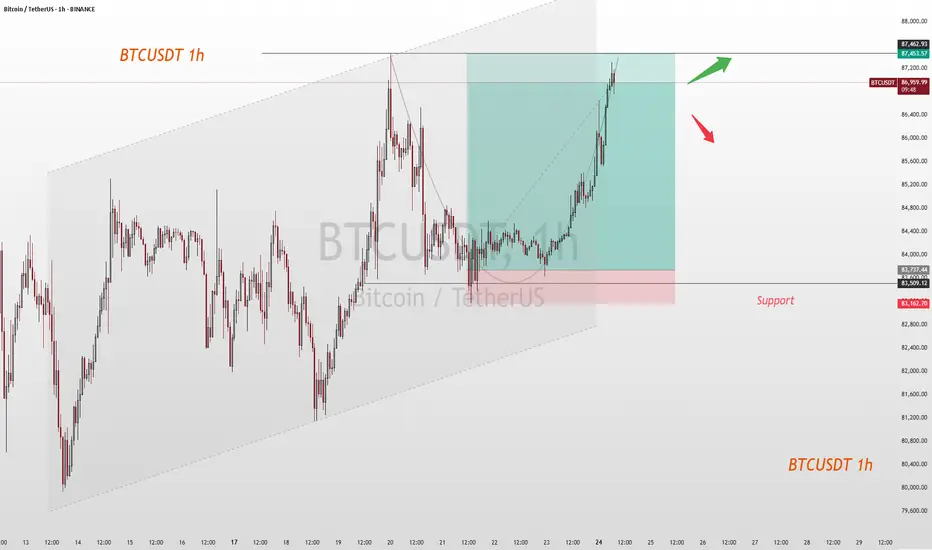
BTCUSDT: Target Achieved, What's Next for 87,500 Resistance?Upon reviewing the trading strategy devised last week, the current market price has successfully rallied to the targeted level. Bitcoin against Tether (BTCUSDT) is quoted at 86,780, registering an intraday gain of 0.84%. From the vantage points of technical analysis and market dynamics, the robust resistance level in the vicinity of 87,500 above emerges as a pivotal factor in determining whether the price can sustain its upward trajectory.
I will share trading signals every day. All the signals have been accurate for a whole month in a row. If you also need them, please click on the link below the article to obtain them.
Each wave around 87K is the moment we buyEach wave around 87K is the moment we buy
btcusdt buy@87K-87.5K
tp:88.5K-89K
We share various trading signals every day with over 90% accuracy.
Fans who follow us can get high rewards every day
If you want stable income, you can contact me.

BTC Today's strategyHi guys, it's a new week and the charts show it's moving up the channel
Looking back on the trading strategy we developed last week, we were undoubtedly successful. Now that the price has exceeded 87K, we still need to pay attention to the resistance of 88K, as it is the determinant of whether the upside can be
btcusdt buy@84.5K-85K
tp:87.5K-88K
We share various trading signals every day with over 90% accuracy.
Fans who follow us can get high rewards every day
If you want stable income, you can contact me.

BTC:Short at high levelsAs per my previous strategy, Bitcoin is on an upward trend. It witnessed a strong rally at today's opening and faced short - term resistance around 88,000. If it fails to break through 88,000 in the short term, one can seize the opportunity of the price pullback from the high level to initiate short positions.
BTC Trading strategy:
Sell@88000-88500
TP1:85500
TP2:84000
Get daily trading signals that ensure continuous profits! With an astonishing 90% accuracy rate, I'm the record - holder of an 800% monthly return. Click the link below the article to obtain accurate signals now!

BTC/USDT "Bitcoin vs Tether" Crypto Market Bearish Heist Plan🌟Hi! Hola! Ola! Bonjour! Hallo!🌟
Dear Money Makers & Robbers, 🤑 💰🐱👤🐱🏍
Based on 🔥Thief Trading style technical and fundamental analysis🔥, here is our master plan to heist the BTC/USDT "Bitcoin Tether" Crypto Market. Please adhere to the strategy I've outlined in the chart, which emphasizes short entry. Our aim is the high-risk Green Zone. Risky level, oversold market, consolidation, trend reversal, trap at the level where traders and bullish robbers are stronger. 🏆💸Book Profits Be wealthy and safe trade.💪🏆🎉
Entry 📈 : The heist is on! Wait for the breakout of (80000) then make your move - Bearish profits await!"
however I advise placing Sell stop below the MA line or Sell limit orders within a 15 or 30 minute timeframe. Entry from the most recent or closest low or high level should be in swing/retest.
📌I strongly advise you to set an alert on your chart so you can see when the breakout entry occurs.
Stop Loss 🛑: Thief SL placed at (84000) swing Trade Basis Using the 4H period, the recent / swing high or low level.
SL is based on your risk of the trade, lot size and how many multiple orders you have to take.
Target 🎯: 68000 (or) Escape Before the Target
🧲Scalpers, take note 👀 : only scalp on the Short side. If you have a lot of money, you can go straight away; if not, you can join swing traders and carry out the robbery plan. Use trailing SL to safeguard your money 💰.
📰🗞️Fundamental, Macro, COT Report, On Chain Analysis, Quantitative Analysis, Intermarket Analysis, Sentimental Outlook:
The BTC/USDT "Bitcoin Tether" Crypto Market is currently experiencing a Neutral trend (there is a higher chance for Bearishness).., driven by several key factors.
⭐Fundamental Analysis
Fundamental analysis assesses Bitcoin's core metrics and market position. Here are the key factors:
Market Capitalization: Approximately 1.68 trillion USD, calculated using the circulating supply of 19.83 million BTC multiplied by the current price of 85,000 USDT. This reflects Bitcoin’s significant presence in the crypto market.
Trading Volume (24h): Around 31.44 billion USD, indicating robust liquidity and active trading activity over the past day.
Circulating Supply: 19.83 million BTC, out of a maximum supply of 21 million BTC, meaning 94.4% of the total supply is already in circulation.
Price Context: Bitcoin’s current price of 85,000 USDT is below its all-time high of 109,356 USD (reached on January 20, 2025), suggesting it is in a corrective phase but still well above historical lows (e.g., 2 USD on October 20, 2011).
Key Insight: Bitcoin’s fundamentals remain strong with a high market cap and active trading volume, but the price being below its recent peak indicates potential vulnerability or a consolidation period.
⭐Macroeconomic Factors
Macroeconomic conditions influence Bitcoin’s price as a global asset. Here are the relevant factors:
Global GDP Growth: Forecasted at 3.0% to 3.3% for 2025, suggesting moderate economic expansion worldwide. This level of growth may support risk assets like Bitcoin but isn’t strong enough to trigger significant inflation concerns.
Commodity Prices: Expected to decline by 5% in 2025, potentially reducing Bitcoin’s appeal as an inflation hedge since falling commodity prices signal lower inflationary pressure.
Stock Market Performance: U.S. stock indices are up 5% year-to-date (YTD) as of early 2025, reflecting a positive risk-on sentiment that often correlates with Bitcoin’s performance as a speculative asset.
Interest Rate Policies: The U.S. Federal Reserve is anticipated to cut interest rates in 2025, which could weaken the USD and make Bitcoin more attractive relative to USDT (a USD-pegged stablecoin). Conversely, the Bank of Japan may raise rates, though this has a limited direct impact on BTC/USDT.
Key Insight: Macroeconomic conditions are mixed—declining commodity prices may dampen Bitcoin’s inflation-hedge narrative, but stock market gains and potential Fed rate cuts could bolster its price.
⭐Global Market Analysis
Global market trends and events provide context for BTC/USDT’s performance:
Geopolitical Events: No significant geopolitical tensions are currently reported as of March 5, 2025. This reduces demand for Bitcoin as a safe-haven asset, unlike during periods of global unrest.
Central Bank Policies:
Federal Reserve: Expected rate cuts could weaken the USD, potentially driving BTC/USDT higher as investors seek alternatives.
Bank of Japan: Anticipated rate hikes may strengthen the JPY, but this has minimal direct influence on BTC/USDT unless it triggers broader currency shifts.
Commodity Trends: A projected 5% decline in commodity prices may ease inflation fears, indirectly reducing Bitcoin’s appeal as a store of value.
Global Risk Sentiment: Mixed stock market performance globally suggests a neutral stance on risk assets, with no strong directional push for Bitcoin.
Key Insight: Without major geopolitical catalysts, Bitcoin’s price may hinge on central bank actions, particularly Fed rate cuts that could weaken the USD and support BTC/USDT.
⭐Commitment of Traders (COT) Data
COT data offers insights into large trader positions, though specific BTC/USDT COT reports are not directly available. Here’s an inferred analysis:
Technical Ratings: Current indicators for BTC/USDT show a “sell” signal, with oscillators (e.g., RSI, MACD) and moving averages (e.g., 50-day, 200-day) trending strongly bearish.
Trader Positioning: The bearish technical outlook suggests large traders (e.g., speculators) are likely net short, anticipating further price declines.
Market Implications: This positioning could amplify downward pressure if selling continues, though a reversal in sentiment could trigger a short squeeze.
Key Insight: The inferred COT data points to bearish sentiment among large traders, aligning with technical signals and suggesting a downward bias.
⭐On-Chain Analysis
On-chain data reflects Bitcoin’s blockchain activity and holder behavior:
Unmoved BTC: Approximately 151,000 BTC, acquired at an average price of 97,800 USDT, has not moved despite recent volatility. This indicates strong conviction among holders at higher levels, potentially acting as resistance.
Accumulation Patterns: Some accumulation occurred near 83,000 USDT, suggesting buying interest at lower levels. However, rapid selling has dominated, with one-third of BTC accumulated between 96,000–97,500 USDT redistributed during the recent decline.
Supply Concentrations: Thin supply exists between 93,000 and 83,000 USDT, with notable clusters at 84,200 USDT (23,000 BTC), 86,900 USDT (25,800 BTC), and 88,900 USDT (46,000 BTC), indicating key price levels where holders may act.
Key Insight: On-chain data shows a mix of strong holding at higher prices and selling pressure at current levels, hinting at capitulation but also potential support forming near 83,000–85,000 USDT.
⭐Market Sentiment Analysis
Market sentiment reflects trader and investor psychology:
Social Media Sentiment: Posts on platforms like X reveal a split outlook—some traders predict a drop to 75,000–73,000 USDT, citing technical weakness, while others see a potential bullish reversal if support holds.
Sentiment Index: Total positive sentiment is estimated at 0.75 (on a scale from -1 to 1), suggesting moderate optimism despite recent declines.
Fear and Greed Index: Specific data is unavailable, but the mixed sentiment aligns with a neutral-to-slightly bullish stance.
Key Insight: Sentiment is mixed but leans slightly bullish, indicating cautious optimism amid uncertainty.
⭐Positioning
Positioning reflects how traders are aligned in the market:
Speculative Positions: Likely net short, inferred from bearish technical signals and COT-like trends, suggesting traders are betting on a decline.
Institutional Positioning: Hedge funds have increased exposure to Bitcoin ETFs, indicating growing long-term interest that could counterbalance short-term selling.
Market Dynamics: Short positions may dominate near-term price action, but institutional buying could stabilize or reverse the trend.
Key Insight: Short-term bearish positioning contrasts with potential long-term bullish institutional interest.
⭐Next Trend Move
The next likely price movement is based on current data:
Direction: Downward pressure is favored, driven by technical sell signals and bearish positioning.
Key Levels:
Support: 80,000 USDT; if breached, 75,000–73,000 USDT becomes the next target.
Resistance: 95,000 USDT, a level that would need to be overcome for a bullish reversal.
Triggers: A break below 80,000 USDT could accelerate selling, while holding above 85,000 USDT might signal stabilization.
Key Insight: The next trend move likely tests lower support levels, with a potential drop to 75,000–73,000 USDT if momentum persists.
⭐Other Data
Additional factors impacting BTC/USDT:
Institutional Adoption: Hedge funds are increasing exposure to Bitcoin ETFs, a bullish signal for long-term price support as institutional capital flows in.
Regulatory Changes: The SEC’s employee buyout program in 2025 could lead to shifts in crypto regulation, introducing uncertainty and potential volatility.
Market Trends: Bitcoin’s limited supply (21 million BTC cap) and growing mainstream acceptance bolster its long-term value proposition.
Key Insight: Institutional interest is a positive wildcard, but regulatory uncertainty could shake confidence in the near term.
⭐Overall Summary Outlook
Overview: On March 5, 2025, BTC/USDT at 85,000 USDT exhibits a cautiously bearish outlook. Technical sell signals, bearish trader positioning, and recent on-chain selling pressure point to downside risks. However, strong holding behavior at higher levels (e.g., 97,800 USDT), potential institutional support via ETF exposure, and a slightly bullish market sentiment suggest a reversal is possible if support holds. Macroeconomic factors like expected Fed rate cuts could weaken the USD and provide tailwinds, though declining commodity prices may temper Bitcoin’s inflation-hedge appeal. Risks include a drop below 80,000 USDT or volatility from regulatory shifts.
📌Keep in mind that these factors can change rapidly, and it's essential to stay up-to-date with market developments and adjust your analysis accordingly.
⚠️Trading Alert : News Releases and Position Management 📰 🗞️ 🚫🚏
As a reminder, news releases can have a significant impact on market prices and volatility. To minimize potential losses and protect your running positions,
we recommend the following:
Avoid taking new trades during news releases
Use trailing stop-loss orders to protect your running positions and lock in profits
💖Supporting our robbery plan 💥Hit the Boost Button💥 will enable us to effortlessly make and steal money 💰💵. Boost the strength of our robbery team. Every day in this market make money with ease by using the Thief Trading Style.🏆💪🤝❤️🎉🚀
I'll see you soon with another heist plan, so stay tuned 🤑🐱👤🤗🤩

3/24 BTCUSD Trading Signal: LongThis is a relatively healthy rebound. After breaking through the first resistance, it slowly rose to the second resistance, where it has been tested many times. The current shape is good and there is room for further rise.
Therefore, in the current transaction, it is recommended to take long as an important reference direction, and the target is near the resistance of 86K.
When the price rises to this point, the market is likely to confirm the validity of the area near the 85K support. If the support is confirmed to be valid, the price may rise to 86.8K-88K.
