BTC Nears Key Breakout: Can It Push Past 84.5K?Right then, BTC/USDT is at a bit of a crucial point at the moment. The buying range we flagged earlier, 82,000 - 83,500, has been left behind, with the price now sitting at 84,139.51 – up 0.06% on the day.
The target for taking profits is still 84,500 - 86,000, and we’re currently hovering near the lower end of that at 84,500. If it manages to break through that level, there’s a decent chance it could push higher – but it’s worth keeping an eye on whether the rally’s got enough steam to keep going.
Things to watch:
84,500 Breakout: If it cracks this level and holds, we could be in for more upside.
Momentum: Keep tabs on volume and market sentiment to see if this move’s got legs.
Pullback Risk: If it doesn’t break through, don’t be surprised if we see a bit of a dip.
BTCUSDT
Buy82000-83500
tp:84500-86000
I will share trading signals every day. All the signals have been accurate for a whole month in a row. If you also need them, please click on the link below the article to obtain them.
Btcusdtshort

BTC Today's strategySo far, BTC has fluctuated around 84K today, and it still fluctuates within our marked range. The strategy of selling high and buying low still works.
Today's BTC trading strategy:
btcusdt buy@83K-83.5K
tp:84.5K-85.5K
There is no large-scale selling by long-term holders in the market. Short-term holders have a significant impact on short-term movements. At present, geopolitical conflicts continue, trade frictions continue, and bitcoin and gold have historically performed well in times of economic uncertainty
Our investment strategy has achieved significant returns in the past two weeks. If you also want to double your capital, you can click on my link to get my trading strategy

BTC/USD hourly trend using Market Timing AnalysisAccording to the analysis, the BTC/USD looks bearish. Trade with the stop loss.

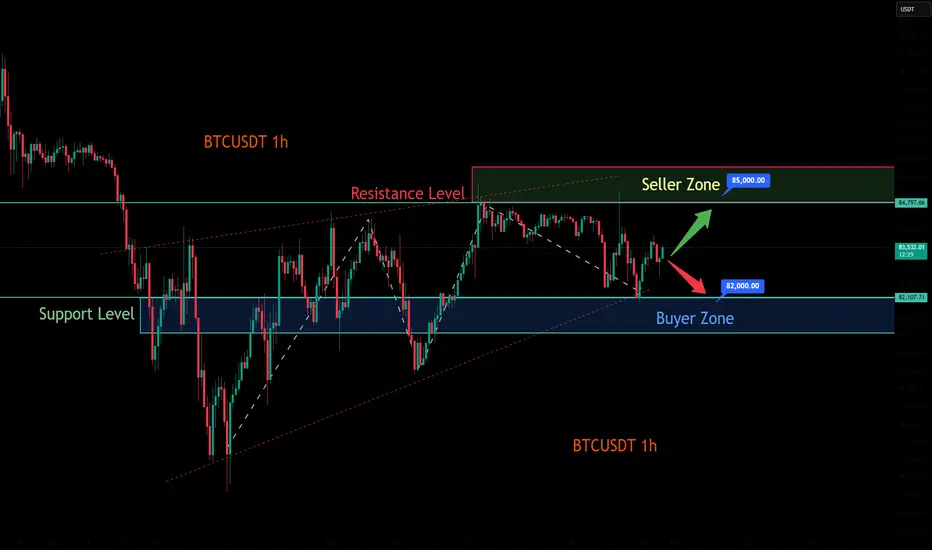
BTCUSDT Long StrategyThe BTC/USDT price is currently consolidating within a range.
You can focus on the 82,000-83,000 zone; if the price retraces to this area and finds support, consider entering a small long position.
The target take-profit levels are between 84,500 and 86,000. If the price reaches 84,500, consider partially closing the position to lock in some profits. If it breaks through this level, the next target is 86,000.
Given the high volatility of the crypto market, it is crucial to manage your position size carefully and avoid overtrading.
BTCUSDT
buy@82000-83000
tp:84500-86000
I will share trading signals every day. All the signals have been accurate for a whole month in a row. If you also need them, please click on the link below the article to obtain them.

BTCUSDT: Key Levels and Trading StrategiesMACD histogram turned positive, indicating emerging short-term bullish momentum despite a $2843 daily drop. RSI (14) at 43.54 shows a neutral-to-weak state, with bears slightly ahead but not in oversold territory, suggesting limited room for further declines. Bitcoin's volatility and recent drop have made investors cautious or even panicked. Some are exiting the market, while others are looking for opportunities to buy the dip or go short. Unstable sentiment is reducing trading activity.
In summary, although BTCUSDT is currently down, bullish signals are strengthening. Key support levels remain crucial. A rebound could occur if prices hold these levels, but a break below may lead to further declines.
BTCUSDT
sell@85000-86000
tp:84000-83500-83000
buy@82000-83000
tp:84000-84500-8500
I will share trading signals every day. All the signals have been accurate for a whole month in a row. If you also need them, please click on the link below the article to obtain them.

BTC Today's strategyToday, BTC still fluctuates within our marked range, and the strategy of selling high and buying low still works
Today's BTC trading strategy:
btcusdt buy@83K-84K
tp:85K-86K
There are risks in trading. If you are not sure about the timing, it is best to leave me a message. This will better confirm the timing of the transaction, It can also better expand profits and reduce losses

BTC Today's strategyAt present, the support range continues to move upward and the fluctuations have exceeded the previous range. This is a new direction. We only need to make appropriate adjustments and trade within the range, selling high and buying low.
Today's BTC trading strategy:
btcusdt buy@83K-84K
tp:86K-87K
There are risks in trading. If you are not sure about the timing, it is best to leave me a message. This will better confirm the timing of the transaction, It can also better expand profits and reduce losses.

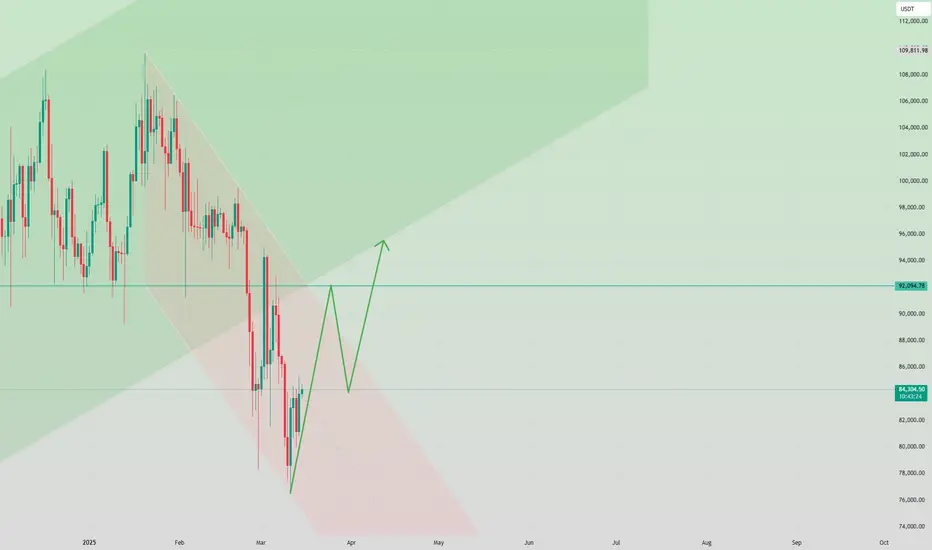
BTC ~ MACRO Bounce ZoneBTC has been holding the 80K zone well, but from the macro perspective the bearish cycle should be starting soon.
This is due to simple logic (after such a dramatic ATH) as well as the Wyckoff Method.
Unless we can reclaim 90K, it's likely that this will be the third touch on the parabolic curve - which is usually when the bearish cycle starts.
Previously, BTC retraced and bounced one Fib higher than the price at the start of the bullish cycle. This puts us roughly at 28k, as well as at the neckline of the previous resistance zone before the new ATH:
______________
BINANCE:BTCUSDT

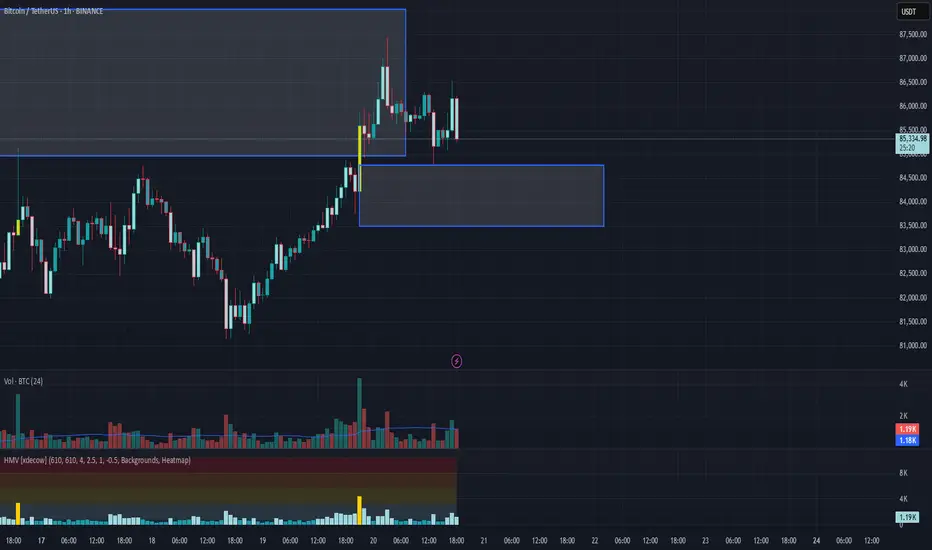
BTC/USDT Analysis: Climactic Moment on the Bitcoin ChartBitcoin managed to hold above the local range despite seller pressure, tested the key volume zone of $85,000–$88,000, and has already shown an initial selling reaction.
Currently, a local support zone has formed at $84,800–$83,500, casting doubt on the scenario of a decline to the lower boundary. If this zone is tested and buyers react to it, the current uptrend will continue. If there is no reaction, the trend will shift to a bearish direction.
Selling Zones:
$85,000–$88,000 (volume zone)
$95,000–$96,700 (accumulated volumes)
$97,500–$98,400 (pushing volumes)
$107,000–$109,000 (volume anomalies)
Buying Zones:
$84,800–$83,500 (pushing volumes)
$77,000–$73,000 (volume anomalies, pushing volumes)
Long Term Bitcoin SituationRemember the time that we broke out the major bull flag in Bitcoin? It caused many new all time high levels in recent months. The problem is that Bitcoin lost its 5 waved bullish momentum. We see an upwards move only because of the fundemantel news.
I believe we are currently in a correction phase known as A-B-C pattern according to Elliot Waves theory. In order for Bitcoin to create another all time high level, there some requirements to achieve.
First, another bullish fundemantel actor in macro economic events. This could be an interest rate cuts, something about ETF's or even some crayz idea from Trump himself. Problably, it will be about intrest rates to be cut down in next june.
Second, Bitcoin needs to gain its delta momentum back (it's called CVD). For many weeks while Bitcoin has risen up, there were some significant movements in futures section. Bulls and long term holders were keeping their positions. With acceptence of the ETF's, spot Bitcoin volume was increased as well. The problem about this part of the story is, big instutial money that carried Bitcoin upwards is leaving. It's mostly because of the new politics that Trump has brought to the US. Instutial money or simple retail traders don't really like when there is an uncertainity about the economy. Fear and uncertainity is taking smart money away from Bitcoin. When this situation changes, money flow will change again and Bitcoin may catch the momentum it needs.
As the last requirement, Bitcoin hasn't actualy swept all the remaining liquidtiy below the lastly formed bullish flag. It's important for two reasons:
1: In technical terms, it will be fine retest and safe entry.
2: All the rookies who play around with futures sections in exchanges will be eliminated. So there will enough liquidty to go upwards again.
Remember, market always run for the liquidty and all the tecnical things you heard from people around is shaped by this consept. We will meet below 70K again before this summer.
For short term, I believe there will be another uprising move before upcoming pullback. It will be a short one and will get people in.
You see RSI below the chart that it's broken a trendline. Usually it's something good but in this case, even though some other indicators tells us that Bitcoin catch is momentum back again, I don't believe its that simple. As an another example, MACD also screaming out for Bitcoin to rise at the this moment in the daily chart. As I mentioned earlier, it's all caused because of the fundemantel news. Nothing real.
Good Luck to us all .

BTC Today's strategyToday, BTC trading is relatively stable and has been fluctuating in the 80K-85K range. We are still buying near support points and selling near resistance points. Once there is a new breakout range, we can simply adjust it
Today's BTC trading strategy:
btcusdt sell@85K-87K
tp:83K-81K

BTCUSD SELL signal. Don't forget about stop-loss.
Write in the comments all your questions and instruments analysis of which you want to see.
Friends, push the like button, write a comment, and share with your mates - that would be the best THANK YOU.
P.S. I personally will open entry if the price will show it according to my strategy.
Always make your analysis before a trade

BTC Today's strategyThe support level of Bitcoin has begun to move upward. Currently, the market is still trading in the range of $80,000 to $85,000. The short-selling strategies I continuously provided have also made profits many times.
This week's BTC trading range could be broken at any time. We just need to wait for the market to show a new direction and then adjust our strategy
Today's BTC trading strategy:
btcusdt sell@85K-87K
tp:83K-81K
We will share various trading signals every day. Fans who follow us can get high returns every day. If you want stable profits, you can contact me.

Today's Strategic Layout for BTC Currently, the price of Bitcoin is fluctuating around $83,000, and the trading activity has declined. At present, the forces of bulls and bears are in an equilibrium state. Looking ahead to the subsequent market conditions, it is necessary to pay close attention to the performance of the support range between $80,000 and $82,000.
BTC trading strategies:
btcusdt sell@85K-86K
tp:82.5K-81K
sl:87K
I firmly believe realized profit and a high win - rate are the best measures of trading skill.
Daily, I share highly precise trading signals. These include clear entry points, stop - loss levels for risk control, and profit - taking targets from in - depth analysis.
Follow me for big financial market returns.
Click my profile for a trading guide on trends, strategies, and risk management.
BTC Today's strategyThe support level for Bitcoin has started to move upwards. Currently, the market is still trading in the range of 80K to 85K. The consecutive short bets I have offered have also been profitable many times
If you are currently unsatisfied with the bitcoin trading results and are looking for daily accurate trading signals, you can follow my analysis for potential assistance.
Today's BTC trading strategy:
btcusdt sell@85K-87K
tp:83K-81K

BTC Today's strategyAt present, BTC is still fluctuating in the range of 80K-85K. This week, after reaching around 85K many times, it started to fall, and the consecutive short bets I provided also made profits many times.
If you are currently unsatisfied with the bitcoin trading results and are looking for daily accurate trading signals, you can follow my analysis for potential assistance.
Today's BTC trading strategy:
btcusdt sell@85K-87K
tp:83K-81K

Analysis of the Recent Price Trend of BitcoinRecently, the price of Bitcoin has been fluctuating wildly, and the market is in a fierce battle between bulls and bears. Currently, the price of Bitcoin is fluctuating around $85,000, showing a convergent triangle pattern, which indicates that significant fluctuations may occur in the short term.
In terms of capital flow, the main funds are quite active. Although there are large market - price sell orders suppressing the price, the buying signals are also very obvious, and the bullish power is gradually increasing. If Bitcoin can break through the $86,000 mark, it may trigger a more substantial increase. Moreover, since the rebound from the low point, Bitcoin has been stable above $84,000, providing certain support for the upward trend.
From a macro perspective, global liquidity is closely related to the price of Bitcoin. It is expected that major central banks will continue to cut interest rates in the next two years, and the M2 money supply is likely to expand, which is good news for Bitcoin. Since February 2024, the global M2 has been rising continuously, laying a solid foundation for risky assets such as Bitcoin. In addition, if the U.S. fiscal policy, the change of the U.S. dollar, and the adjustment of the money supply develop in a favorable direction, it will also boost the demand for Bitcoin.
However, the market is not without risks. Retail investors need to be vigilant against the backlash of selling. At the same time, there is still selling pressure in the range above $96,500. Overall, in the next half - month, if the bulls can continue to exert force with the help of capital and macro - level positive factors, Bitcoin is expected to hit higher prices.
BTC Trading Strategy:
BTCUSDT sell@87K-89K
tp:83K-81K
I firmly believe realized profit and a high win - rate are the best measures of trading skill. Daily, I share highly precise trading signals. These include clear entry points, stop - loss levels for risk control, and profit - taking targets from in - depth analysis. Follow me for big financial market returns. Click my profile for a trading guide on trends, strategies, and risk management.
Bitcoin (BTC/USD) Short Trade Setup – March 15, 2025This is a Bitcoin (BTC/USD) trading setup on a 30-minute timeframe from TradingView. Here's a breakdown of the analysis:
📌 Entry Price: 84,375
📌 Stop Loss: 85,500 (Red Zone - Risk Area 🚨)
📌 Take Profit Levels:
TP1: 83,429
TP2: 82,640
Final Target: 81,259
🔍 Analysis:
The trader is setting up a short position (expecting BTC to decline).
Risk-to-Reward Ratio (RRR) seems favorable, as the target is much lower than the stop loss.
If BTC drops below 83,429, further declines toward 81,259 are expected.
If BTC breaks above 85,500, the trade is invalidated.
🛑 Conclusion:
A bearish trade setup looking for BTC to decline. 📉
Watch for confirmation of downward movement before entering.

BTC Today's strategyThe balance of long and short power in the market suggests that there may be explosive movements in the short term. At present, the price of Bitcoin is fluctuating in the range of 82,000-85,000 US dollars, and the short-term resistance is at 86,000 US dollars. A break through 86,000 US dollars could trigger a new round of gains
Bitcoin ETF funds have seen net outflows for five consecutive weeks, with demand falling to the lowest level in 2025, indicating that institutional funds are withdrawing and market sentiment is turning cautious. However, institutions such as MicroStrategy continue to buy, providing some support for bitcoin prices
The market is worried about the risk of possible liquidity tightening before the FOMC meeting in March, the uncertainty of the global economic situation and the signs of monetary policy adjustment in some major economies, making traditional financial marekts more attractive, and there is a trend of capital flowing back from the cryptocurrency market to the traditional financial field, which has some pressure on the bitcoin price
btcusdt sell@85500-86500
tp:83K-81K
We will share various trading signals every day. Fans who follow us can get high returns every day. If you want stable profits, you can contact me.

BTC Today's strategyIndustry News: Japanese listed company Metaplanet increased its holdings of 162 BTC, which to some extent reflects institutional optimism towards Bitcoin, and may have a positive impact on market sentiment, attracting more investors to pay attention and buy. However, Bitcoin's real-world application is still relatively limited, and its fundamentals are still relatively weak, which may limit the price of Bitcoin in the long run.
From the supply side, after bitcoin hit its highest price in history, short-term holders (STH) increased their holdings, while long-term holders (LTH) decreased their holdings. This change in supply pattern reflects the growing speculative atmosphere in the market, and short-term traders are more sensitive to price fluctuations, which may lead to increased volatility in bitcoin prices. From the demand side, despite the continued increase in bitcoin holdings by institutional buyers and ETFs, actual spot demand continues to decline. If demand does not recover, bitcoin's continued rally may be difficult to maintain.
Overall, the price of Bitcoin on March 14, 2025 is currently showing a certain upward trend, but the overall trend is still facing many uncertainties. A variety of factors such as the macroeconomic environment, the Federal Reserve's monetary policy, industry dynamics, and market supply and demand are all having an impact on the trend of Bitcoin.
buy:77K-79K
tp:83K-85k
We will share various trading signals every day. Fans who follow us can get high returns every day. If you want stable profits, you can contact me.

BTCUSDT SHORT (FIXED 1-ST target NOW) I fix the 1st take at $80,913 and move the stop order to breakeven .
1- the position itself is correct, but such manipulations with the news background and constant volume shift do not allow to correctly assess the moment of price reversal
2- Key markings before opening the position also took the format of price manipulation and should not have reached the value of $84,000 again in a normal market
In this regard, I decide to secure the position and take part of the profit in order to calmly continue trading while respecting the risks .
Main overview:
Further targets remain unchanged

BTCUSDT SHORT M15At the moment, the BTCUSDT trading pair is experiencing a distribution moment. Taking into account the liquidity collected at the top, I open a position in SHORT from the POI and FGV m15 I indicated with the target:
80,607.65$
79,058.00$
76,606.00$
Risk for stop order -1%
