Evening BTC Trend Analysis and Trading SuggestionsLet's review this afternoon's market performance. The BTC price, as we anticipated, rebounded to around 109,000 in the afternoon before plummeting sharply. Living up to "Black Friday", this violent drop was well within our expectations. In the afternoon's live trading, we also reminded everyone that as long as there was a rebound to the upper zone, it was a good opportunity to go short. This drop has created a space of nearly 1,500 points. Currently, the BTC price has pulled back to around 107,800.
From the current 4-hour K-line chart, after a strong upward surge, the market encountered significant resistance near the upper track of the Bollinger Bands. As bullish momentum gradually faded, the price started to come under pressure and decline, suggesting that the short-term upward trend may come to a temporary halt. At present, the market has recorded multiple consecutive candlesticks with large bearish bodies. The price has not only effectively broken below the key support level of the Bollinger Bands' middle track but also caused the Bollinger Bands channel to switch from expanding to narrowing, indicating that market volatility is decreasing. In terms of trading volume, it showed a moderate increase during the price pullback, which further confirms the authenticity of the bearish selling pressure.
BTCUSD
sell@108000-1085000
tp:107000-106000
Investment itself is not the source of risk; it is only when investment behavior escapes rational control that risks lie in wait. In the trading process, always bear in mind that restraining impulsiveness is the primary criterion for success. I share trading signals daily, and all signals have been accurate without error for a full month. Regardless of your past profits or losses, with my assistance, you have the hope to achieve a breakthrough in your investment.
Btcusdtsignal
#BTCUSDT: First $120,000 Then $140,000 Swing Move.Bitcoin has accumulated successfully and is currently on the verge of entering the next price zone, which is 120k, followed by 150k. There’s only one entry zone to consider. We’re confident that the price will move as planned, but it’s not guaranteed. Before taking entry, please conduct your own analysis.
If you like our work, please like, comment, and share.
Team Setupsfx_
❤️🚀

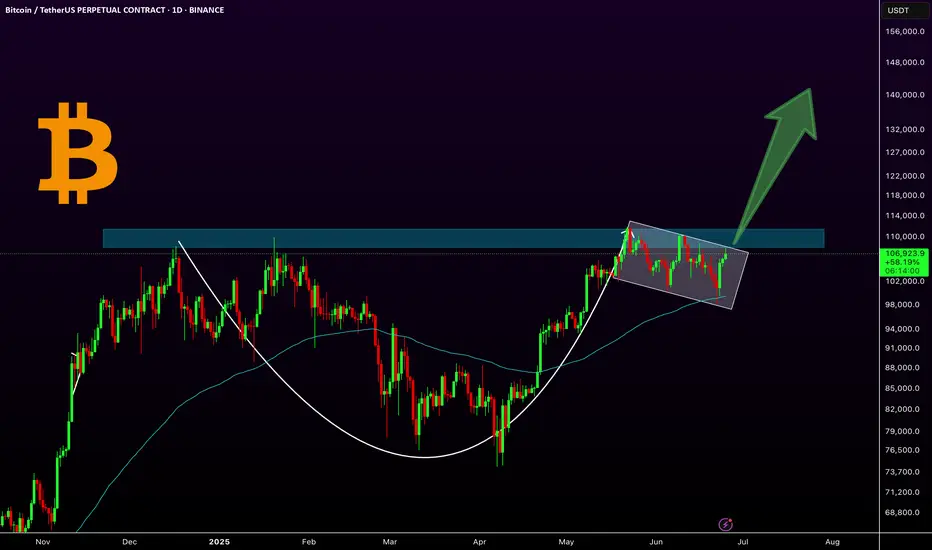
BTC: A Classic Cup & Handle in Play!Bitcoin has formed a classic cup and handle pattern on the daily chart, with the 100 EMA providing solid support during the handle formation. Currently, the price is consolidating in what appears to be a bullish flag or extended handle, just below the key resistance zone around $109K. A breakout above this level could ignite a strong bullish rally toward higher targets like $144k.
Key Highlights:
-Cup & Handle pattern confirmed
-10 EMA acting as dynamic support
-Bullish flag/handle forming near resistance
- A breakout could lead to explosive upside
Regards
Hexa
CRYPTOCAP:BTC BITSTAMP:BTCUSD
BTCUSDT Trade SetupBTC Still in sideways no major move, wait for the entries. While on weekly tf still expecting a final shakeout, 95-93k then a final leg up towards to 120k. For now wait for the entries to be filled first then must use sl.

BTCUSDT:Sharing of the Latest Trading StrategyAll the trading signals last week have resulted in profits!!! Check it!!!👉👉👉
Bitcoin Technical Analysis (4-Hour Chart):
Price remains within an ascending channel. The MACD above the zero line with expanding red histograms indicates bullish dominance. After firmly breaking above the key resistance at $105,000, price is testing $110,000.
Caution: The RSI near 70 has entered overbought territory, increasing short-term pullback risks.
Support levels: $106,000 and $105,000.
Trading Recommendation for Aggressive Traders
Consider light long positions near $106,000 on pullbacks, with stop-loss set below $105,000.
Trading Strategy:
buy@105000-106000
TP:108000-110000

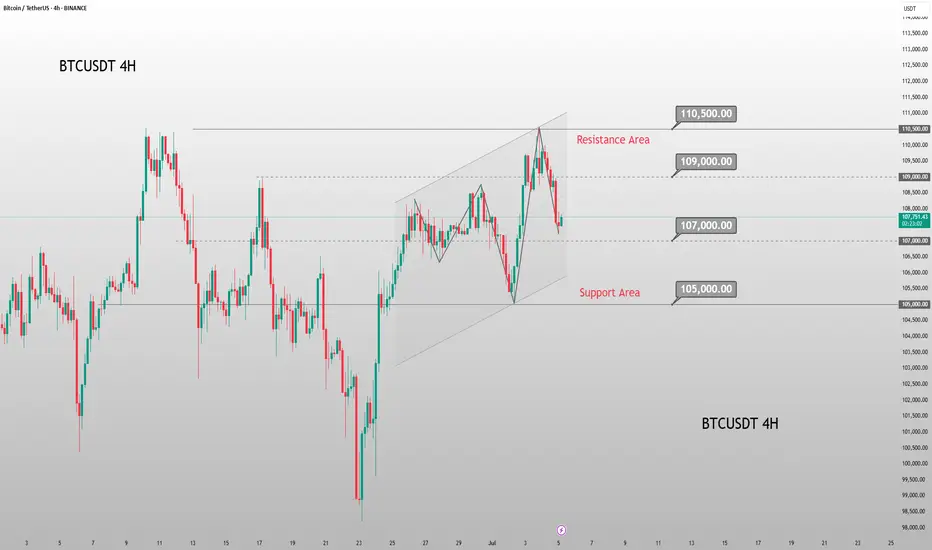
BTC Slumps Below 100000, Rebounds to Test 109500 Short Zone💎 BTC Rebounds After 100000 Drop, Eyes Short at 109500 Resistance 📊
BTC dipped below the 100000 threshold 🔻 before rebounding near 98000 🔺—a move tied to DXY weakness and easing geopolitical tensions. Now challenging the 110000 mark 🔼, it faces stiff resistance at 109500. First-time 110000 tests often spark pullbacks, making shorts the favored play here 📉.
🚀 Sell@108500 - 107500
🚀 TP 106500 - 105500
Accurate signals are updated every day 📈 If you encounter any problems during trading, these signals can serve as your reliable guide 🧭 Feel free to refer to them! I sincerely hope they'll be of great help to you 🌟 👇

Signs of Bullish Reversal EmergingAs of today’s close, Bitcoin (BTCUSD) is showing early signs of a potential bullish reversal from a key mid-range Keltner Channel support zone. The recent Heikin Ashi candle reflects a strong recovery after a brief sell-off, with price rejecting lower support levels and closing firmly within the mid-band.
🔹 Key Observations:
Support Zone Respected: Price action respected the mid-Keltner Channel support, suggesting underlying buying interest around the $103k–$104k range.
Momentum Shift: The bullish engulfing nature of the current candle implies a potential shift in momentum, especially after recent consolidation below the upper range.
🔹Trade Idea: TP is near $112k, SL just under $102k.
Continued confirmation above the mid-band and sustained bullish volume will be critical for this move to extend.

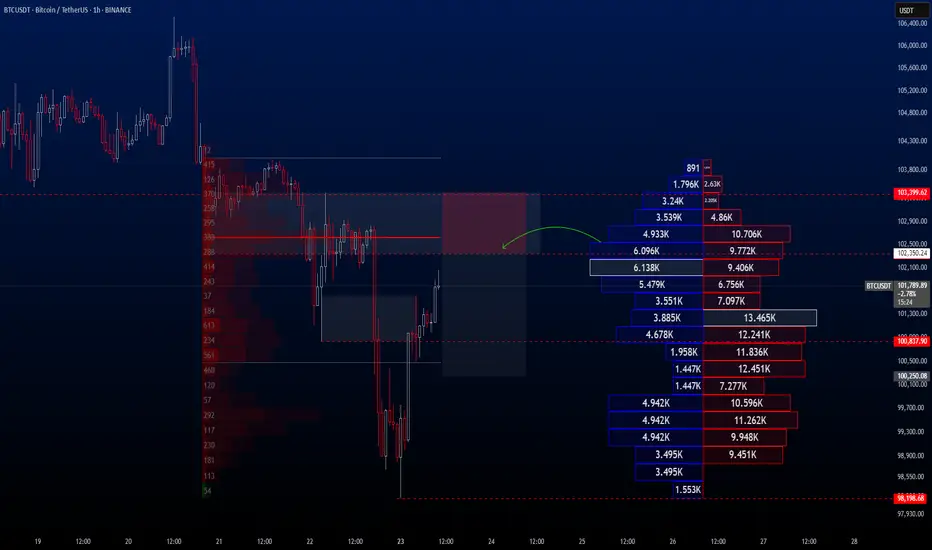
BTCUSDT Hello traders.
The BTCUSDT trade I shared the other day played out just as expected, with BTC experiencing a significant drop in value shortly after. The price fell all the way down to the 98K level.
Following this decline, I anticipate a short-term rebound toward the 102K–103K range, after which I expect the downtrend to resume. Therefore, I’ve placed a Sell Limit order at 102,350, and I’m currently waiting for the price to reach that level.
If you'd like, you can consider this opportunity in the same way.
🔍 Trade Details
✔️ Timeframe: 1-Hour
✔️ Risk-to-Reward Ratio: 1:2
✔️ Trade Direction: Sell Limit
✔️ Entry Price: 102,350.24
✔️ Take Profit: 100,250.08
✔️ Stop Loss: 103,399.62
🕒 If the trade doesn’t gain strong momentum, I will keep the position open only until 23:00 (UTC+4) today. Otherwise, I will manually close the trade—either in profit or at a loss—depending on price action.
🔔 Disclaimer: This is not financial advice. I’m simply sharing a trade I’ve taken based on my personal trading system, strictly for educational and illustrative purposes.
📌 Interested in a systematic, data-driven trading approach?
💡 Follow the page and turn on notifications to stay updated on future trade setups and advanced market insights.
Expect BTC/USD to drop to 102000 post-Fed rate decisionBTC/USD Update 📈
BTC rebounded from 103500 support, now at ~105500. Short-term correction may test 100000 psychological support ⚠️
I think the Fed's interest rate decision this time may cause BTCUSD to drop directly to 102000 .
⚡️⚡️⚡️ BTCUSD ⚡️⚡️⚡️
🚀 Sell@ 105000 - 104500
🚀 TP 102500 - 101500
Accurate signals are updated every day 📈 If you encounter any problems during trading, these signals can serve as your reliable guide 🧭 Feel free to refer to them! I sincerely hope they'll be of great help to you 🌟 👇


BTC Trend Analysis and Trading Recommendations for TodayThe BTC market continues its sideways-down trend, with notably insufficient rebound momentum during the session. Although there were brief signs of stabilization in the early trading, bearish forces continued to exert pressure during the European session, and the index showed a staircase decline.
From the 4-hour chart analysis, the price once fell to touch the middle Bollinger Band support during the Asian session, followed by a technical rebound. However, the rebound strength was obviously weak, encountering strong resistance near the middle band. The current candlestick pattern presents a typical Dark Cloud Cover, the MACD indicator continues to release volume below the zero axis, with fast and slow lines in bearish alignment.
Technically, the price remains significantly pressured near the middle band, and the US session is likely to extend the existing downtrend. Investors are advised to maintain a bearish stance. If the price effectively breaks below the middle band support, the next target is targeted at the lower Bollinger Band. Strategically, fading rallies remains the preferred approach.
BTCUSD
sell@106500-106000
tp:105000-104000

BTC/USD – Bearish Continuation from Rising Channel BTC/USD – Bearish Continuation from Rising Channel 🚨🧱
This chart indicates a bearish market structure with the following key technical features:
🔍 Chart Analysis:
Change of Character (CHoCH) 🔄
A shift from bullish to bearish was confirmed by a strong breakdown after the CHoCH marked at the top.
This breakdown invalidated previous bullish structure.
Bearish Flag Formation 📉📐
After the impulsive drop, price formed a bearish flag (rising channel), suggesting a potential continuation move to the downside.
Resistance Rejection 🚫
Price is currently testing and rejecting the 105,800–106,500 resistance zone, previously a support turned resistance.
The rejection from this level adds further bearish confluence.
Downside Projection ⬇️📍
If the pattern plays out, the projected move shows a potential drop toward the major support zone at 100,000–101,000.
📌 Key Levels:
Resistance Zones:
105,800–106,500 🧱
109,500–111,000 🧱
Support Zone:
100,000–101,000 💚
🧠 Conclusion:
The chart suggests that BTC/USD is in a bearish continuation phase, with strong rejection from key resistance and a confirmed breakdown from a bearish flag. Traders should watch for confirmation of continuation below 104,500 to target the 100k support level. Risk management is crucial near volatile zones.

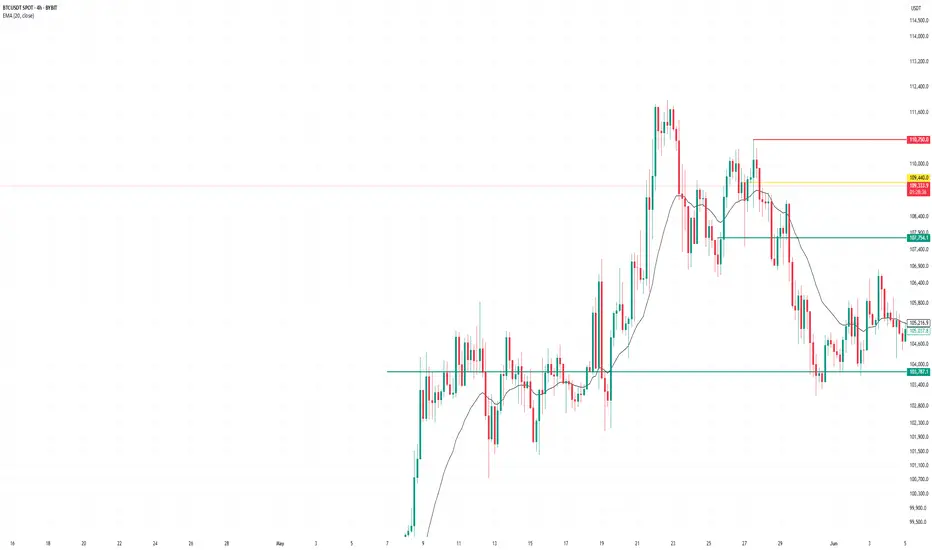
BTC/USD Technical Outlook – Potential Bearish Continuation BelowBTC/USD Technical Outlook – Potential Bearish Continuation Below Resistance 📉🧊
Chart Overview:
The chart illustrates a clear bearish rejection from a major resistance zone (⚠️ 110,000–111,000 USD), followed by the emergence of a bearish engulfing candle 🔻 marked in orange. This move suggests selling pressure has returned after a short-term bullish rally.
Key Zones & Levels:
🔵 Resistance Zone: 110,000–111,000 USD
Price was rejected from this region with a strong bearish reaction.
🟣 Mid-level Support: 105,531 USD
Currently acting as an interim level — if broken, it may lead to deeper declines.
🔵 Support Zone: 100,500–101,500 USD
This is the next strong demand area — price previously rebounded strongly from here.
Technical Signals:
✅ Double Top Structure formation at the resistance zone, indicating trend exhaustion.
❌ Bearish Engulfing Candle near resistance, confirming reversal strength.
📉 Downward Momentum Arrow suggests possible continuation toward support.
🔻 Lower Highs Formation reinforces bearish sentiment after failed breakout attempts.
Projection 🎯:
If the price closes below 105,531, a bearish continuation is likely, targeting the support zone at 101,000–100,500.
Conversely, a strong bounce above this level could delay the drop, but upside is capped below 110,000 unless a breakout occurs.
Summary:
🧭 Bias: Bearish below 105,531
📍 Targets:
Immediate: 105,531 (key level)
Bearish Target: 101,000
Invalidated if: price reclaims and closes above 110,000 with strength
📊 Trader's Note: Look for confirmation of breakdown with volume or candle close before short entry. Set tight risk management due to volatility.


btc updateentry price 109416
stop loss 110500
take profit
107800
103800
result 1 target and risk free
Technical Analysis – BTC/USD Technical Analysis – BTC/USD
📅 Date: June 11, 2025
🔍 Key Observations:
🔴 Resistance Zone – $110,000 to $111,800
Price has tested this resistance block twice (🔴 red arrows) and rejected both times, indicating strong selling pressure in this zone.
Rejection candles show long upper wicks, suggesting failed attempts by bulls to break above.
🟢 Support Zone – $101,800 to $103,500
This demand zone has been respected multiple times (🟢 green arrows), showing a solid base for potential bounces.
Price action previously rallied strongly after touching this level.
📦 Supply to Demand Play
Price made a sharp bullish move from support to resistance (📘 blue box shows the impulsive move).
After reaching resistance, the price is failing to break above, indicating possible exhaustion of bullish momentum.
📉 Potential Move:
🔽 Short-Term Bearish Bias
If price fails to hold current levels and breaks below the small consolidation (after blue box), we may see a drop to ~$105,583 (🔵 purple line = key level).
If that breaks, next likely destination is the support zone around $102,000 (⬇️ downward arrow path).
⚠️ Risk Notes:
🔁 Watch for any false breakouts or liquidity grabs above resistance.
📉 If bearish momentum increases below $105,583, sellers may take control in the short term.
✅ Trade Idea (Hypothetical):
Sell/Short near resistance (⚠️ confirmation needed like bearish engulfing or failed breakout)
Target 1: $105,583
Target 2: $102,000 zone
Stop-loss: Above $111,800 (invalidates setup)
📌 Summary:
BTC/USD is currently stuck between a well-defined resistance and support range. Unless bulls break above $111,800 with strong momentum, the structure favors a potential pullback toward the demand zone. ⚖️

BTCUSDT Hello traders. I’ve spotted an ideal entry opportunity on the BTCUSDT pair. I’ve taken the trade and wanted to share it with you as well.
🔍 Trade Details
✔️ Timeframe: 15-Minute
✔️ Risk-to-Reward Ratio: 1:2
✔️ Trade Direction: Buy
✔️ Entry Price: 109,357.89
✔️ Take Profit: 110,502.43
✔️ Stop Loss: 108,768.53
🔔 Disclaimer: This is not financial advice. I’m simply sharing a trade I’ve taken based on my personal trading system, strictly for educational and illustrative purposes.
📌 Interested in a systematic, data-driven trading approach?
💡 Follow the page and turn on notifications to stay updated on future trade setups and advanced market insights.

Shorting Opportunity EmergesBTC has seen significant volatility recently. 📊 After failing to break below 100,000 yesterday, it rebounded sharply to 108,500 immediately. ⚡ Now is precisely the opportunity to go short. 📉
⚡️⚡️⚡️ BTCUSD ⚡️⚡️⚡️
🚀 Sell@ 109000 - 108500
🚀 TP 105000 - 103000
Accurate signals are updated every day 📈 If you encounter any problems during trading, these signals can serve as your reliable guide 🧭 Feel free to refer to them! I sincerely hope they'll be of great help to you 🌟 👇

BTC Bears Eye 100000 Break; Short at 107000 -108000 ResistanceBTC's downward movement failed to break through 100,000📉, but there is a clear downward trend, and breaking below 100,000 is only a matter of time⏳. In the short term, shorting at high levels can be considered📉. The upward resistance currently has difficulty breaking through 110,000🚧, and shorting can now be considered in the resistance range of 107,000-108,000📉
⚡️⚡️⚡️ BTCUSD ⚡️⚡️⚡️
🚀 Sell@ 107000 - 106000
🚀 TP 102000 - 98000
Accurate signals are updated every day 📈 If you encounter any problems during trading, these signals can serve as your reliable guide 🧭 Feel free to refer to them! I sincerely hope they'll be of great help to you 🌟 👇

BTCUSDT Hello everyone. I’ve spotted a sell opportunity on BTCUSDT and have already activated the trade. I wanted to share the same setup with you as well.
🔍 Trade Details:
✔️ Timeframe: 15-Minute
✔️ Risk-to-Reward Ratio: 1:1 / 1:1.50
✔️ Trade Direction: Sell
✔️ Entry Price: 106155.39
✔️ Take Profit: 105560.48
✔️ Stop Loss: 106550.09
🔔 Disclaimer: This is not financial advice. I’m simply sharing a trade I’ve taken based on my personal trading system, strictly for educational and illustrative purposes.
📌 Interested in a systematic, data-driven trading approach?
💡 Follow the page and turn on notifications to stay updated on future trade setups and advanced market insights.

BTCUSDT 4H AnalysisBTC ~ 4H Analysis
#BTC On the 4H Time frame Bitcoin is retesting this multi support level. Let's see how far this support can hold.

BTCUSDT 4H Analysis BTC ~ 4H Analysis
#BTC Let's start Long/Buy back at this support block with long term target of $120K - $130K - $140K - $150K above this is just bonus for you.

BTCUSDT Hello everyone!
Today's first signal came from the BTCUSDT pair. After reaching an all-time high of $112,000 yesterday, BTC formed an ABCD pattern and retraced down to the Fibonacci extension level 1.000. In this pattern, a buy trade is typically initiated after the price retraces to the 1.000 level, and the Take Profit is set at the 0.618 Fibonacci level drawn from the B wave to the D wave.
Although I didn’t open this trade based on the ABCD strategy, I noticed the pattern forming and wanted to share it with you purely for educational purposes.
As for the current active trade, here are the detailed parameters:
🔍 Trade Details:
✔️ Timeframe: 15-Minute
✔️ Risk-to-Reward Ratio: 1:1.50
✔️ Trade Direction: Buy
✔️ Entry Price: 110844.19
✔️ Take Profit: 111497.09
✔️ Stop Loss: 110408.00
🔔 Disclaimer: This is not financial advice. I'm sharing a trade I'm personally taking based on my own system, strictly for educational and illustrative purposes.
📌 Interested in a systematic, data-driven approach to trading?
💡 Follow the page and turn on notifications to stay informed about future trade ideas and advanced market insights.
