Bitcoin Bullish Flag Pattern Analysis & $140,000 Target🚩 Bullish Flag Pattern Formation
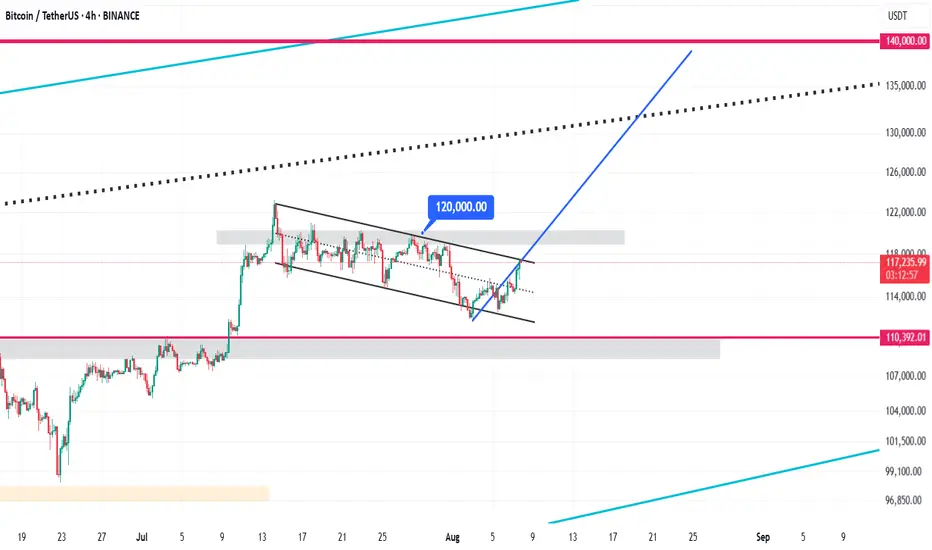
Bitcoin is currently forming a bullish flag pattern on the 4-hour chart. This pattern typically appears after a sharp upward move and represents a short-term consolidation within a descending channel. It usually signals a continuation of the strong bullish trend. Currently, the price is oscillating between the upper and lower boundaries of this channel, poised for a potential breakout.
⏳ Duration of the Correction Phase
The correction inside this channel has lasted from July 14 to August 8, 2025, spanning approximately 25 days. This relatively long consolidation period indicates a deep stabilization phase, allowing the market to gather momentum for the next upward wave. During this time, Bitcoin traded in a tight range between the channel’s support and resistance levels.
⚠️ Critical Resistance at $120,000
The key resistance level to watch is $120,000. If Bitcoin can break this level decisively with strong volume and confirming candles, the bullish flag pattern will be validated, signaling a continuation of the upward trend. This breakout point is considered an optimal entry for new long positions.
🎯 Price Target at $140,000
The target price derived from the bullish flag pattern, calculated by measuring the flagpole and projecting it from the breakout point, is around $140,000. This represents approximately a 20% gain from the breakout and may serve as a significant psychological resistance level.
Btcysdt

BTCUSDT | Goals for next weekHello everyone, I wrote a new idea for you. I think it's easy to like and subscribe to the channel, thanks😉
📌Friends, the weekend passes as usual without any sudden movements until we are below $20,000 again
▫️From the technical side, the price is in the border of the "descending wedge" gradually squeezing the $20.400 resistance zone, the $19.000-19.500 zone still remains an important zone support
▫️At the moment we are trading in the $19.800 zone, I think there is a chance to get below $19.200-19.500 over the weekend.
💡Goals for the next week remain unchanged, wrote about it (here). I think we're about to see a bullish week. This is evidenced by the S&X500 chart and the dominance of bitcoin, which is at almost the bottom.

BTC will be bullish over the next few days BTC will be bullish over the next few days.
With Eliott's waves we can see that BTC is going up again, we have a first support in the 32K area, a 2nd one in the 42K area, I would be rather long with a target at $46700
Let's do it

Bitcoin - Parallel Channel and Resistance ZonesPay attention to the resistance zones. We are moving in a parallel channel.

Bitcoin is BEARISH for short termwe just break the trend line and #Bitcoin is short-term bearish it's just a retracement,so with that in mind from this box I expect it to rise up


